

Diagnosis of pulmonary tuberculosis via identification of core genes and pathways utilizing blood transcriptional signatures: a multicohort analysis
- PMID: 35568895
- PMCID: PMC9107189
- DOI: 10.1186/s12931-022-02035-4
Diagnosis of pulmonary tuberculosis via identification of core genes and pathways utilizing blood transcriptional signatures: a multicohort analysis
Abstract
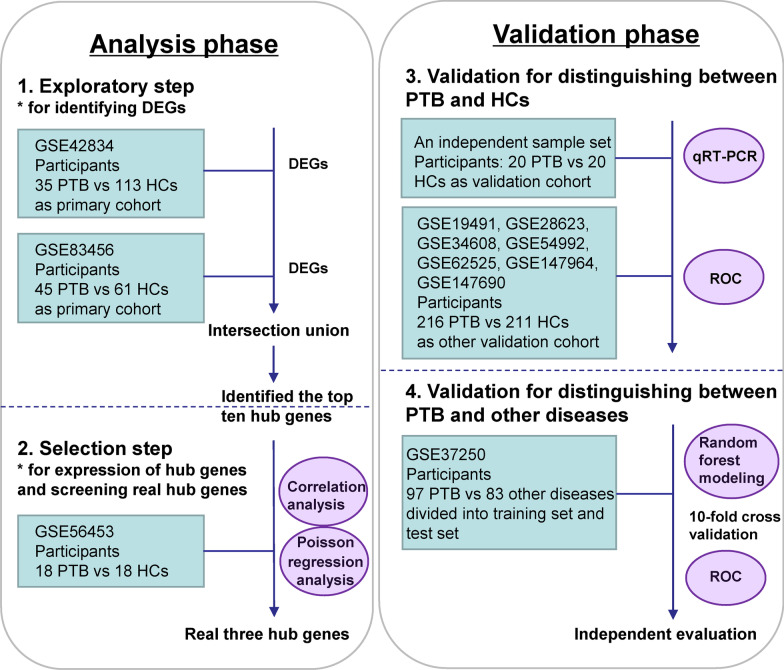
Background: Blood transcriptomics can be used for confirmation of tuberculosis diagnosis or sputumless triage, and a comparison of their practical diagnostic accuracy is needed to assess their usefulness. In this study, we investigated potential biomarkers to improve our understanding of the pathogenesis of active pulmonary tuberculosis (PTB) using bioinformatics methods.
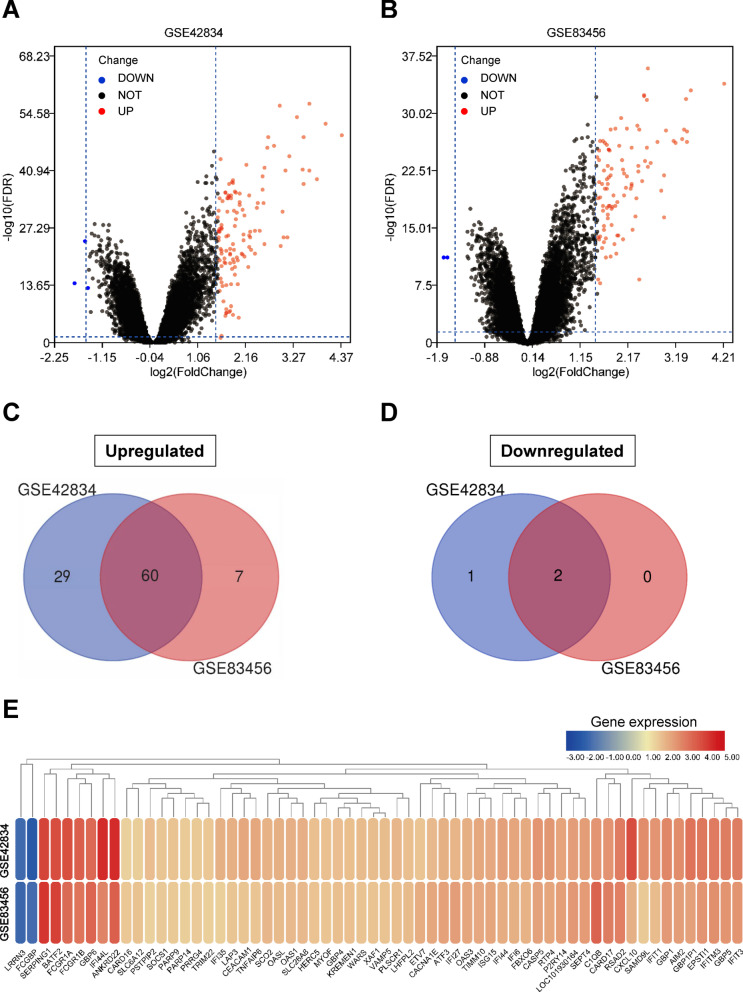
Methods: Differentially expressed genes (DEGs) were analyzed between PTB and healthy controls (HCs) based on two microarray datasets. Pathways and functional annotation of DEGs were identified and ten hub genes were selected. They were further analyzed and selected, then verified with an independent sample set. Finally, their diagnostic power was further evaluated between PTB and HCs or other diseases.
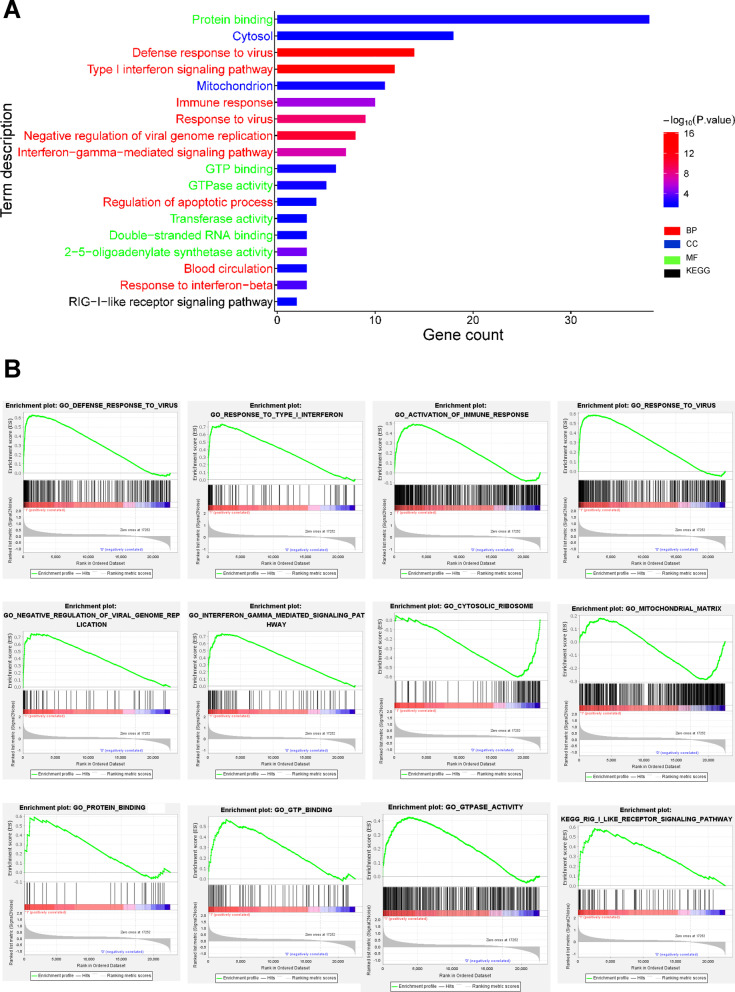
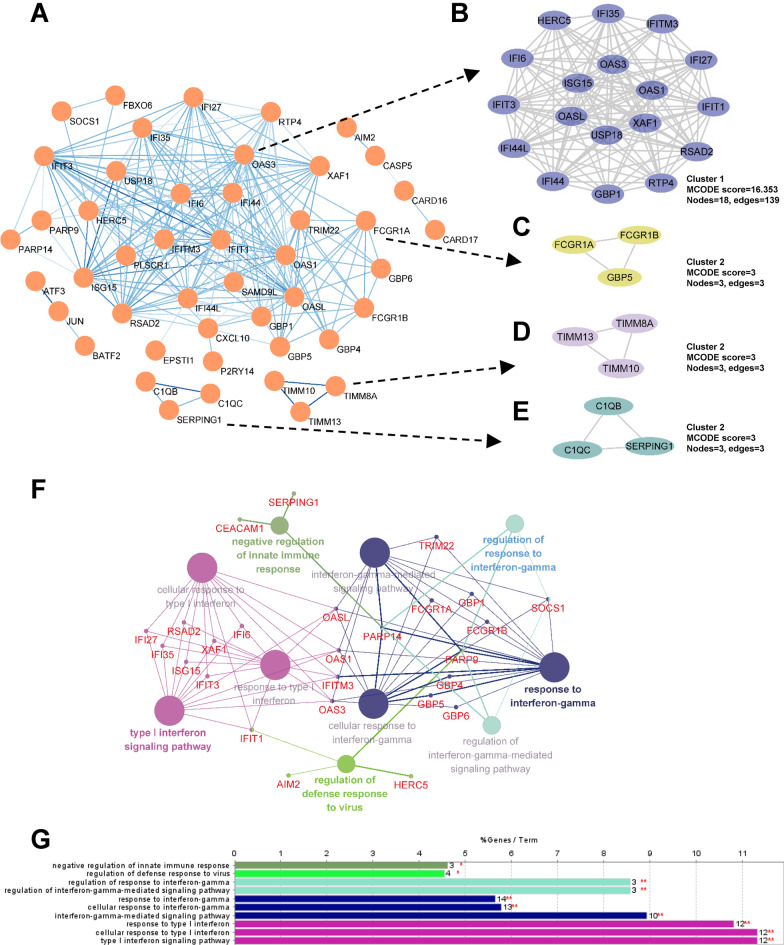
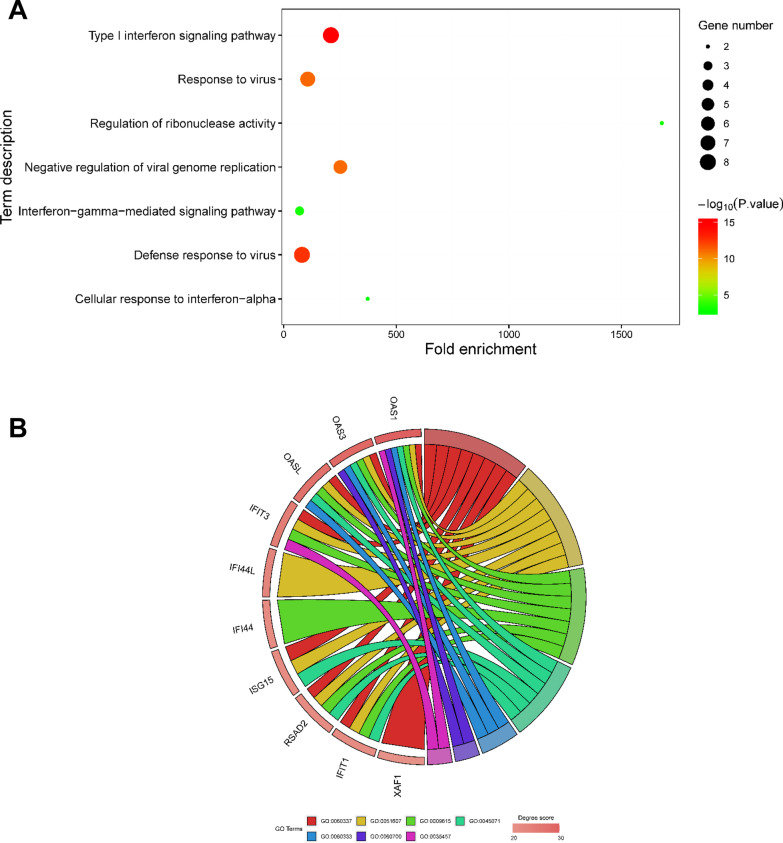
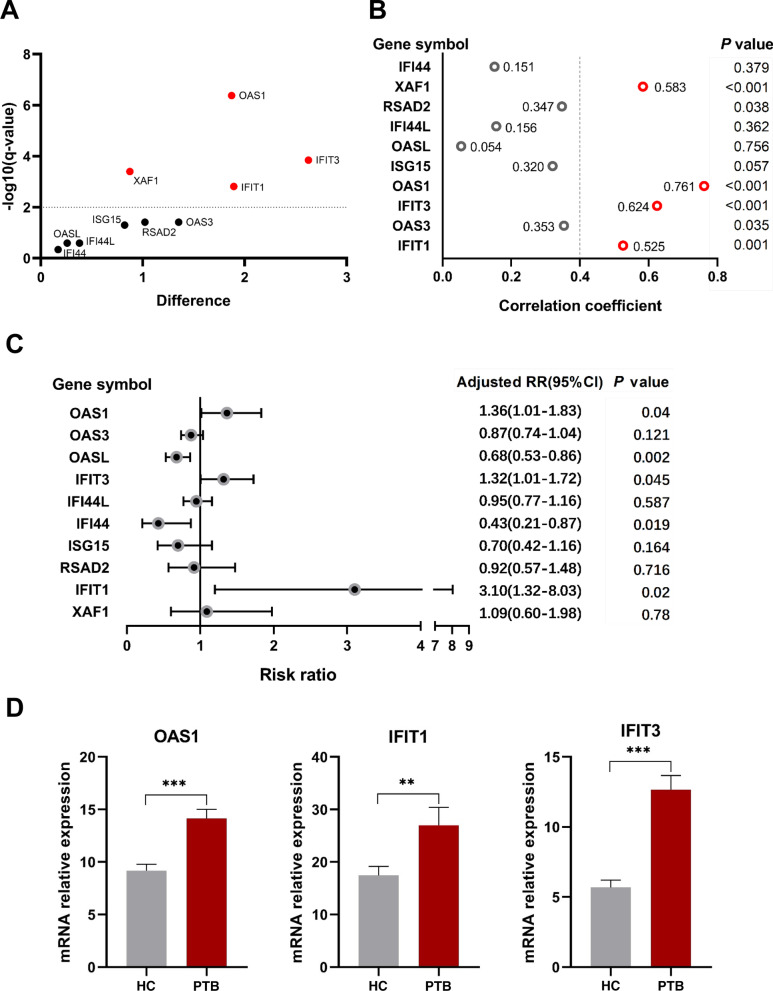
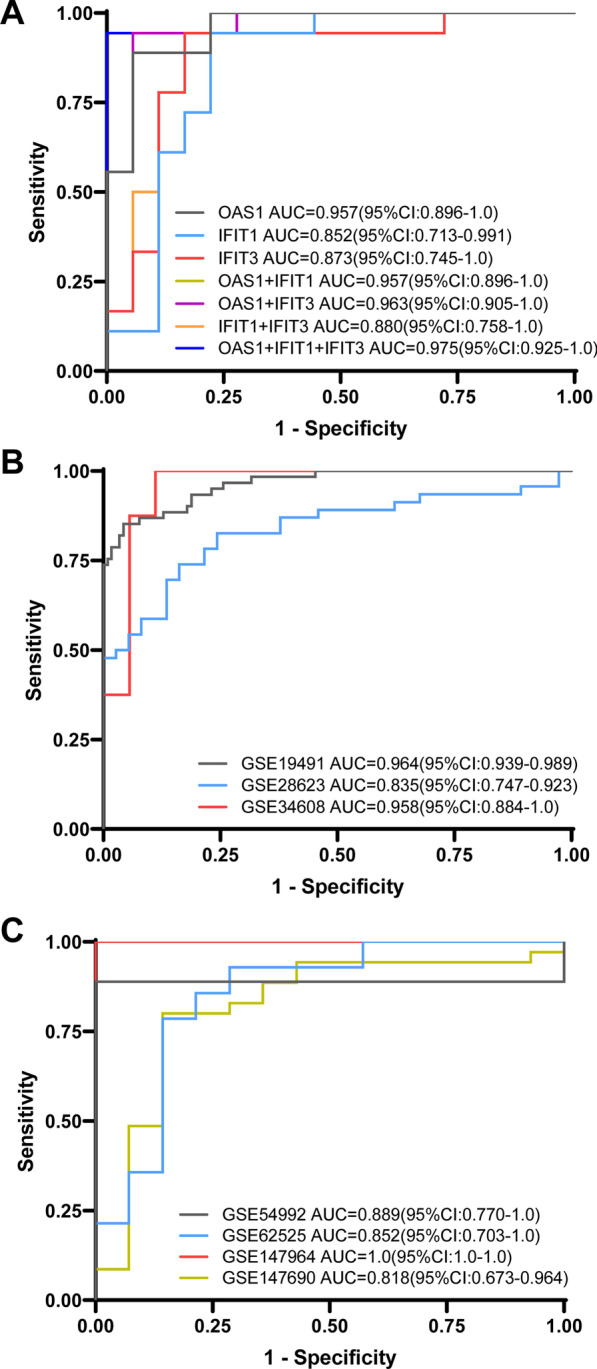
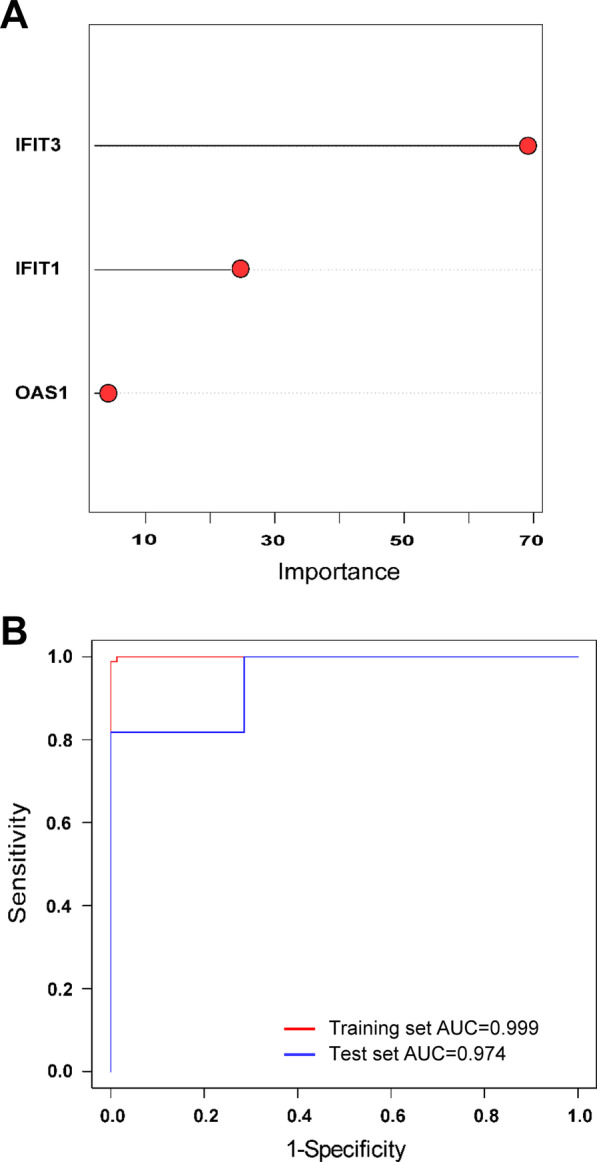
Results: 62 DEGs mostly related to type I IFN pathway, IFN-γ-mediated pathway, etc. in GO term and immune process, and especially RIG-I-like receptor pathway were acquired. Among them, OAS1, IFIT1 and IFIT3 were upregulated and were the main risk factors for predicting PTB, with adjusted risk ratios of 1.36, 3.10, and 1.32, respectively. These results further verified that peripheral blood mRNA expression levels of OAS1, IFIT1 and IFIT3 were significantly higher in PTB patients than HCs (all P < 0.01). The performance of a combination of these three genes (three-gene set) had exceeded that of all pairwise combinations of them in discriminating TB from HCs, with mean AUC reaching as high as 0.975 with a sensitivity of 94.4% and a specificity of 100%. The good discernibility capacity was evaluated d via 7 independent datasets with an AUC of 0.902, as well as mean sensitivity of 87.9% and mean specificity of 90.2%. In regards to discriminating PTB from other diseases (i.e., initially considered to be possible TB, but rejected in differential diagnosis), the three-gene set equally exhibited an overall strong ability to separate PTB from other diseases with an AUC of 0.999 (sensitivity: 99.0%; specificity: 100%) in the training set, and 0.974 with a sensitivity of 96.4% and a specificity of 98.6% in the test set.
Conclusion: The described commonalities and unique signatures in the blood profiles of PTB and the other control samples have considerable implications for PTB biosignature design and future diagnosis, and provide insights into the biological processes underlying PTB.
Keywords: Expression profiling data; Hub genes; IFIT1; IFIT3; OAS1; Pulmonary tuberculosis.
© 2022. The Author(s).
Conflict of interest statement
The authors declare that they have no competing interests.
Figures
Similar articles
-
Gene network in pulmonary tuberculosis based on bioinformatic analysis.BMC Infect Dis. 2020 Aug 18;20(1):612. doi: 10.1186/s12879-020-05335-6. BMC Infect Dis. 2020. PMID: 32811479 Free PMC article.
-
Identification and role of differentially expressed genes/proteins between pulmonary tuberculosis patients and controls across lung tissues and blood samples.Immun Inflamm Dis. 2024 Jul;12(7):e1350. doi: 10.1002/iid3.1350. Immun Inflamm Dis. 2024. PMID: 39023413 Free PMC article.
-
A bioinformatics analysis to identify novel biomarkers for prognosis of pulmonary tuberculosis.BMC Pulm Med. 2020 Oct 24;20(1):279. doi: 10.1186/s12890-020-01316-2. BMC Pulm Med. 2020. PMID: 33099324 Free PMC article.
-
Integrated bioinformatics analysis of dendritic cells hub genes reveal potential early tuberculosis diagnostic markers.BMC Med Genomics. 2023 Sep 8;16(1):214. doi: 10.1186/s12920-023-01646-0. BMC Med Genomics. 2023. PMID: 37684607 Free PMC article.
-
Past and Present Approaches to Diagnosis of Active Pulmonary Tuberculosis.Front Med (Lausanne). 2021 Sep 23;8:709793. doi: 10.3389/fmed.2021.709793. eCollection 2021. Front Med (Lausanne). 2021. PMID: 34631731 Free PMC article. Review.
Cited by
-
Inhibition of host PARP1 contributes to the anti-inflammatory and antitubercular activity of pyrazinamide.Nat Commun. 2023 Dec 9;14(1):8161. doi: 10.1038/s41467-023-43937-1. Nat Commun. 2023. PMID: 38071218 Free PMC article.
-
Multi-cohort analysis reveals immune subtypes and predictive biomarkers in tuberculosis.Sci Rep. 2024 Jun 10;14(1):13345. doi: 10.1038/s41598-024-63365-5. Sci Rep. 2024. PMID: 38858405 Free PMC article.
-
Distinguish active tuberculosis with an immune-related signature and molecule subtypes: a multi-cohort analysis.Sci Rep. 2024 Nov 28;14(1):29564. doi: 10.1038/s41598-024-80072-3. Sci Rep. 2024. PMID: 39609541 Free PMC article.
-
Leveraging a neutrophil-derived PCD signature to predict and stratify patients with acute myocardial infarction: from AI prediction to biological interpretation.J Transl Med. 2024 Jul 2;22(1):612. doi: 10.1186/s12967-024-05415-0. J Transl Med. 2024. PMID: 38956669 Free PMC article.
-
Identification of immune biomarkers in recent active pulmonary tuberculosis.Sci Rep. 2023 Jul 17;13(1):11481. doi: 10.1038/s41598-023-38372-7. Sci Rep. 2023. PMID: 37460564 Free PMC article.
References
-
- Organization WH. Global tuberculosis report 2019. Geneva: World Health Organization; 2020. p. 2020.
-
- Zhang Y, Zhang X, Zhao Z, Zheng Y, Xiao Z, Li F. Integrated bioinformatics analysis and validation revealed potential immune-regulatory miR-892b, miR-199b-5p and miR-582-5p as diagnostic biomarkers in active tuberculosis. Microb Pathog. 2019;134:103563. doi: 10.1016/j.micpath.2019.103563. - DOI - PubMed
MeSH terms
Substances
Grants and funding
LinkOut - more resources
Full Text Sources
Medical
Research Materials
