. 2022 May 14;19(1):110.
doi: 10.1186/s12974-022-02466-2.

High-fat diet exacerbates cognitive decline in mouse models of Alzheimer's disease and mixed dementia in a sex-dependent manner

Affiliations

High-fat diet exacerbates cognitive decline in mouse models of Alzheimer's disease and mixed dementia in a sex-dependent manner

Olivia J Gannon et al. J Neuroinflammation. .

Abstract

Background: Approximately 70% of Alzheimer's disease (AD) patients have co-morbid vascular contributions to cognitive impairment and dementia (VCID); this highly prevalent overlap of dementia subtypes is known as mixed dementia (MxD). AD is more prevalent in women, while VCID is slightly more prevalent in men. Sex differences in risk factors may contribute to sex differences in dementia subtypes. Unlike metabolically healthy women, diabetic women are more likely to develop VCID than diabetic men. Prediabetes is 3× more prevalent than diabetes and is linked to earlier onset of dementia in women, but not men. How prediabetes influences underlying pathology and cognitive outcomes across different dementia subtypes is unknown. To fill this gap in knowledge, we investigated the impact of diet-induced prediabetes and biological sex on cognitive function and neuropathology in mouse models of AD and MxD.

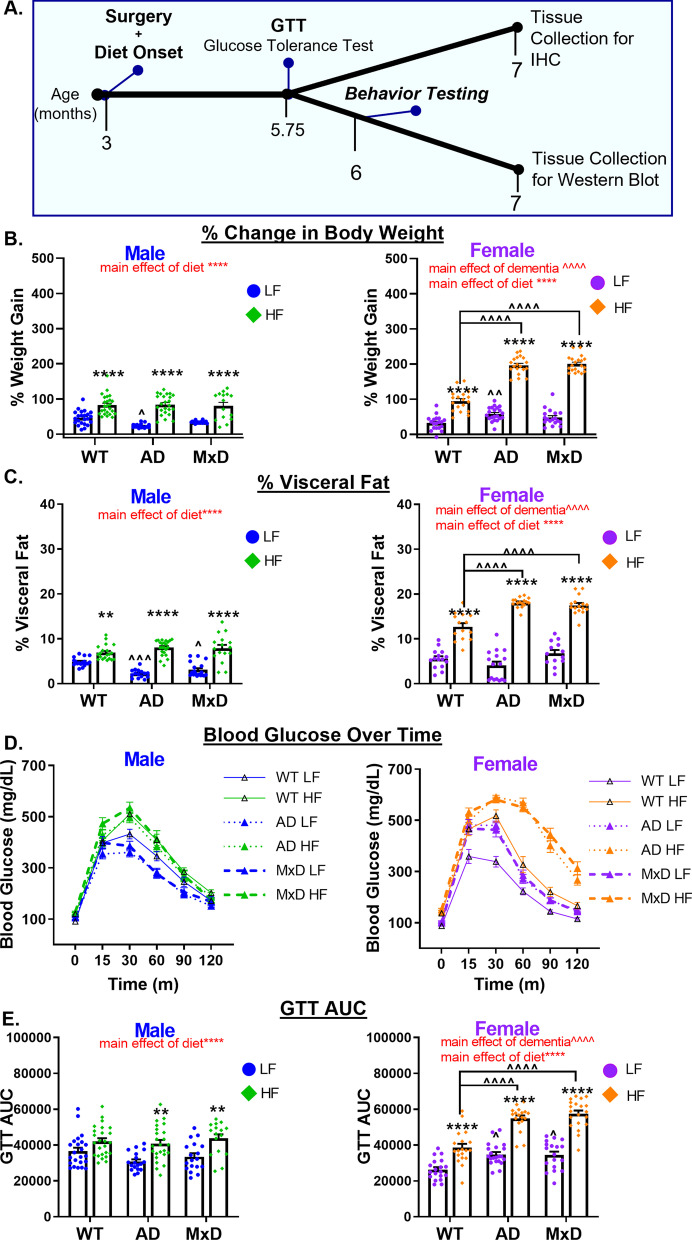
Methods: Male and female 3xTg-AD mice received a sham (AD model) or unilateral common carotid artery occlusion surgery to induce chronic cerebral hypoperfusion (MxD model). Mice were fed a control or high fat (HF; 60% fat) diet from 3 to 7 months of age. In both sexes, HF diet elicited a prediabetic phenotype (impaired glucose tolerance) and weight gain.

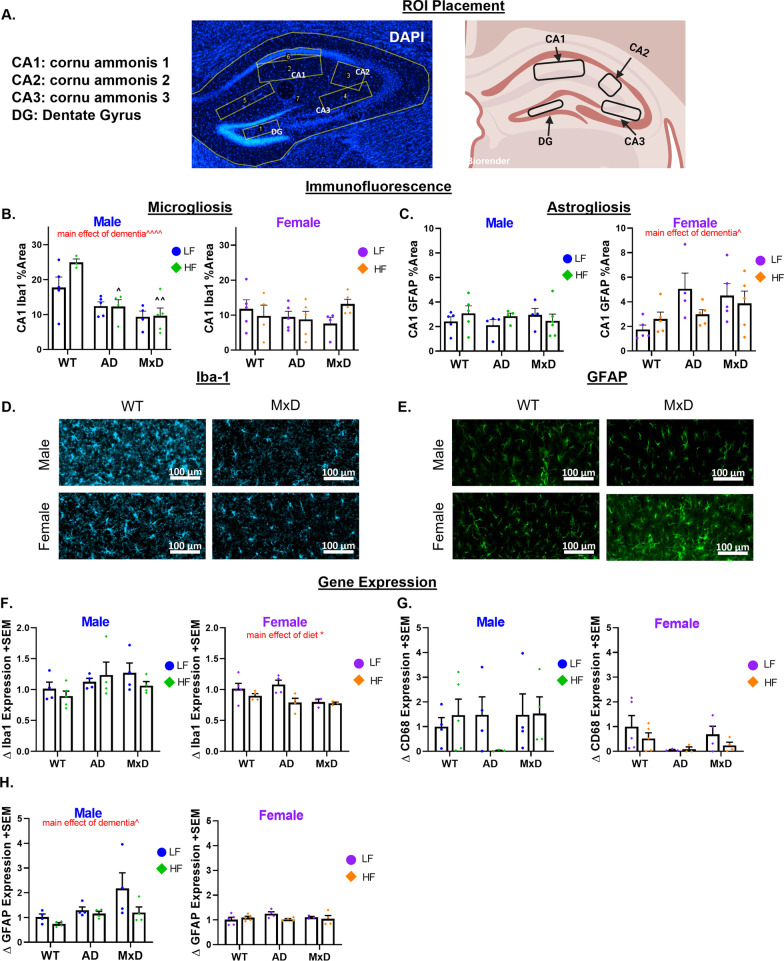
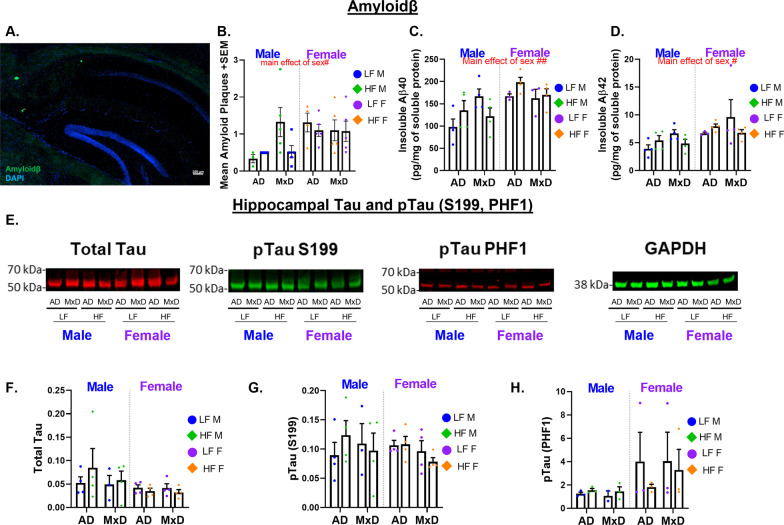
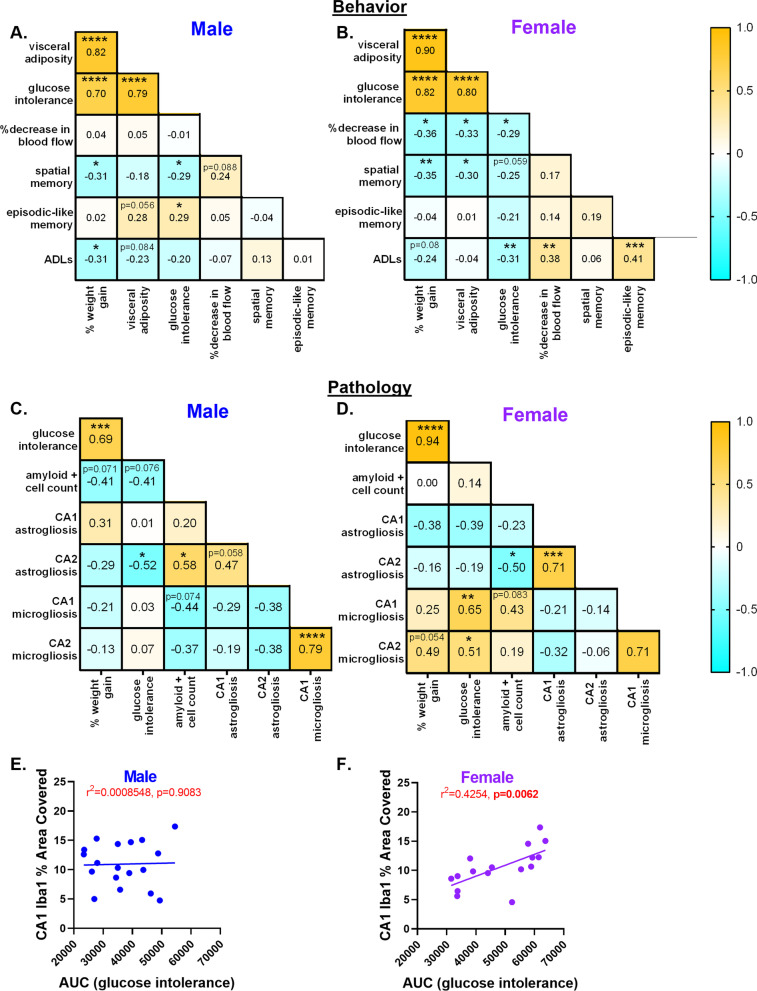
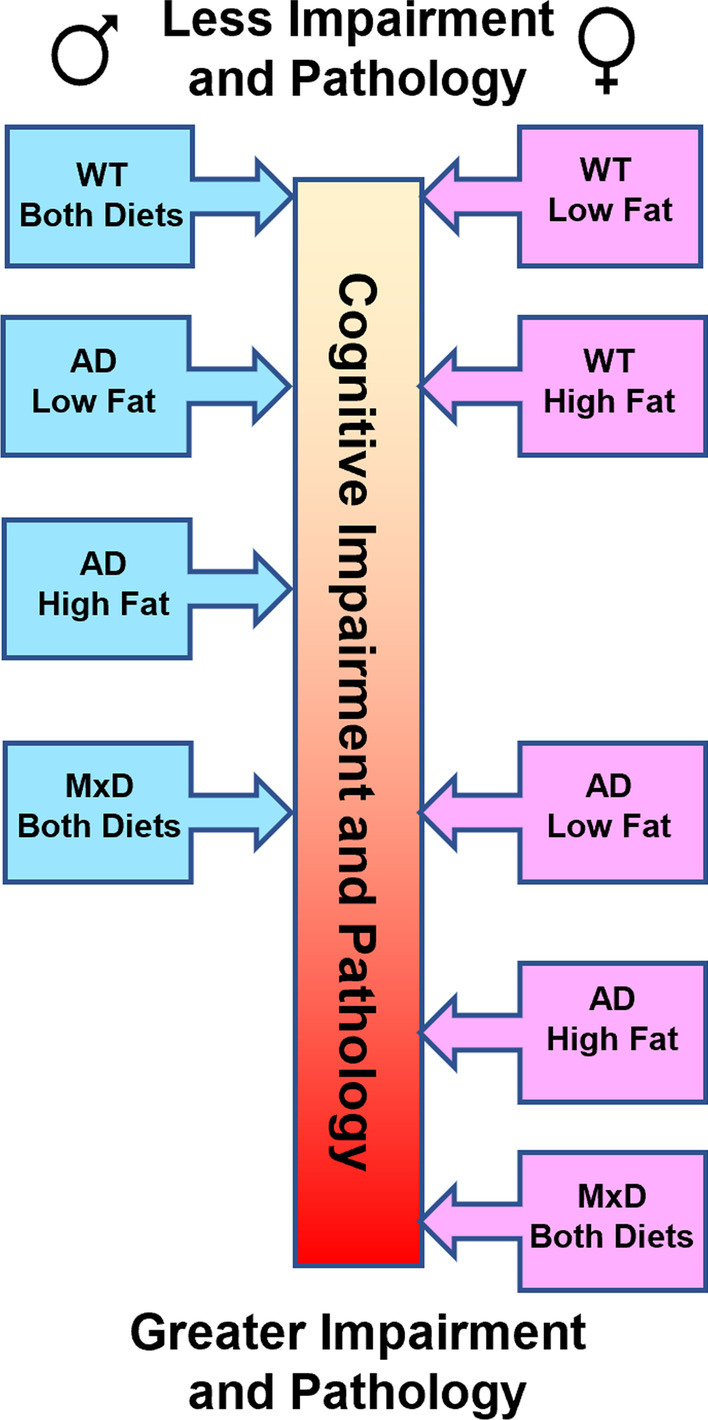
Results: In females, but not males, metabolic consequences of a HF diet were more severe in AD or MxD mice compared to WT. In both sexes, HF-fed AD or MxD mice displayed deficits in spatial memory in the Morris water maze (MWM). In females, but not males, HF-fed AD and MxD mice also displayed impaired spatial learning in the MWM. In females, but not males, AD or MxD caused deficits in activities of daily living, regardless of diet. Astrogliosis was more severe in AD and MxD females compared to males. Further, AD/MxD females had more amyloid beta plaques and hippocampal levels of insoluble amyloid beta 40 and 42 than AD/MxD males. In females, but not males, more severe glucose intolerance (prediabetes) was correlated with increased hippocampal microgliosis.

Conclusions: High-fat diet had a wider array of metabolic, cognitive, and neuropathological consequences in AD and MxD females compared to males. These findings shed light on potential underlying mechanisms by which prediabetes may lead to earlier dementia onset in women.

Keywords: Alzheimer’s disease; Cerebral hypoperfusion; Dementia; Diabetes; Glucose intolerance; High-fat diet; Inflammation; Metabolic; Obesity; Sex; Vascular.


Conflict of interest statement

The authors declare that they have no conflicts of interest.

Figures

Fig. 1
Fig. 1
HF diet caused greater metabolic impairment in AD and MxD females compared to males. A Experimental timeline. GTT (glucose tolerance test). B Weight gain was assessed by the % change in body weight from the start of the study to the end of the study. C Visceral adiposity was determined by isolating and weighing the visceral fat pads and normalizing to body weight. D, E Glucose intolerance was assessed with a GTT following a 16 h fast. D Glucose clearance was gauged by concentrations of glucose in the blood measured over time (time 0 = fasting blood glucose). E Blood glucose concentration over time was used to calculate area under the curve. We previously reported metabolic data for the Sham WT and Sham AD, but not the MxD, groups in Robison et al. (2020) in the Journal of Neuroinflammation [29]; licensed under a Creative Commons Attribution 4.0 International License; (https://creativecommons.org/licenses/by/4.0/). Data are presented as mean + SEM, **p < 0.01 effect of diet, ****p < 0.0001 effect of diet, ^p < 0.05 effect of dementia, ^^^p < 0.001 effect of dementia, ^^^^p < 0.0001 effect of dementia, 2-way ANOVA, (n = 13–25/group)
Fig. 2
Fig. 2
HF diet caused a wider array of cognitive impairment in females compared to males. A Episodic-like memory was assessed in the novel object recognition test (NORT). Recognition index (% time spent with the novel object) was calculated. Performance not significantly greater than chance (50%, indicated by the red line) indicates impaired memory. BD Spatial learning and memory was assessed using the Morris Water Maze (MWM). Five hidden trials (B) assessed spatial learning via pathlength to reach the target platform (shorter pathlength = better performance). Average pathlength over the 5 hidden trials (C) was longer (more impaired memory) in MxD females and AD females on a HF diet. Spatial memory was assessed in the probe trial (D), as % time spent in the target quadrant vs. chance (25%, indicated by the red line). Performance above 25% indicates intact memory. E The nest building task was used to assess activities of daily living. Nests were graded on 1–5 scale (average of scores by 3 experimenters blinded to treatment). Lower scores are indicative of impairment. Data are presented as mean + SEM except for nest building (median + interquartile range), +++p < 0.001 vs chance, +p < 0.05 vs. chance, **p < 0.01 effect of diet, ^p < 0.05 effect of dementia, ^^p < 0.01 effect of dementia, ^^^^p < 0.0001 effect of dementia, Red line = chance, 2-way ANOVA, (n = 5–11/group NOR, n = 8–13/group MWM, nest building)
Fig. 3
Fig. 3
Astrogliosis is exacerbated in AD/MxD females, while microglia coverage is decreased in AD/MxD males. A Hippocampal regions of interest examined: CA1, CA2, CA3, and the dentate gyrus (image created with BioRender.com). B Microgliosis in the CA1 region of the hippocampus was gauged through Iba1 immunofluorescence (greater % area covered indicating greater microgliosis). C Astrogliosis was gauged through GFAP immunofluorescence (greater % area covered indicating greater astrogliosis). D Representative images of Iba-1 immunofluorescence in the CA1 regions. E Representative images of GFAP immunofluorescence in the CA1 regions. FH Hippocampal expression of markers for microgliosis (Iba-1: F and CD68: G) and astrogliosis (GFAP: H) normalized to RPL13A expression. Data are presented as mean + SEM, effect of dementia: ^p < 0.05 effect of dementia, ^^^^p < 0.0001 effect of dementia, effect, *p < 0.05 effect of diet, 2-way ANOVA, (n = 4–5/group)
Fig. 4
Fig. 4
Female AD/MxD mice have greater Aβ, but not tau, pathology. A Representative image of Aβ plaques. B The number of Aβ plaques/brain section (averaged across 8, 40-μM-thick brain sections between -1.46 and -3.52 mm from bregma). C Hippocampal insoluble Aβ-40, measured by ELISA. D Hippocampal insoluble Aβ-42, measured by ELISA. E Representative Western blot images of tau protein in right (ischemic for MxD) hippocampal isolates. Measurements for F total tau, G pTau S199, and H pTauPHF1 were normalized to GAPDH. Data are presented as mean + SEM, #p < 0.05 effect of sex, ##p < 0.01 effect of sex, 3-way ANOVA, (n = 4–5/group)
Fig. 5
Fig. 5
Cognitive impairments and pathological outcomes are correlated with metabolic deficits in male and female mice. Using a correlation matrix, we compared relationships between cognitive, metabolic, and pathological factors. A, B Correlations between cognitive and metabolic measures. Visc fat: visceral fat pad weight normalized to body weight (n = 55–58/sex); AUC: area under the curve from the glucose tolerance test, high AUC indicates greater glucose intolerance (n = 54–58/sex); %decrease in blood flow: the percent difference in cerebral blood flow in the temporal region of the cortical brain surface (n = 50–51/sex); MWM % target: % of the time spent in the target quadrant of the probe trial of the MWM test, higher percentage indicates better spatial memory (n = 58/sex); NOR% time: % time spent with the novel object in the testing trial of the NOR test, higher percentage indicates better episodic-like memory (n = 46–49/sex); ADLs: activities of daily living assessed by score in the nest building test, a lower score indicates worse ADLs (n = 57–58/sex). C, D Correlations between metabolic and pathological measures in the subset of mice designated for IHC. AUC: area under the curve from the glucose tolerance test, high AUC indicates greater glucose intolerance (n = 18–21/sex); amyloid count: the number of cells in a cortical ROI that were positive for beta-amyloid (n = 19–20/sex); CA1 GFAP: the % area covered by GFAP staining in the CA1 region of the hippocampus, greater coverage indicates greater astrogliosis in that region (n = 18–19/sex); CA2 GFAP, (n = 17–19/sex); CA1 Iba2: the % area covered by Iba1 staining in the CA1 region of the hippocampus, greater coverage indicates greater astrogliosis (n = 17–18/sex) CA2 Iba1, (n = 18/sex). *p < 0.05, **p < 0.01, ***p < 0.001, ****p < 0.0001, significant correlation; Pearson r values are presented. Yellow: positive correlation, Blue: negative correlation. E, F Linear regression of CA1 Iba1% area covered and glucose tolerance test from the AUC (males: n = 19; females n = 17). r2 value and p value are presented
Fig. 6
Fig. 6
Summary of our major findings. We demonstrate relative accumulation of cognitive impairments and neuropathology of female male (left, blue) and (right, pink) mice along a center scale with the top of the scale indicating less impairment and pathology and the bottom of the scale representing greater impairment and pathology

References

    1. Janson J, Laedtke T, Parisi JE, O'Brien P, Petersen RC, Butler PC. Increased risk of type 2 diabetes in Alzheimer disease. Diabetes. 2004;53(2):474–481. doi: 10.2337/diabetes.53.2.474. - DOI - PubMed
    1. Zhang J, Chen C, Hua S, Liao H, Wang M, Xiong Y, et al. An updated meta-analysis of cohort studies: diabetes and risk of Alzheimer's disease. Diabetes Res Clin Pract. 2017;124:41–47. doi: 10.1016/j.diabres.2016.10.024. - DOI - PubMed
    1. Chatterjee S, Peters SA, Woodward M, MejiaArango S, Batty GD, Beckett N, et al. Type 2 diabetes as a risk factor for dementia in women compared with men: a pooled analysis of 23 million people comprising more than 100,000 cases of dementia. Diabetes Care. 2016;39(2):300–307. doi: 10.2337/dc15-1588. - DOI - PMC - PubMed
    1. Gottesman RF, Albert MS, Alonso A, Coker LH, Coresh J, Davis SM, et al. Associations between midlife vascular risk factors and 25-year incident dementia in the atherosclerosis risk in communities (ARIC) Cohort. JAMA Neurol. 2017;74(10):1246–1254. doi: 10.1001/jamaneurol.2017.1658. - DOI - PMC - PubMed
    1. Ng TP, Feng L, Nyunt MS, Feng L, Gao Q, Lim ML, et al. Metabolic syndrome and the risk of mild cognitive impairment and progression to dementia: follow-up of the singapore longitudinal ageing study cohort. JAMA Neurol. 2016;73(4):456–463. doi: 10.1001/jamaneurol.2015.4899. - DOI - PubMed

Substances