. 2022 Aug;235(4):1365-1378.
doi: 10.1111/nph.18222. Epub 2022 Jun 10.

Sunflecks in the upper canopy: dynamics of light-use efficiency in sun and shade leaves of Fagus sylvatica

Affiliations

Sunflecks in the upper canopy: dynamics of light-use efficiency in sun and shade leaves of Fagus sylvatica

Maxime Durand et al. New Phytol. 2022 Aug.

Abstract

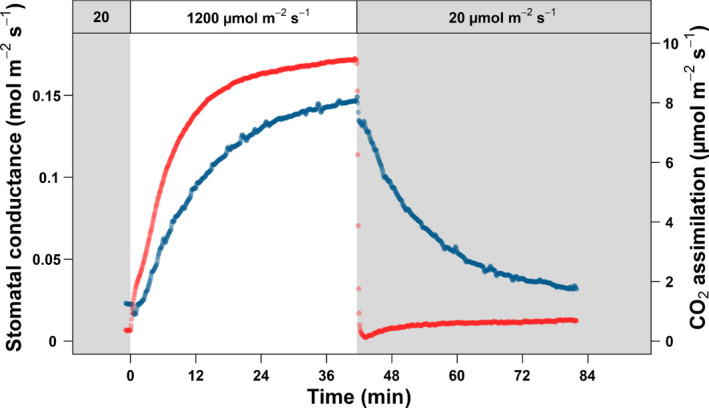
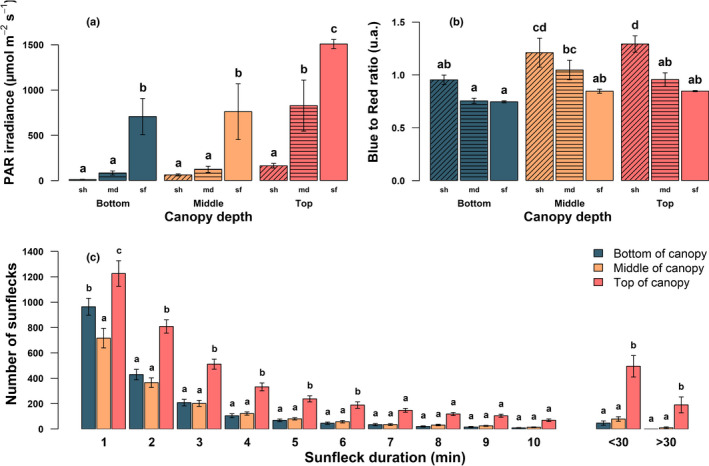
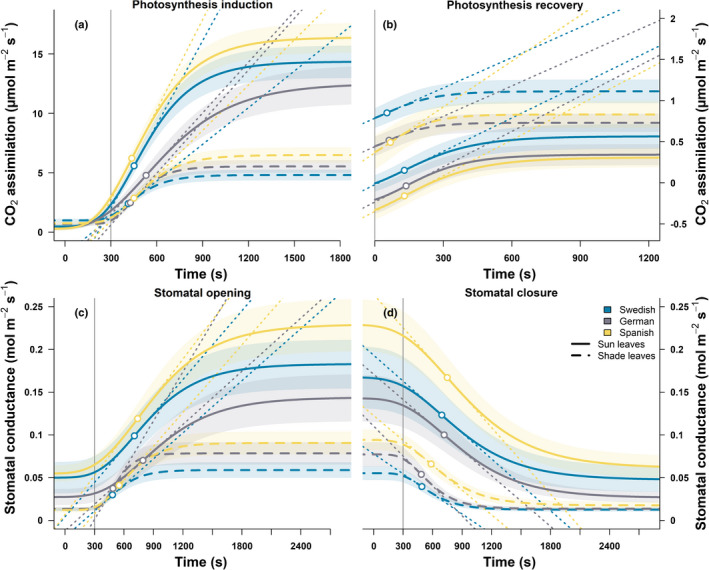
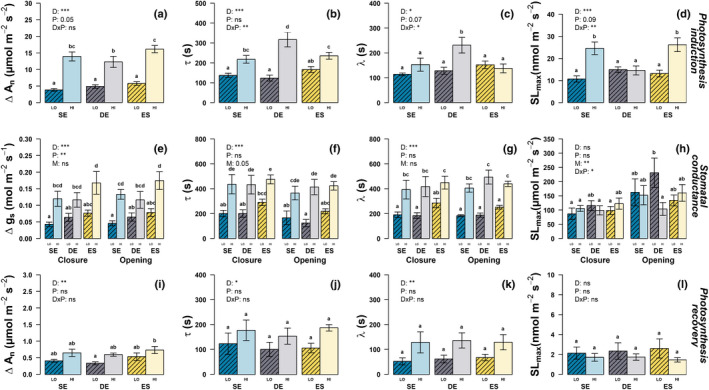
Sunflecks are transient patches of direct radiation that provide a substantial proportion of the daily irradiance to leaves in the lower canopy. In this position, faster photosynthetic induction would allow for higher sunfleck-use efficiency, as is commonly reported in the literature. Yet, when sunflecks are too few and far between, it may be more beneficial for shade leaves to prioritize efficient photosynthesis under shade. We investigated the temporal dynamics of photosynthetic induction, recovery under shade, and stomatal movement during a sunfleck, in sun and shade leaves of Fagus sylvatica from three provenances of contrasting origin. We found that shade leaves complete full induction in a shorter time than sun leaves, but that sun leaves respond faster than shade leaves due to their much larger amplitude of induction. The core-range provenance achieved faster stomatal opening in shade leaves, which may allow for better sunfleck-use efficiency in denser canopies and lower canopy positions. Our findings represent a paradigm shift for future research into light fluctuations in canopies, drawing attention to the ubiquitous importance of sunflecks for photosynthesis, not only in lower-canopy leaves where shade is prevalent, but particularly in the upper canopy where longer sunflecks are more common due to canopy openness.

Keywords: Fagus sylvatica; canopy vertical gradients; photosynthetic induction; provenance trial; stomatal dynamics; sun and shade leaves; sunfleck.


Figures

Fig. 1
Fig. 1
Example of a time course of light induction by a sunfleck. The example curve shown here was recorded on a sun leaf at the top of the canopy, from the Fagus sylvatica Swedish provenance. The CO2 assimilation and stomatal conductance are shown in red and blue, respectively. The grey and white area represent periods of low (20 μmol m−2 s−1) and high (1200 μmol m−2 s−1) irradiance, respectively.
Fig. 2
Fig. 2
Properties of the light environment in a 12‐yr‐old Fagus sylvatica provenance trial in Helsinki, Finland. (a, b) Photosynthetically‐active radiation (PAR) irradiance and blue (420–490 nm) to red (620–680 nm) ratio at the bottom (teal), middle (yellow) and top (pink) of the canopy. Measurements were performed once between 11 and 21 June 2021. We recorded four sets of 500 spectrometer recordings at four locations in the plot (i.e. 8000 in total), and extracted for each location the recording representing the 5%, 50%, and 95% quantile of the PAR irradiance distribution. These scans are respectively referred to in the figure as ‘shade’ (sh, diagonal hatching), ‘median’ (md, horizontal hatching), and ‘sunfleck’ (sf, no hatching). The four locations within the stand were used as replicates. Thus, ‘shade’ represents the average of four scans (one at each location) for which only 100 scans (5% of the 2000 scans recorded) had a lower PAR irradiance. (c) Density distribution of sunfleck duration measured with Gap Light Analyzer using hemispherical photographs. Each day of the growing season (between 1 May and 30 November 2021) was used for the analysis. Values are means ± 1 standard deviation. Different letters represent statistically significant differences between groups tested by post hoc pairwise comparisons (P < 0.05). In (c), letters were applied separately for each class of sunfleck duration.
Fig. 3
Fig. 3
Fitted sigmoidal curves used to derive the parameters τ, λ, SLmax of photosynthesis induction (a), recovery (b), stomatal opening (c) and closure (d) for leaves at the bottom (dashed lines) and top (continuous lines) of the canopy, in three provenances of Fagus sylvatica trees (Sweden in blue, Germany in grey, Spain in yellow) grown in Helsinki. The average sigmoidal response is drawn in bold with the coloured areas showing the standard error around the mean. The open points indicate the timepoint when the rate of change is at its maximum, with the dotted lines representing the maximum speed (SLmax). The vertical grey line shows when the change in illumination happened.
Fig. 4
Fig. 4
Dynamic parameters of the photosynthesis induction (a–d), stomatal conductance (e–h), and photosynthesis recovery (i–l) for leaves at the canopy top (HI, light, unshaded) and bottom (LO, dark, shaded), in three provenances of Fagus sylvatica trees (SE: Sweden in blue, DE: Germany in grey, ES: Spain in yellow) grown in Helsinki. Δ, amplitude, τ, time constant; λ, lag time; SLmax, maximum slope of the sigmoidal response. Values are means ± standard error. Letters represent statistically significant differences between groups tested by post hoc pairwise comparisons (P < 0.05). Results of two‐way ANOVA are given for main effects (D, canopy depth; P, provenance, M, stomatal opening and closing) and interaction (D × P). *, P < 0.05; **, P < 0.01; ***, P < 0.001; ns, not significant.
Fig. 5
Fig. 5
Two‐dimensional representation of simulation results showing the sets of sunfleck properties (amplitude, duration and frequency) resulting in the same time‐integrated CO2 assimilation between leaves from the top and bottom of the canopy for a sunfleck–shade cycle (as in Fig. 1), in Fagus sylvatica trees of Swedish provenance, grown in Helsinki. Colour gradients show series of increasing (a) sunfleck amplitude, (b) sunfleck duration, and (c) sunfleck frequency from light to dark brown.

Similar articles

Cited by

References

    1. Acevedo‐Siaca LG, Coe R, Wang Y, Kromdijk J, Quick WP, Long SP. 2020. Variation in photosynthetic induction between rice accessions and its potential for improving productivity. New Phytologist 227: 1097–1108. - PMC - PubMed
    1. Acevedo‐Siaca LG, Dionora J, Laza R, Paul Quick W, Long SP. 2021. Dynamics of photosynthetic induction and relaxation within the canopy of rice and two wild relatives. Food and Energy Security 10: e286. - PMC - PubMed
    1. Allen JF, Bennett J, Steinback KE, Arntzen CJ. 1981. Chloroplast protein phosphorylation couples plastoquinone redox state to distribution of excitation energy between photosystems. Nature 291: 25–29.
    1. Allen MT, Pearcy RW. 2000. Stomatal versus biochemical limitations to dynamic photosynthetic performance in four tropical rainforest shrub species. Oecologia 122: 479–486. - PubMed
    1. Aphalo PJ, Ylianttila L 2021. R package: ooacquire v.0.2.3.9005: acquire data from OO spectrometers . [WWW document] URL https://docs.r4photobiology.info/ooacquire/, https://github.com/aphalo/ooacquire [accessed 1 June 2022].

LinkOut - more resources