

Early Biomarker Signatures in Surgical Sepsis
- PMID: 35569215
- PMCID: PMC9827429
- DOI: 10.1016/j.jss.2022.04.052
Early Biomarker Signatures in Surgical Sepsis
Abstract
Introduction: Sepsis has complex, time-sensitive pathophysiology and important phenotypic subgroups. The objective of this study was to use machine learning analyses of blood and urine biomarker profiles to elucidate the pathophysiologic signatures of subgroups of surgical sepsis patients.
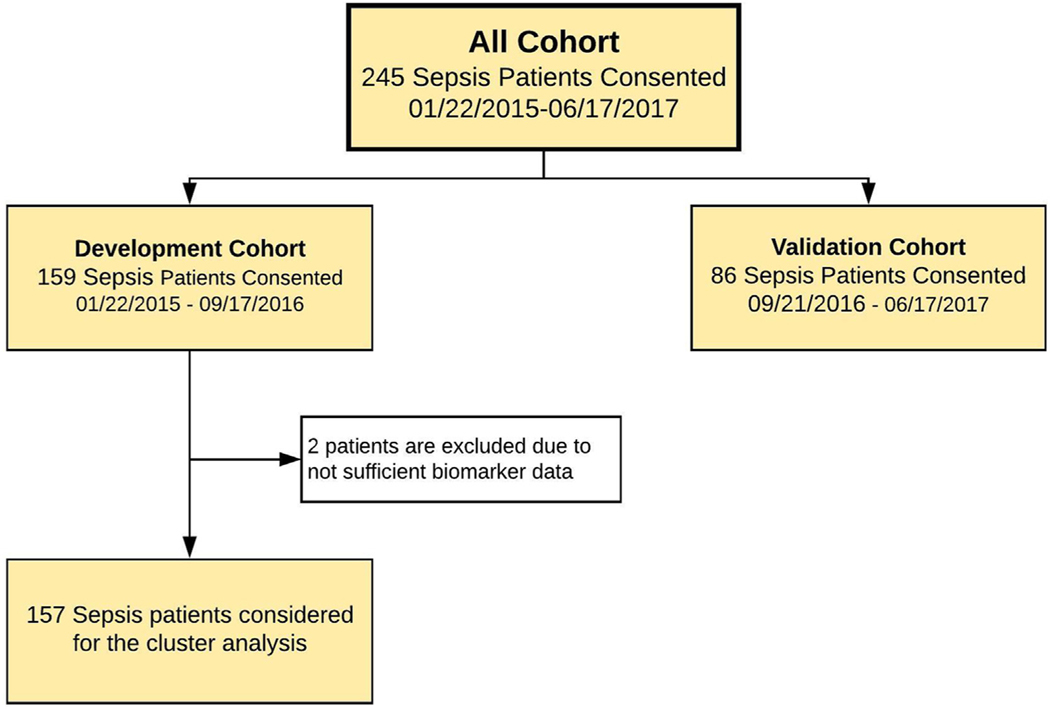
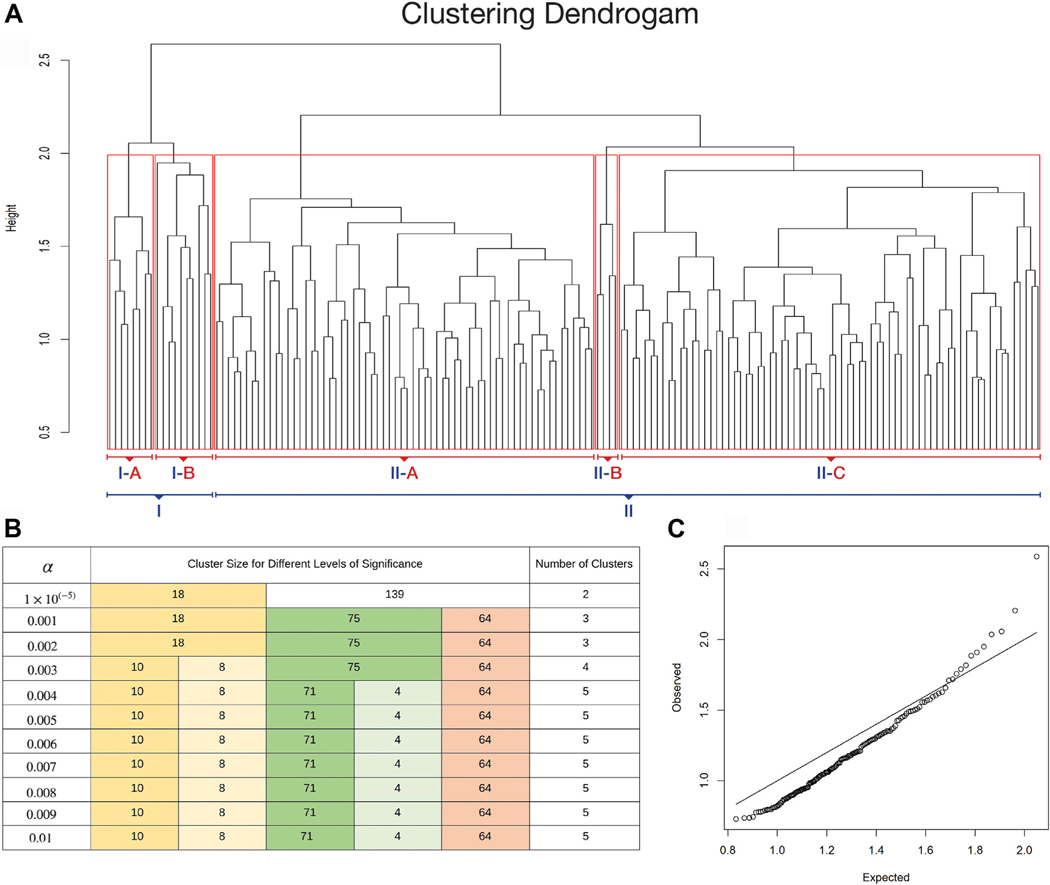
Methods: This prospective cohort study included 243 surgical sepsis patients admitted to a quaternary care center between January 2015 and June 2017. We applied hierarchical clustering to clinical variables and 42 blood and urine biomarkers to identify phenotypic subgroups in a development cohort. Clinical characteristics and short-term and long-term outcomes were compared between clusters. A naïve Bayes classifier predicted cluster labels in a validation cohort.
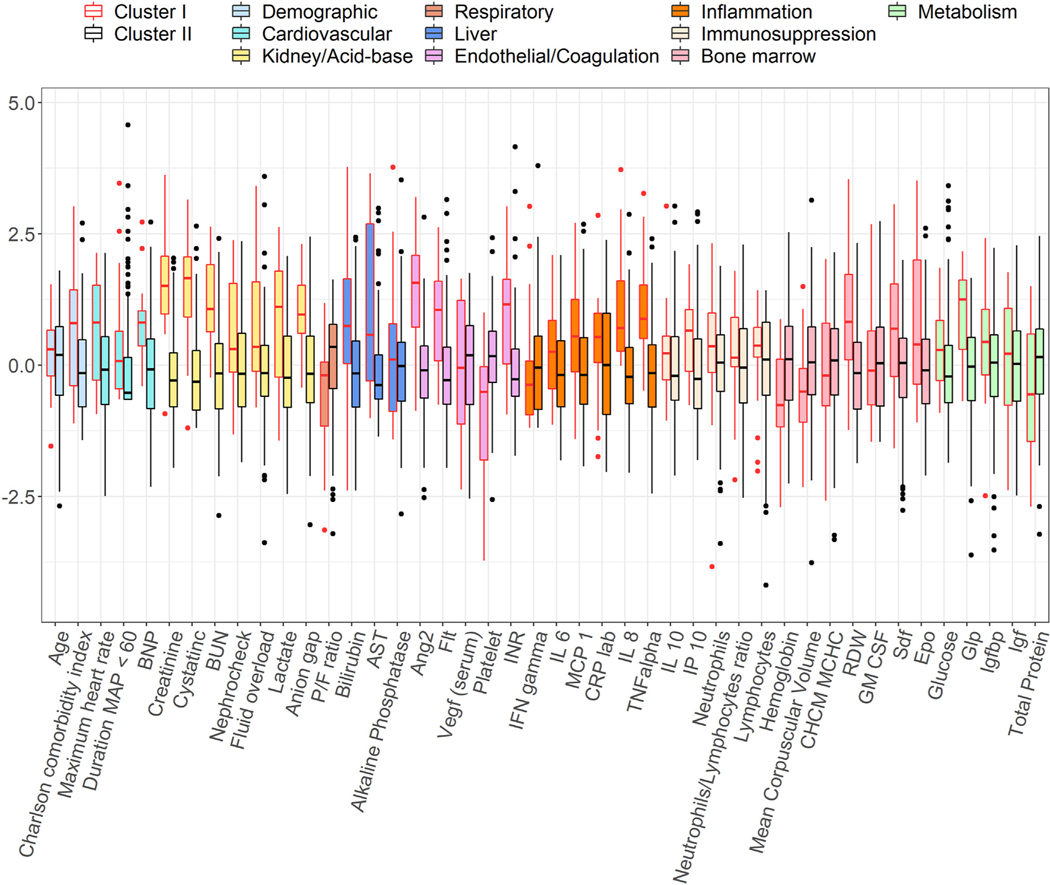
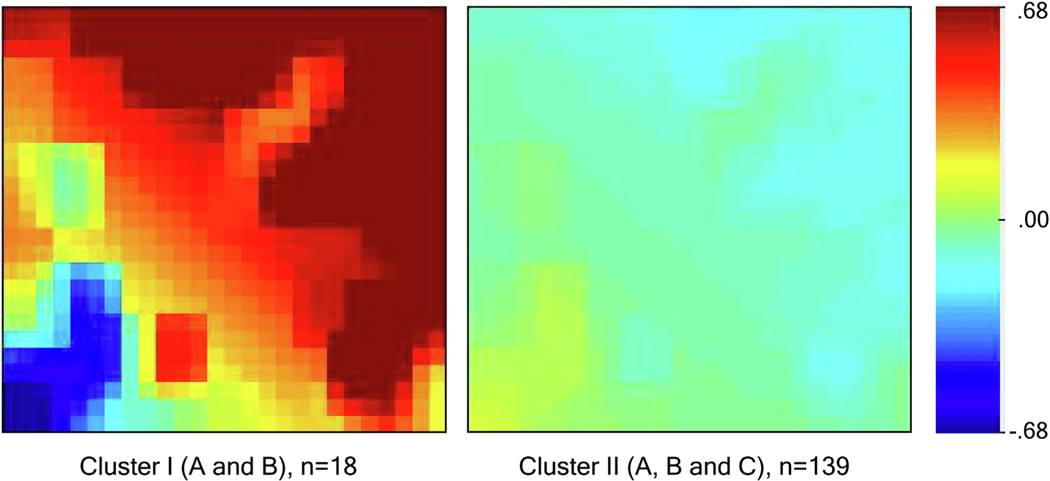
Results: The development cohort contained one cluster characterized by early organ dysfunction (cluster I, n = 18) and one cluster characterized by recovery (cluster II, n = 139). Cluster I was associated with higher Acute Physiologic Assessment and Chronic Health Evaluation II (30 versus 16, P < 0.001) and SOFA scores (13 versus 5, P < 0.001), greater prevalence of chronic cardiovascular and renal disease (P < 0.001) and septic shock (78% versus 17%, P < 0.001). Cluster I had higher mortality within 14 d of sepsis onset (11% versus 1.5%, P = 0.001) and within 1 y (44% versus 20%, P = 0.032), and higher incidence of chronic critical illness (61% versus 30%, P = 0.001). The Bayes classifier achieved 95% accuracy and identified two clusters that were similar to development cohort clusters.
Conclusions: Machine learning analyses of clinical and biomarker variables identified an early organ dysfunction sepsis phenotype characterized by inflammation, renal dysfunction, endotheliopathy, and immunosuppression, as well as poor short-term and long-term clinical outcomes.
Keywords: Biomarker; Clustering; Machine learning; Phenotyping; Sepsis; Unsupervised learning.
Published by Elsevier Inc.
Figures
Similar articles
-
A hypolipoprotein sepsis phenotype indicates reduced lipoprotein antioxidant capacity, increased endothelial dysfunction and organ failure, and worse clinical outcomes.Crit Care. 2021 Sep 17;25(1):341. doi: 10.1186/s13054-021-03757-5. Crit Care. 2021. PMID: 34535154 Free PMC article.
-
The impact of age on the innate immune response and outcomes after severe sepsis/septic shock in trauma and surgical intensive care unit patients.J Trauma Acute Care Surg. 2018 Aug;85(2):247-255. doi: 10.1097/TA.0000000000001921. J Trauma Acute Care Surg. 2018. PMID: 29613958 Free PMC article.
-
Derivation, Validation, and Potential Treatment Implications of Novel Clinical Phenotypes for Sepsis.JAMA. 2019 May 28;321(20):2003-2017. doi: 10.1001/jama.2019.5791. JAMA. 2019. PMID: 31104070 Free PMC article.
-
Methods for Phenotyping Adult Patients in Sepsis and Septic Shock: A Scoping Review.Crit Care Explor. 2022 Mar 30;4(4):e0672. doi: 10.1097/CCE.0000000000000672. eCollection 2022 Apr. Crit Care Explor. 2022. PMID: 35372844 Free PMC article.
-
Refining empiric subgroups of pediatric sepsis using machine-learning techniques on observational data.Front Pediatr. 2023 Jan 30;11:1035576. doi: 10.3389/fped.2023.1035576. eCollection 2023. Front Pediatr. 2023. PMID: 36793336 Free PMC article. Review.
Cited by
-
The Value of Neutrophil/Lymphocyte Ratio Combined with Red Blood Cell Distribution Width in Evaluating the Prognosis of Emergency Patients with Sepsis.Emerg Med Int. 2022 Nov 10;2022:1673572. doi: 10.1155/2022/1673572. eCollection 2022. Emerg Med Int. 2022. PMID: 36406930 Free PMC article.
-
Sepsis-associated acute kidney injury: recent advances in enrichment strategies, sub-phenotyping and clinical trials.Crit Care. 2024 Mar 21;28(1):92. doi: 10.1186/s13054-024-04877-4. Crit Care. 2024. PMID: 38515121 Free PMC article. Review.
-
Identifying acute illness phenotypes via deep temporal interpolation and clustering network on physiologic signatures.Sci Rep. 2024 Apr 10;14(1):8442. doi: 10.1038/s41598-024-59047-x. Sci Rep. 2024. PMID: 38600110 Free PMC article.
-
An early sepsis prediction model utilizing machine learning and unbalanced data processing in a clinical context.Prev Med Rep. 2024 Aug 2;45:102841. doi: 10.1016/j.pmedr.2024.102841. eCollection 2024 Sep. Prev Med Rep. 2024. PMID: 39188971 Free PMC article.
-
Biological Phenotyping in Sepsis and Acute Respiratory Distress Syndrome.Annu Rev Med. 2023 Jan 27;74:457-471. doi: 10.1146/annurev-med-043021-014005. Epub 2022 Dec 5. Annu Rev Med. 2023. PMID: 36469902 Free PMC article. Review.
References
-
- Angus DC, Linde-Zwirble WT, Lidicker J, Clermont G, Carcillo J, Pinsky MR. Epidemiology of severe sepsis in the United States: analysis of incidence, outcome, and associated costs of care. Crit Care Med. 2001;29:1303–1310. - PubMed
-
- Torio CM, Andrews RM. National inpatient hospital costs: the most expensive conditions by payer, 2011: Statistical Brief #160. In: Healthcare Cost and Utilization Project (HCUP) Statistical Briefs. Rockville, MD: Agency for Healthcare Research and Quality (US); 2013. - PubMed
-
- Kumar A, Roberts D, Wood KE, et al. Duration of hypotension before initiation of effective antimicrobial therapy is the critical determinant of survival in human septic shock. Crit Care Med. 2006;34:1589–1596. - PubMed
Publication types
MeSH terms
Substances
Grants and funding
LinkOut - more resources
Full Text Sources
Medical
