

Single-cell assessment of the modulation of macrophage activation by ex vivo intervertebral discs using impedance cytometry
- PMID: 35569268
- PMCID: PMC9623412
- DOI: 10.1016/j.bios.2022.114346
Single-cell assessment of the modulation of macrophage activation by ex vivo intervertebral discs using impedance cytometry
Abstract
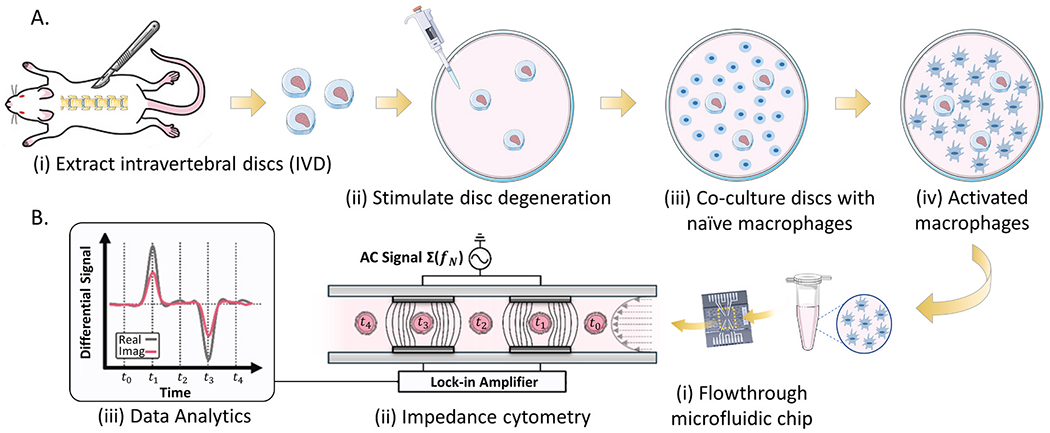
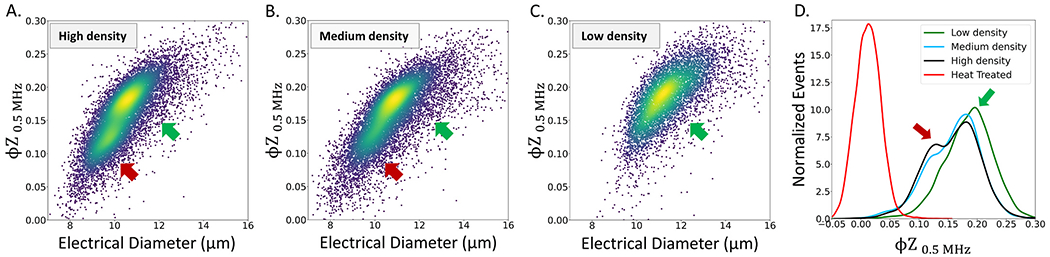
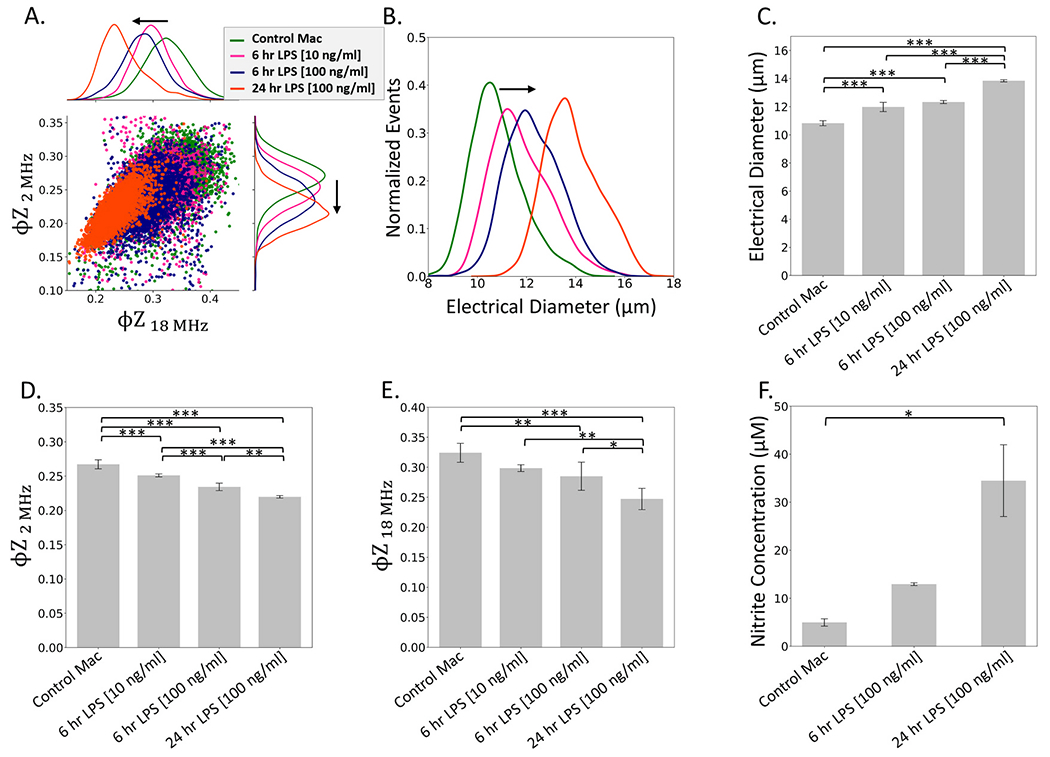
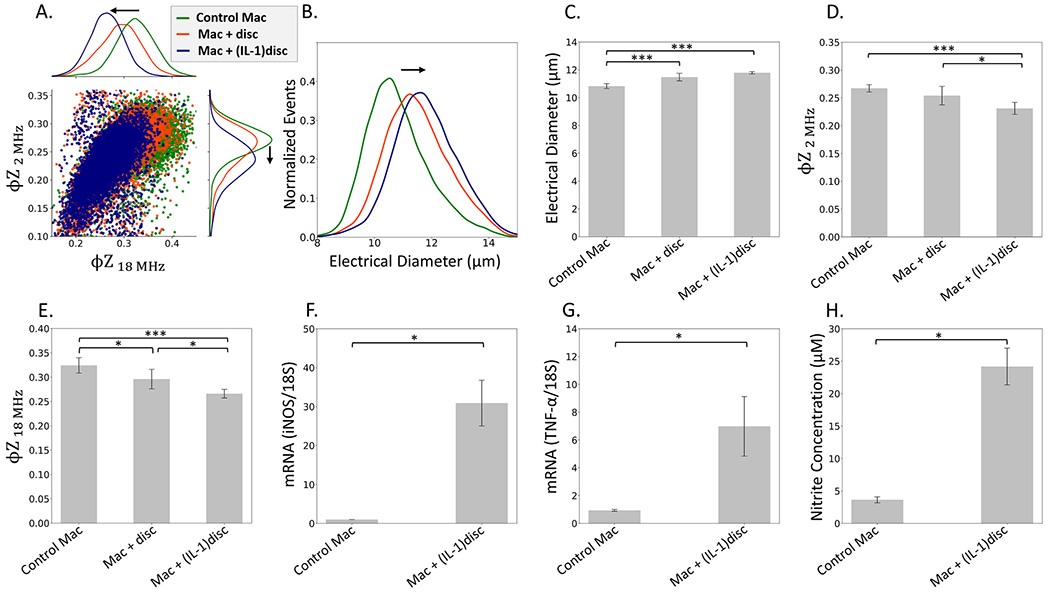
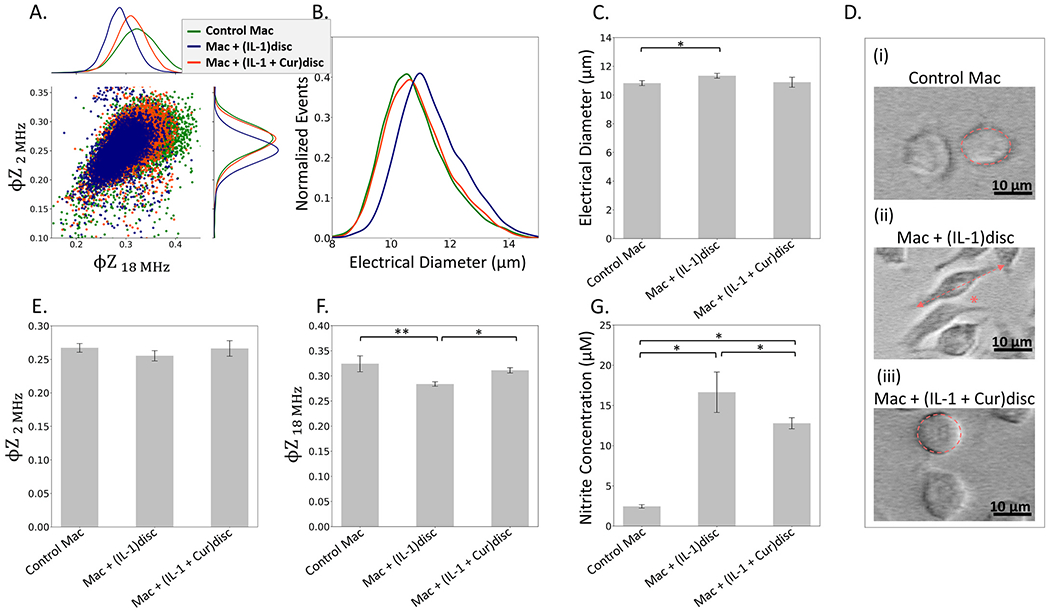
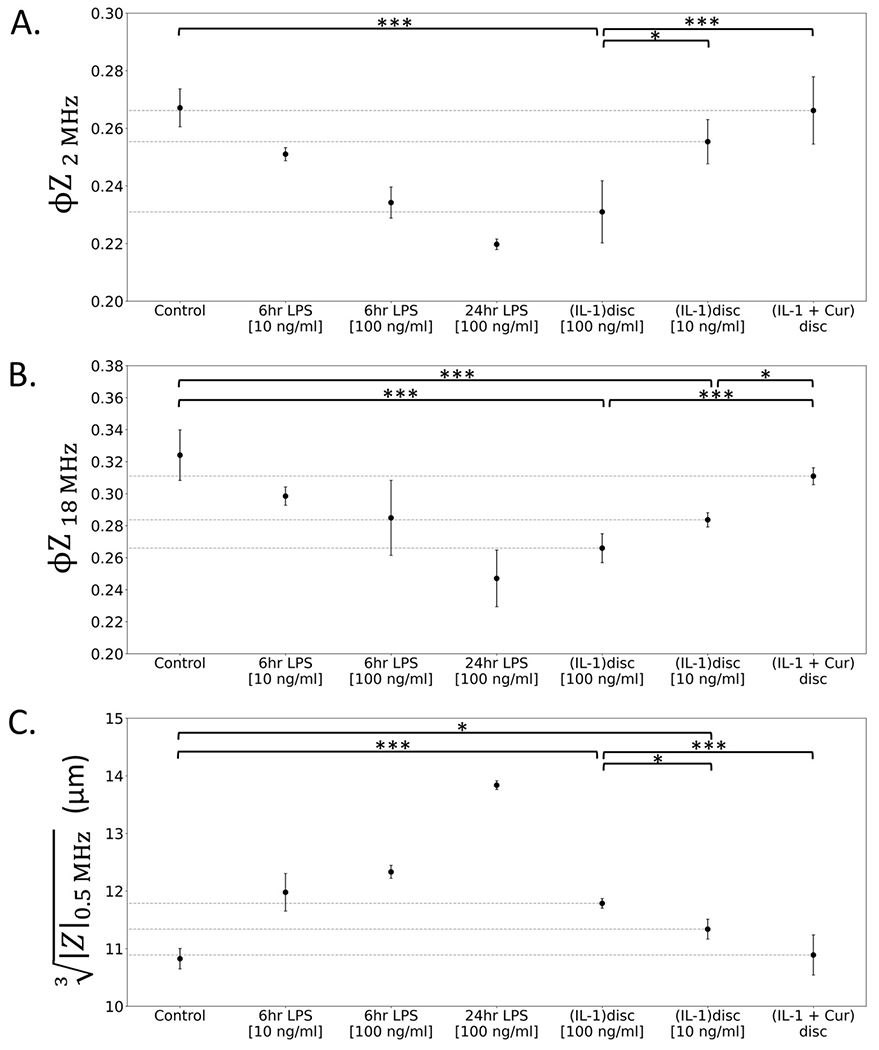
Measurement of macrophage activation and its modulation for immune regulation is of great interest to arrest inflammatory responses associated with degeneration of intervertebral discs that cause chronic back pain, and with transplants that face immune rejection. Due to the phenotypic plasticity of macrophages that serve multiple immune functions, the net disease outcome is determined by a balance of subpopulations with competing functions, highlighting the need for single-cell methods to quantify heterogeneity in their activation phenotypes. However, since macrophage activation can follow several signaling pathways, cytometry after fluorescent staining of markers with antibodies does not often provide dose-dependent information on activation dynamics. We present high throughput single-cell impedance cytometry for multiparametric measurement of biophysical changes to individual macrophages for quantifying activation in a dose and duration dependent manner, without relying on a particular signaling pathway. Impedance phase metrics measured at two frequencies and the electrical diameter from impedance magnitude at lower frequencies are used in tandem to benchmark macrophage activation by degenerated discs against that from lipopolysaccharide stimulation at varying dose and duration levels, so that reversal of the activation state by curcumin can be ascertained. This label-free single-cell measurement method can form the basis for platforms to screen therapies for inflammation, thereby addressing the chronic problem of back pain.
Keywords: Cytometry; Impedance; Inflammation; Intervertebral disc; Macrophages; Microfluidics.
Copyright © 2022 Elsevier B.V. All rights reserved.
Conflict of interest statement
Declaration of competing interest
The authors declare that they have no known competing financial interests or personal relationships that could have appeared to influence the work reported in this paper.
Figures
Similar articles
-
Accumulation and localization of macrophage phenotypes with human intervertebral disc degeneration.Spine J. 2018 Feb;18(2):343-356. doi: 10.1016/j.spinee.2017.09.018. Epub 2017 Oct 12. Spine J. 2018. PMID: 29031872 Free PMC article.
-
Capability of nondegenerated and degenerated discs in producing inflammatory agents with or without macrophage interaction.Spine (Phila Pa 1976). 2012 Feb 1;37(3):161-7. doi: 10.1097/BRS.0b013e31821a874b. Spine (Phila Pa 1976). 2012. PMID: 21494199
-
Macrophages and Intervertebral Disc Degeneration.Int J Mol Sci. 2023 Jan 10;24(2):1367. doi: 10.3390/ijms24021367. Int J Mol Sci. 2023. PMID: 36674887 Free PMC article. Review.
-
Inflammaging determines health and disease in lumbar discs-evidence from differing proteomic signatures of healthy, aging, and degenerating discs.Spine J. 2020 Jan;20(1):48-59. doi: 10.1016/j.spinee.2019.04.023. Epub 2019 May 22. Spine J. 2020. PMID: 31125691
-
Role of the Wnt pathway in the formation, development, and degeneration of intervertebral discs.Pathol Res Pract. 2021 Apr;220:153366. doi: 10.1016/j.prp.2021.153366. Epub 2021 Feb 8. Pathol Res Pract. 2021. PMID: 33647863 Review.
Cited by
-
Droplet Detection and Sorting System in Microfluidics: A Review.Micromachines (Basel). 2022 Dec 30;14(1):103. doi: 10.3390/mi14010103. Micromachines (Basel). 2022. PMID: 36677164 Free PMC article. Review.
-
Microfluidic-Based Electrical Operation and Measurement Methods in Single-Cell Analysis.Sensors (Basel). 2024 Sep 30;24(19):6359. doi: 10.3390/s24196359. Sensors (Basel). 2024. PMID: 39409403 Free PMC article. Review.
-
Multichannel impedance cytometry downstream of cell separation by deterministic lateral displacement to quantify macrophage enrichment in heterogeneous samples.Adv Mater Technol. 2023 Apr 24;8(8):2201463. doi: 10.1002/admt.202201463. Epub 2023 Jan 29. Adv Mater Technol. 2023. PMID: 37706194 Free PMC article.
-
Neural Network-Enabled Multiparametric Impedance Signal Templating for High throughput Single-Cell Deformability Cytometry Under Viscoelastic Extensional Flows.Small. 2025 Feb;21(5):e2407212. doi: 10.1002/smll.202407212. Epub 2024 Oct 22. Small. 2025. PMID: 39439143 Free PMC article.
-
Supervised learning on impedance cytometry data for label-free biophysical distinction of pancreatic cancer cells versus their associated fibroblasts under gemcitabine treatment.Biosens Bioelectron. 2023 Jul 1;231:115262. doi: 10.1016/j.bios.2023.115262. Epub 2023 Mar 30. Biosens Bioelectron. 2023. PMID: 37058962 Free PMC article.
References
-
- Andersson GB, 1999. Epidemiological features of chronic low-back pain. Lancet 354 (9178), 581–585. - PubMed
-
- Burke JG, Watson RWG, McCormack D, Dowling FE, Walsh MG, Fitzpatrick JM, 2002. Spontaneous production of monocyte chemoattractant protein-1 and interleukin-8 by the human lumbar intervertebral disc. Spine 27 (13), 1402–1407. - PubMed
MeSH terms
Grants and funding
LinkOut - more resources
Full Text Sources
