. 2022;14(2):435-464.
doi: 10.1016/j.jcmgh.2022.05.003. Epub 2022 May 13.

Robust Colonic Epithelial Regeneration and Amelioration of Colitis via FZD-Specific Activation of Wnt Signaling

Affiliations

Robust Colonic Epithelial Regeneration and Amelioration of Colitis via FZD-Specific Activation of Wnt Signaling

Liqin Xie et al. Cell Mol Gastroenterol Hepatol. 2022.

Abstract

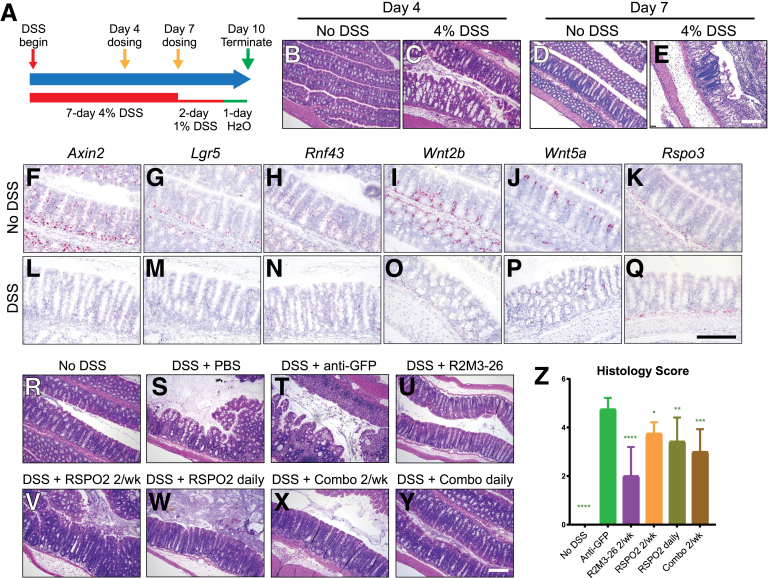
Background and aims: Current management of inflammatory bowel disease leaves a clear unmet need to treat the severe epithelial damage. Modulation of Wnt signaling might present an opportunity to achieve histological remission and mucosal healing when treating IBD. Exogenous R-spondin, which amplifies Wnt signals by maintaining cell surface expression of Frizzled (Fzd) and low-density lipoprotein receptor-related protein receptors, not only helps repair intestine epithelial damage, but also induces hyperplasia of normal epithelium. Wnt signaling may also be modulated with the recently developed Wnt mimetics, recombinant antibody-based molecules mimicking endogenous Wnts.

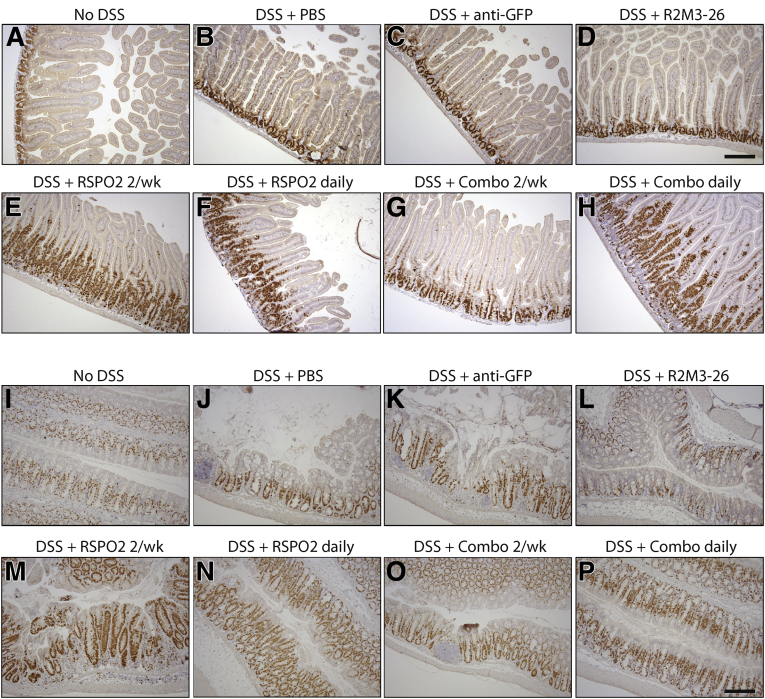
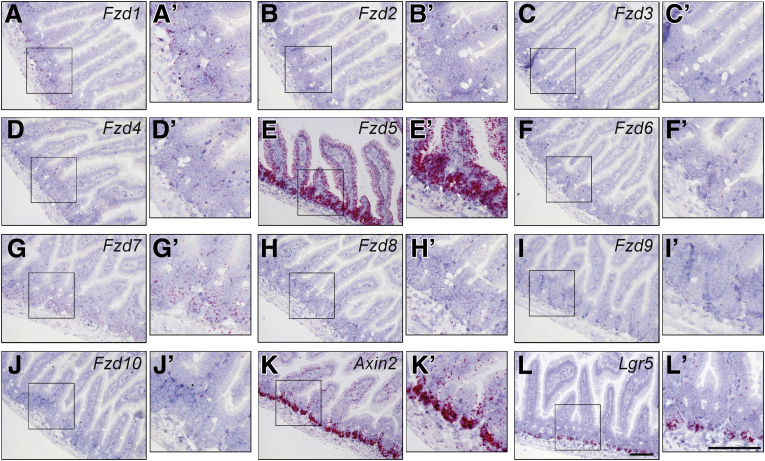
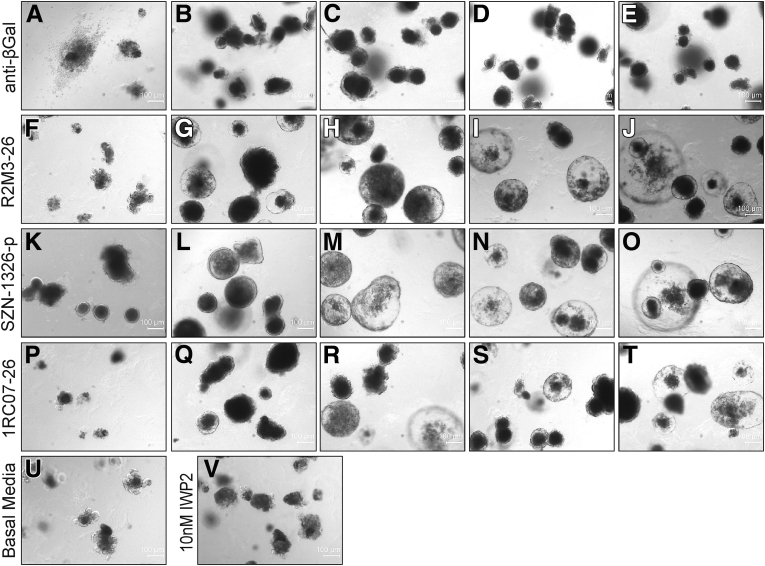
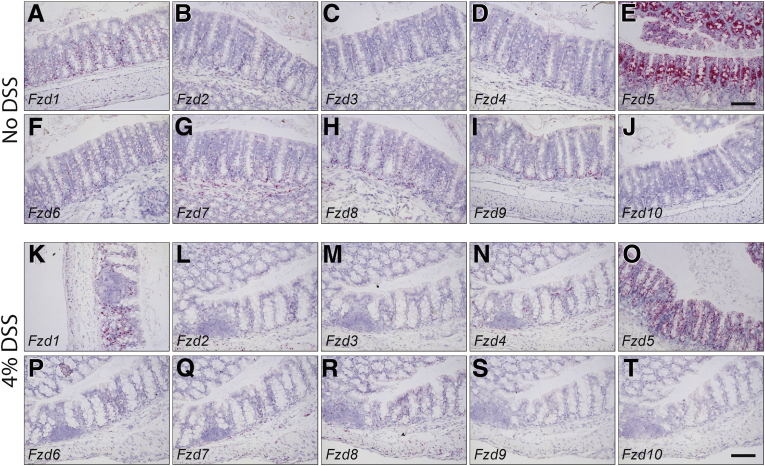
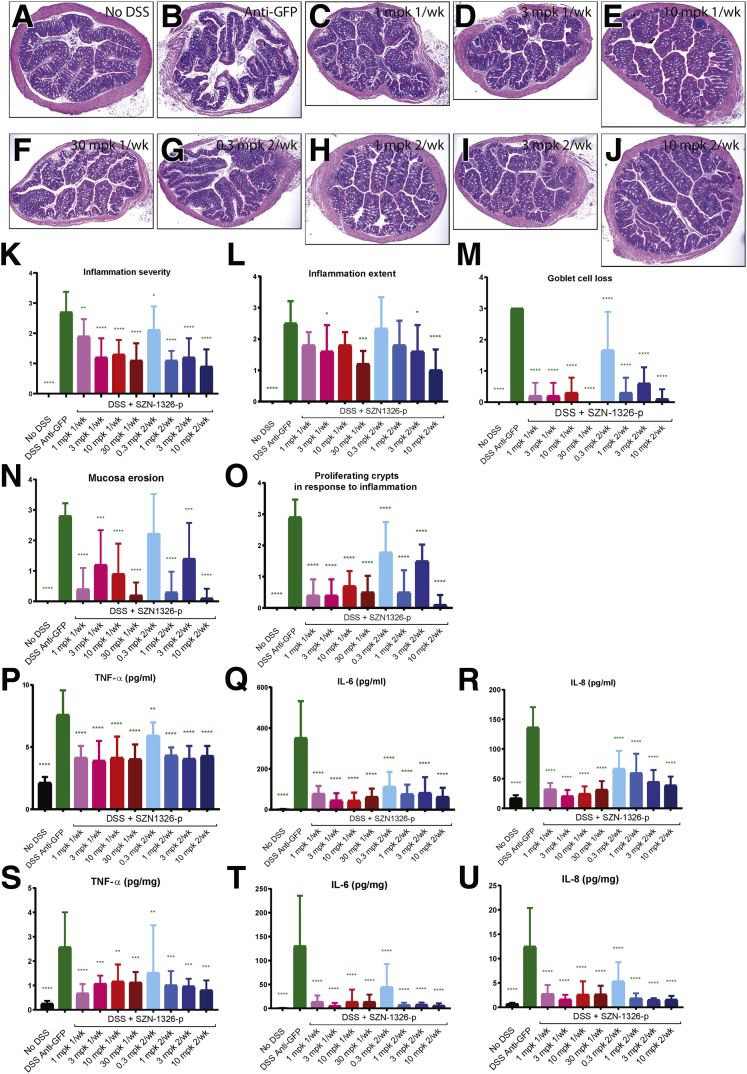
Methods: We first compared the epithelial healing effects of RSPO2 and a Wnt mimetic with broad Fzd specificity in an acute dextran sulfate sodium mouse colitis model. Guided by Fzd expression patterns in the colon epithelium, we also examined the effects of Wnt mimetics with subfamily Fzd specificities.

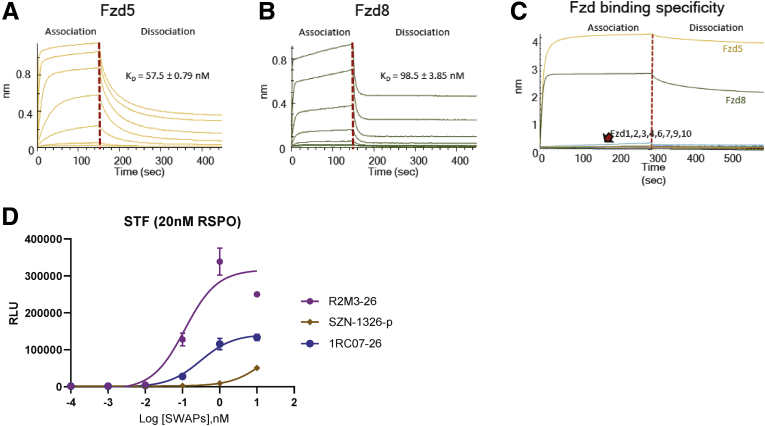
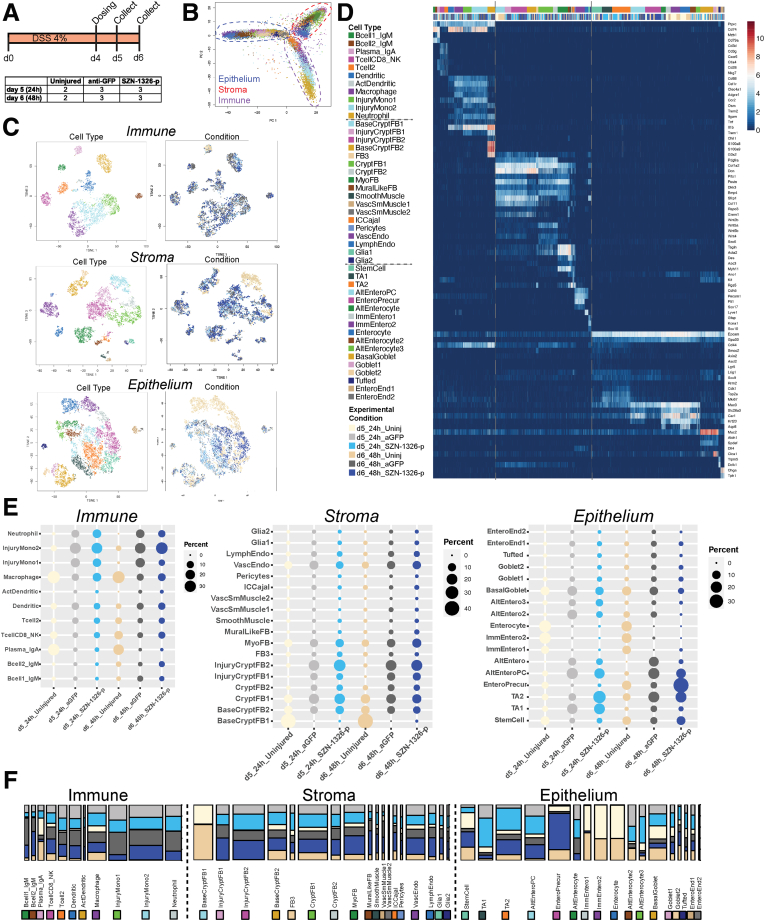
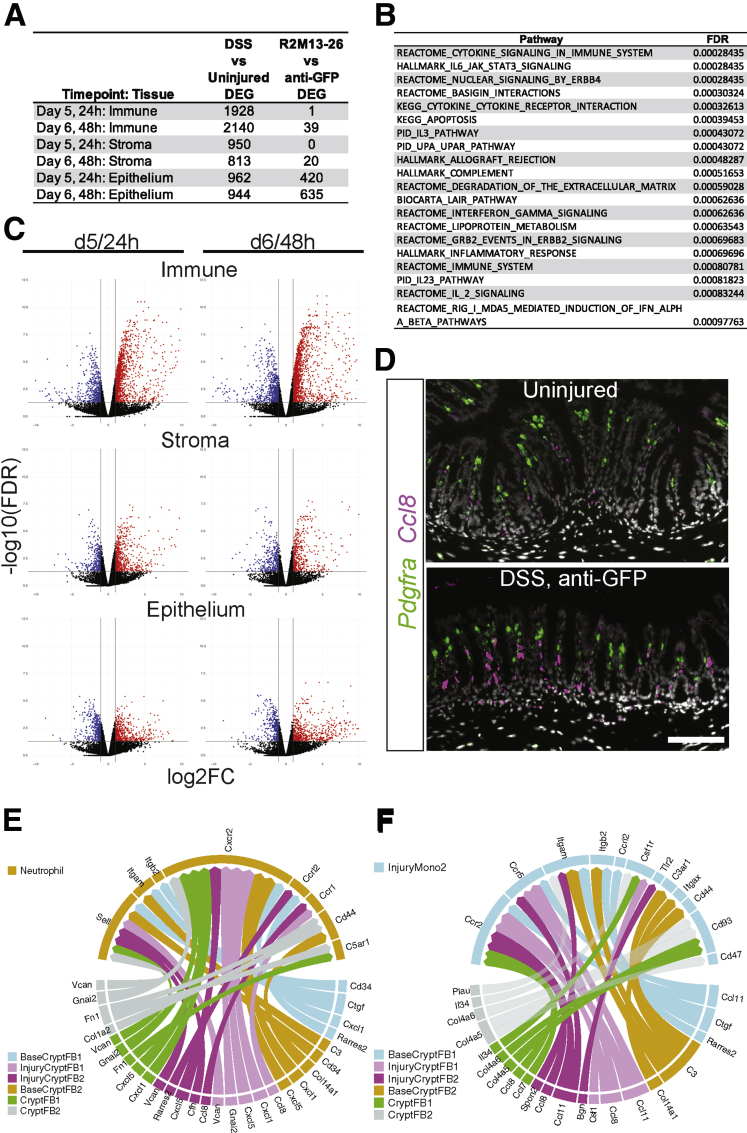
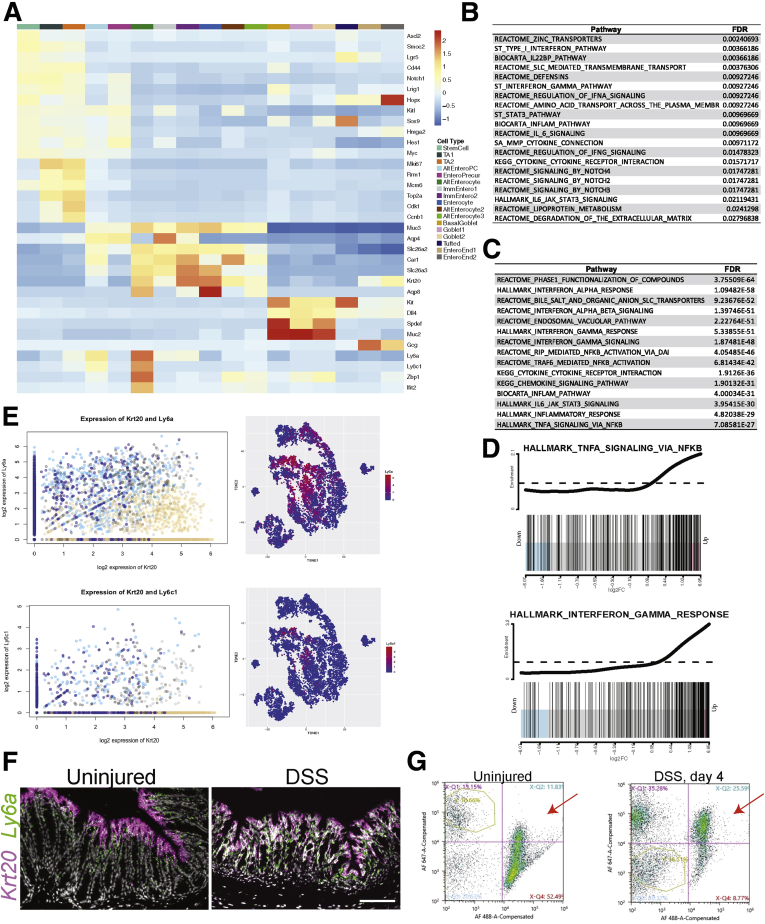
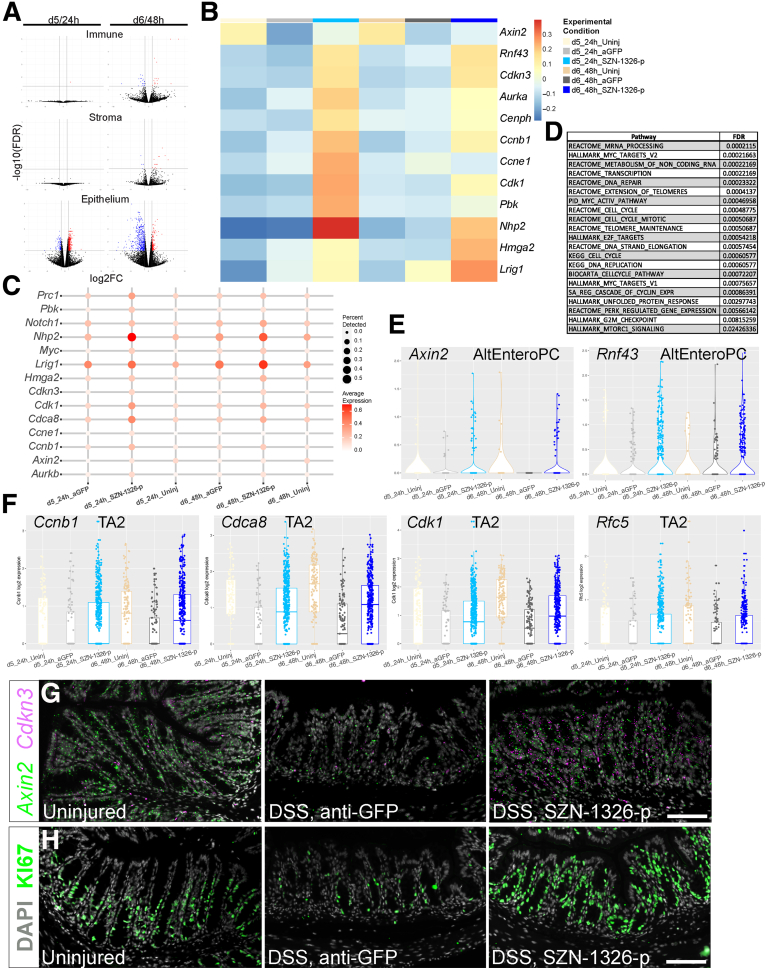
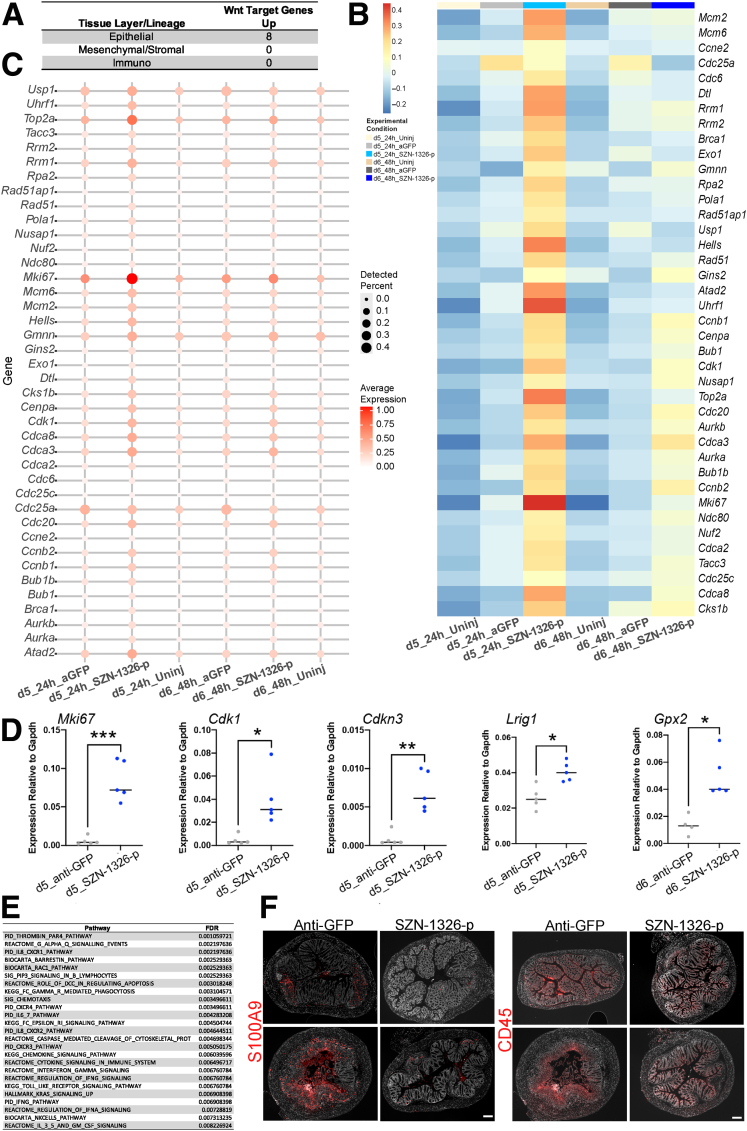
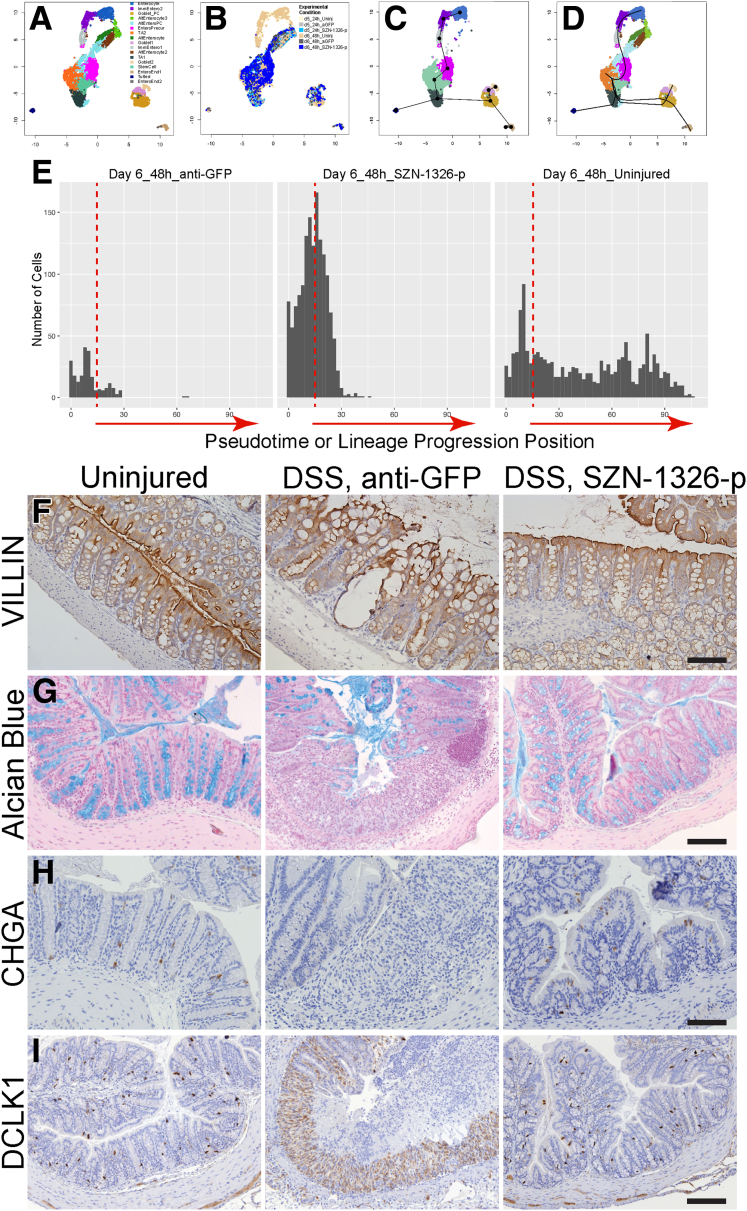
Results: In the DSS model, Wnt mimetics repaired damaged colon epithelium and reduced disease activity and inflammation and had no apparent effect on uninjured tissue. We further identified that the FZD5/8 and LRP6 receptor-specific Wnt mimetic, SZN-1326-p, was associated with the robust repair effect. Through a range of approaches including single-cell transcriptome analyses, we demonstrated that SZN-1326-p directly impacted epithelial cells, driving transient expansion of stem and progenitor cells, promoting differentiation of epithelial cells, histologically restoring the damaged epithelium, and secondarily to epithelial repair, reducing inflammation.

Conclusions: It is feasible to design Wnt mimetics such as SZN-1326-p that impact damaged intestine epithelium specifically and restore its physiological functions, an approach that holds promise for treating epithelial damage in inflammatory bowel disease.

Keywords: Epithelial Repair; Frizzled; IBD; Inflammatory Bowel Diseases; UC; Ulcerative Colitis; Wnt.


Figures

None
Graphical abstract
Figure 1
Figure 1
Wnt mimetics alone repaired the damaged colon epithelium in an acute DSS colitis model. (A) A diagram illustrating the acute DSS model used. DSS was included in drinking water at the indicated percentage. Wnt mimetics and RSPO were dosed twice on day 4 and day 7 (yellow arrows) or daily starting on day 4. Animals were terminated on day 10. (Animals were switched to plain drinking water on the last day for compliance with Institutional Animal Care and Use Committee protocol.) (BD) H&E stain of transverse colon sections of normal colon and the damaged colon on day 4 and day 7. (FQ) RNAscope in situ showing expression of Axin2, Lgr5, Rnf43, Wnt2b, Wnt5a, and Rspo3 in normal and DSS colon tissues. (RY) Representative H&E stain of transverse colon of the indicated treatment groups: (R) no DSS, (S) DSS with PBS, (T) with 2 treatments of 3 mg/kg anti-GFP, (U) with 2 treatments of 10 mg/kg R2M3-26, (V, W) with 2 or daily treatments of 3 mg/kg RSPO2, and (X, Y) with 2 or daily treatments of 1 mg/kg RSPO2 + 0.3 mg/kg R2M3-26 combo. (Z) Colon histology score of acute DSS conditions after the indicated treatments. Statistical analysis was performed as described in the Methods with all comparisons made to the anti-GFP group. Scale bars = 200 μm.
Figure 2
Figure 2
Wnt mimetics alone did not cause hyperproliferation in the damaged colon or in the small intestine. (A–H) Ki67 staining of duodenum sections of animals treated with (A) no DSS, (B) DSS with PBS injections, (C) DSS with 2 IP injections of 3 mg/kg anti-GFP, (D) DSS with 2 IP injections of 10 mg/kg R2M3-26, (E) DSS with 2 IP injections of 3 mg/kg RSPO2, (F) DSS with daily IP injections of 3 mg/kg RSPO2, (G) DSS with 2 IP injections of 1 mg/kg RSPO2 + 0.3 mg/kg R2M3-26 combo, and (H) DSS with daily IP injections of 1 mg/kg RSPO2 + 0.3 mg/kg R2M3-26 combo. (IP) Ki67 staining of transverse colon sections of animals treated with Ki67 staining of duodenum sections of animals treated with (I) no DSS, (J) DSS with PBS injections, (K) DSS with 2 IP injections of 3 mg/kg anti-GFP, (L) DSS with 2 IP injections of 10 mg/kg R2M3-26, (M) DSS with 2 IP injections of 3 mg/kg RSPO2, (N) DSS with daily IP injections of 3 mg/kg RSPO2, (O) DSS with 2 IP injections of 1 mg/kg RSPO2 + 0.3 mg/kg R2M3-26 combo, and (P) DSS with daily IP injections of 1 mg/kg RSPO2 + 0.3 mg/kg R2M3-26 combo. Scale bars = 100 μm.
Figure 3
Figure 3
The FZD family of receptors showed differential expression pattern in the small intestinal epithelium. (A–L) expression of each of the 10 Fzd receptors Fzd1–10, Axin2 and Lgr5 in the normal duodenum was examined by RNAscope in situ hybridization. (A’–L’) insets with zoom in view showing Fzd expression in the small intestinal crypts. Arrows in E’ indicate intestinal stem cells. Scale bars = 100 μm.
Figure 4
Figure 4
In vitro activity of Fzd5,8 subfamily–specific Wnt mimetic SZN-1326-p. (A) The binding affinity of the Fzd5,8 binder IgG of SZN-1326-p to its target Fzd5 CRD measured on Octet. equilibrium dissociation constant (KD) indicated on the graph. (B) The binding affinity of the Fzd5,8 binder IgG of SZN-1326-p to its target Fzd8 CRD measured on Octet. KD indicated on the graph. (C) The binding specificity of the Fzd5,8 binder IgG of SZN-1326-p to each of the 10 Fzd CRDs examined on Octet. (D) The dose-dependent STF activities of SZN-1326-p, of the Fzd1,2,7-specific mimetic 1RC07-26 and of the Fzd1,2,5,7,8 pan specific mimetic R2M3-26 in the presence of 20 nM RSPO2 measured in Huh-7 cells. RLU, relative luminescence units.
Figure 5
Figure 5
The Fzd5,8-specific Wnt mimetic, SZN-1326-p, effectively promoted intestinal organoid growth. (A–T) Representative mouse small intestinal organoids treated with a dose titration of the indicated Wnt mimetic with different Fzd specificity. For each protein, organoids were treated with, from left to right, (A, F, K, P) 10 pM, (B, G, L, Q) 100 pM, (C, H, M, R) 1 nM, (D, I, N, S) 10 nM, or (E, J, O, T) 100 nM of the negative control anti-βGal or the indicated Wnt mimetic in the presence of 10 nM IWP2 in basal media. (U) Organoids grew in basal media. (V) Organoids treated with only 10 nM IWP2 in basal media. Scale bars = 100 μm.
Figure 6
Figure 6
The FZD family of receptors were expressed at different levels in the colon. (A-J) colon expression of the 10 Fzd receptors in naïve mice was examined by RNAscope in situ hybridization. (K–T) colon expression of the 10 Fzd receptors in mice treated with 7 days of 4% DSS. Scale bars = 100 μm.
Figure 7
Figure 7
Fzd5,8-specific SZN-1326-p repaired DSS damaged colon and improved DAI and inflammation. (A) Diagram illustrating the acute DSS study design. (B–G) H&E stain of transverse colon sections of animals treated (B) with no DSS or (C) with DSS with PBS, (D) with anti-GFP, (E) with 2 doses of 10 mg/kg R2M3-26, (F) with 2 doses of 10 mg/kg SZN-1326-p, and (G) with 2 doses of 3 mg/kg 1RC07-26. Scale bar = 200 μm. (H) Daily animal fecal score of each treatment group. (I) Disease activity (DAI) progression for each treatment group. (J) Composite histology score reading by an independent pathologist, on colon samples harvested at termination. (K–M) Effect of Wnt mimetics on serum level of proinflammatory cytokines, (K) TNF-α, (L) IL-6, (M) IL-8. (N-P) Effect of a wide dose range of SZN-1326-p, both as a single dose (N) or as twice weekly doses (O), on DAI and colon histology score (P). Statistical analysis was performed as described in the Materials and Methods with all comparisons made with the anti-GFP group.
Figure 8
Figure 8
The Fzd5,8-specific mimetic, SZN-1326-p, showed dose response efficacy in the acute DSS model. (A–J) H&E stain of cross sections of transverse colon of animals treated with (A) no DSS, (B) DSS + anti-GFP, (C) DSS + 1 dose of 1mpk SZN-1326-p, (D) DSS + 1 doses of 3 mpk SZN-1326-p, (E) DSS + 1 dose of 10 mpk SZN-1326-p, (F) DSS + 1 dose of 30 mpk SZN-1326-p, (G) DSS + 2 doses of 0.3 mpk SZN-1326-p, (H) DSS + 2 doses of 1mpk SZN-1326-p, (I) DSS + 2 doses of 3 mpk SZN-1326-p, and (J) DSS + 2 doses of 10 mpk SZN-1326-p. (K–N) Histology score reading of the 5 indicated parameters by an independent pathologist, on colon samples harvested at termination on day 10. (P–R) Serum levels of proinflammatory cytokines TNF-α, IL-6, and IL-8 measured in the SZN-1326-p dose response study. (S-U) Colon tissue cytokine levels of TNF-α, IL-6, and IL-8 measured in the SZN-1326-p dose response study.
Figure 9
Figure 9
scRNA-seq revealed a range of cell types across all tissue layers, including several that were injury specific. (A) Experimental design of the scRNA-seq experiment. (B) Plot of the first 2 principal components showing the 3 tissue layers radiating from the center. (C) t-SNE projections showing the annotated clusters (cell type), and experimental condition of the cells. The legend in D applies to C. (D) Log2 normalized UMI counts for all cell types across all 3 tissue layers or lineages. The top color bar refers to cell type; the bottom bar denotes experimental condition. Color annotation for experimental conditions also applies to E and F. (E) For the immune, stromal, and epithelial cells, the percentage of cells from each experimental condition (indicated on the bottom) comprises each cluster (indicated on the left). The columns sum to 100% for that condition. (F) Barplots representing the composition of each cell type by experimental condition: each bar represents 100% of the cells in that cell type; the wider the bar, the more cells comprise that cell type. See D for color annotation of experimental conditions.
Figure 10
Figure 10
DSS damage induced large-scale inflammatory responses, including potential stromal to immune cell signaling. (A) The number of genes that are significantly differentially expressed (false discovery rate [FDR] < 0.05, log2FC ≥ |1|) in each tissue layer or lineage by time point in 1 of the 2 comparisons: DSS damage (anti-GFP) vs uninjured and SZN-1326-p/DSS damage vs anti-GFP/DSS damage. (B) The top 20 gene sets or pathways identified by GSEA that were enriched in the stromal cells upon DSS treatment compared with the uninjured state at day 5. (C) Volcano plots of the differentially expressed genes between the DSS-damage and uninjured conditions for the indicated tissue lineage or layer and time point. Genes that display at least a 2-fold change and have an FDR of <0.05 are indicated in red (increased) and blue (decreased). Any gene with an FDR lower than 10E-12 was floored at 10E-12. (D) RNA in situ hybridization of the chemokine Ccl8 and the fibroblast marker Pdgfra in the colon of uninjured, and DSS/anti-GFP samples at day 5. Scale bar represents 100 mm. (E, F) Cell-cell interaction plots displaying the top 5% of potential signaling interactions between the cell types represented in the bottom half of the circle with the target cell type represented by the top half of the circle. The arrows represent the ligand toward the receptor.
Figure 11
Figure 11
DSS injury induces specific inflammatory cell types/states in the epithelium. (A) Row-scaled Z scores for each gene across the aggregate of each cell type in the epithelium. The color bar corresponds to the cell type. (B) Selected top gene sets or pathways enriched in the epithelium at day 5 upon DSS damage determined by GSEA. (C) Selected top gene sets enriched in the AltEnteros injuryiinduced cell type at day 5 (24 hours) relative to the other cell types in the epithelium. (D) The distribution of gene expression for the 2 indicated gene sets in the AltEnteros. (E) (top left) The log2-normalized expression of Krt20 and Ly6a in the epithelial cells showing coexpression of high levels of Ly6a with Krt20 in the DSS injury conditions. (Top right) t-SNE plot colored by Ly6a expression in the epithelial cells. (Bottom left) The log2-normalized values showing coexpression of Krt20 and Ly6c1 in the epithelial cells. (Bottom right) t-SNE plot of the epithelial cells colored by the expression of Ly6c1. (F) RNA in situ of the enterocyte marker, Krt20, and Ly6a. Scale bar = 100 mm. (G) FACS plots showing the degree of enrichment of EPCAM-positive, LY6A-positive cells (upper right quadrant of each plot) in the uninjured condition (left) or upon 4 days of DSS damage (right).
Figure 12
Figure 12
SZN-1326-p increased Wnt target and cell cycle gene expression and expanded the progenitors in the epithelium. (A) Volcano plots of gene expression differences between the SZN-1326-p treatment and the anti-GFP treatment in the DSS damage model: the x-axis represents log2 expression, and the y-axis represents the -log10 of the adjusted P value (FDR) from differential expression analysis. Genes that show greater than absolute log2-fold change of 1 and FDR <0.05 are indicated in blue (decreased) and red (increased) in the indicated lineage or tissue layer and time point. Any gene with an FDR lower than 10E-5 was floored at 10E-5. (B) Average Z-scores of Wnt target, cell cycle, and progenitor gene expression aggregated by experimental condition within the epithelial lineage. (C) Relevant Wnt target, cell cycle, and stem/progenitor gene expression; size and intensity represent the percentage of cells with detectable expression and expression level, respectively. (D) Selected top gene sets or pathways (from GSEA) enriched in the SZN-1326-p treatment relative to the anti-GFP treated DSS-injured epithelium. (E) Expression of the Wnt target genes, Axin2 and Rnf43, in the AltEnteroPCs. (F) Boxplots showing expression of the cell cycle genes, Ccnb1, Cdca8, Cdk1 and Rfc5, that were enriched in the TA2 cells upon SZN-1326-p treatment. (G) RNA in situ hybridization of 2 Wnt target genes, Axin2 and Cdkn3 at day 5; nuclei labeled with DAPI. (H) Immunohistochemistry for the proliferative cell marker Ki67 at day 6; nuclei labeled with DAPI. Scale bars = 100 mm.
Figure 13
Figure 13
SZN-1326-p predominately impacted the epithelium by promoting expression of Wnt target and cell cycle genes with a concomitant reduction in inflammatory pathway expression. (A) The number of significantly enriched intestinal epithelial organoid Wnt target genes in the indicated colon tissue layers or lineages. (B) Heatmap of canonical cell cycle gene expression in the epithelium displaying average Z scores for the genes. (C) Gene expression dot plot of canonical cell cycle genes in the epithelium across the 6 different experimental conditions. (D) RT-qPCR of bulk colon samples in the DSS model at the day 5 time point except Gpx2, which is from day 6. Unpaired, 2-tailed t tests were applied with the Holm multiple comparisons correction: ∗P < .05, ∗∗P < .01, ∗∗∗P = .001. (F) Selected top pathways reduced (derived from GSEA) in the epithelium after SZN-1326-p treatment relative to the anti-GFP treatment in the DSS model at 48 hours (day 6). (G) Expression of S100A9 and CD45 at day 10 (6 days after treatment); 2 example images each from the indicated treatment condition. Scale bar = 200 μm.
Figure 14
Figure 14
SZN-1326-p treatment caused accelerated differentiation and improved barrier marker expression in the DSS model. (A–D) Uniform manifold approximation and projection (UMAP) of the epithelial cells. (A) UMAP of epithelial cells colored by cluster or cell type. (B) UMAP colored by experimental condition. (C) The lineage trajectory prediction algorithm, slingshot, was applied to the epithelial lineage. The stem cell and TA2 cell types were merged and set as the starting cluster. (D) The lineage trajectory indicating a transition from the stem cell or TA cells to the enterocyte precursor (EnteroPrecur) cells on the way to the immature and mature enterocytes (going up) and from the stem cell or TA cells down and bifurcating either toward tufted cells or goblet and enteroendocrine cells. (E) The number of cells at the 48-hour or day 6 time point along the trajectory of the enterocyte lineage in D. The vertical dashed lines represent the same position along the axis in all 3 plots. (F–I) Staining of differentiated cell type markers: (F) VILLIN for enterocytes, (G) Alcian blue for goblet cells, (H) CHGA for enteroendocrine cells, and (I) DCLK for tuft cells at day 10 in the acute DSS injury model. Experimental condition indicated at the top. Scale bars = 100 μm.
Figure 15
Figure 15
SZN-1326-p increased barrier gene expression and led to barrier marker restoration in the DSS injury model. (A) Differential gene expression values for significantly enriched mucin and barrier associated genes in the indicated epithelial cell type, comparing DSS/SZN-1326-p with DSS/anti-GFP. (B) Immunofluorescence staining of the tight junction marker TJP1 (ZO-1) (green) in transverse colon samples of the indicated treatment at day 10. Nuclei were counterstained with DAPI (blue). Scale bar = 100 μm.

Similar articles

Cited by

References

    1. Jairath V., Feagan B.G. Global burden of inflammatory bowel disease. Lancet Gastroenterol Hepatol. 2020;5:2–3. - PubMed
    1. Chang J.T. Pathophysiology of inflammatory bowel diseases. N Engl J Med. 2020;383:2652–2664. - PubMed
    1. Kobayashi T., Siegmund B., Le Berre C., Wei S.C., Ferrante M., Shen B., Bernstein C.N., Danese S., Peyrin-Biroulet L., Hibi T. Ulcerative colitis. Nat Rev Dis Primers. 2020;6:74. - PubMed
    1. Chateau T., Feakins R., Marchal-Bressenot A., Magro F., Danese S., Peyrin-Biroulet L. Histological remission in ulcerative colitis: under the microscope is the cure. Am J Gastroenterol. 2020;115:179–189. - PubMed
    1. Feagan B.G., Sandborn W.J., Lazar A., Thakkar R.B., Huang B., Reilly N., Chen N., Yang M., Skup M., Mulani P., Chao J. Adalimumab therapy is associated with reduced risk of hospitalization in patients with ulcerative colitis. Gastroenterology. 2014;146:110–118.e3. - PubMed