

Changes in marriage, divorce and births during the COVID-19 pandemic in Japan
- PMID: 35569835
- PMCID: PMC9108437
- DOI: 10.1136/bmjgh-2021-007866
Changes in marriage, divorce and births during the COVID-19 pandemic in Japan
Abstract
Introduction: Marriage, divorce and fertility are declining in Japan. There is concern that the COVID-19 pandemic may have accelerated the decrease in marriages and births while increasing the number of divorces. Changes in partnership behaviours and fertility have significant implications for mental health, well-being and population demographics.
Methods: Japanese vital statistical data were collected for December 2011-May 2021. We used the Farrington algorithm on the daily numbers of marriages, divorces and births (per month) in order to determine whether any given month between January 2017 and May 2021 had a significant excess or deficit. Analyses were conducted at the national and regional levels.
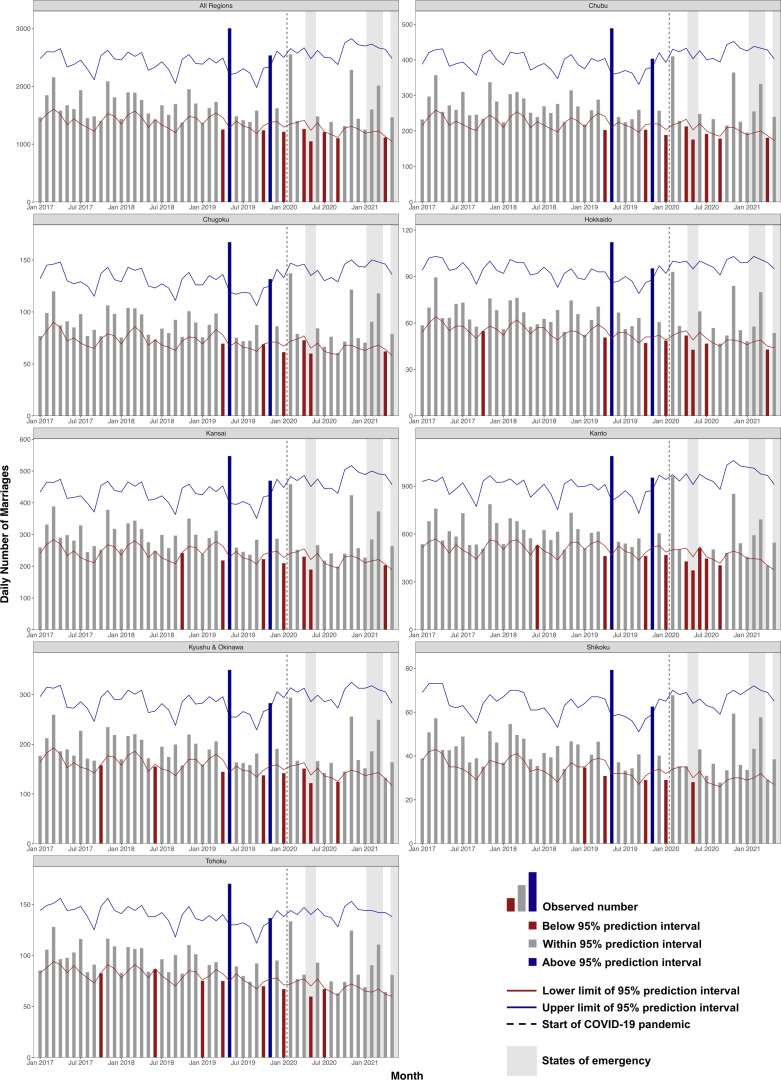
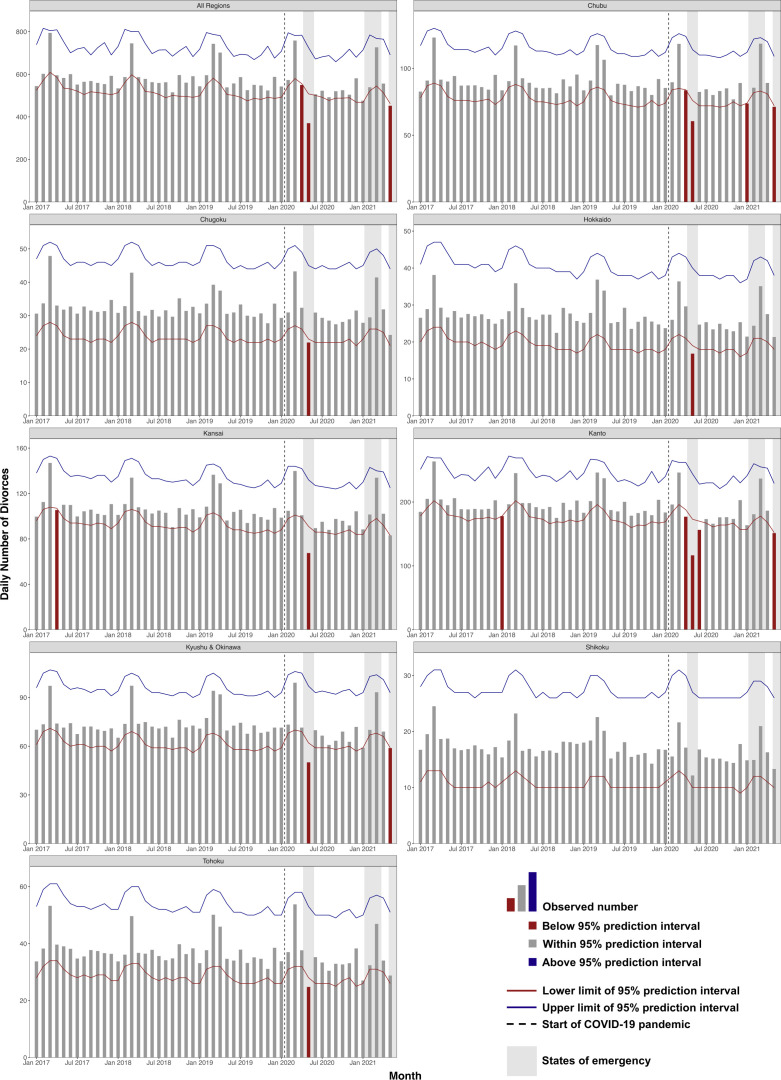
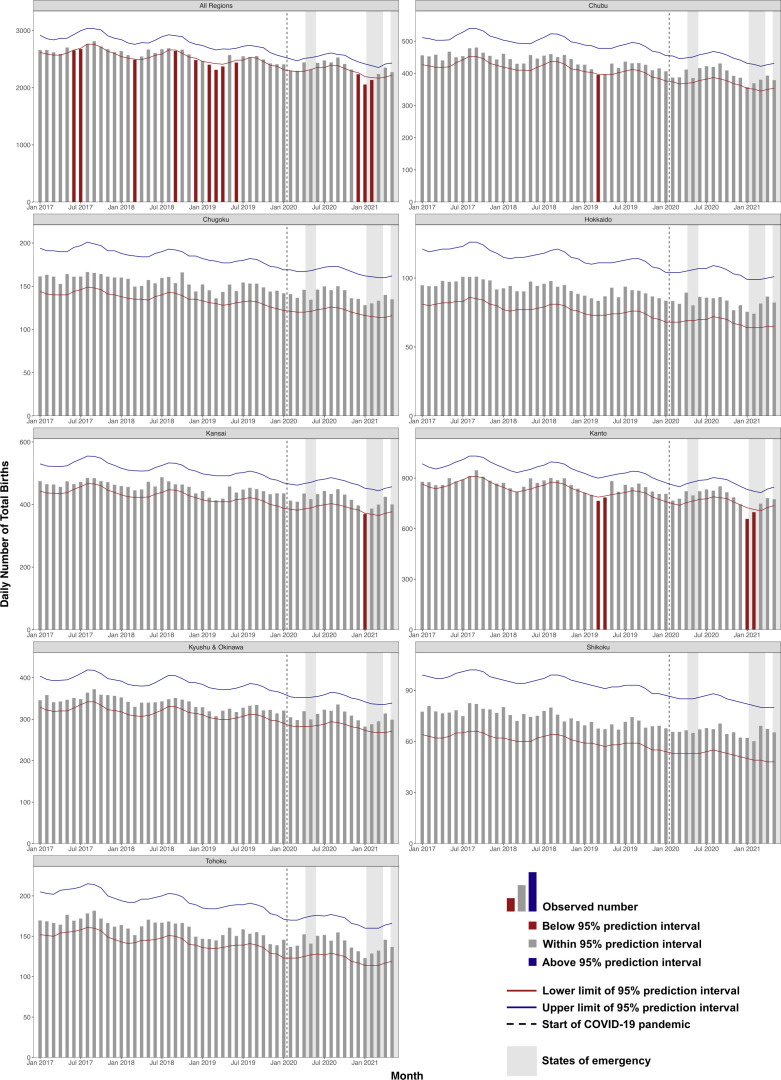
Results: During the pandemic, significant deficits in the national number of marriages were noted in January 2020, April 2020, May 2020, July 2020, September 2020 and April 2021. Regional marriage patterns reflected national trends. Divorces were noted to be in deficit during April 2020, May 2020 and May 2021 at the country level. Regional analyses mirrored national divorce trends with the exception of Shikoku, which showed no deficits during the pandemic. Significant deficits in the number of total births were noted in December 2020, January 2021 and February 2021. Regionally, birth deficits were concentrated in Chubu, Kansai and Kanto. After the start of the pandemic, no significant excesses in marriages, divorces or births were noted at the national or regional level.
Conclusions: Marriages and divorces declined during the pandemic in Japan, especially during state of emergency declarations. There were decreased births between December 2020 and February 2021, approximately 8-10 months after the first state of emergency, suggesting that couples altered their pregnancy intention in response to the pandemic. Metropolitan regions were more affected by the pandemic than their less metropolitan counterparts.
Keywords: COVID-19; Epidemiology; Health policy; Public Health.
© Author(s) (or their employer(s)) 2022. Re-use permitted under CC BY-NC. No commercial re-use. See rights and permissions. Published by BMJ.
Conflict of interest statement
Competing interests: None declared.
Figures
References
-
- National Institute of Population and Social Security Research . Number of marriages and marriage rates by first marriages and remarriages: 1883-2019 [Shokon saikonbetsu kon’insuu oyobi kon’inritsu: 1883-2019, in Japanese]. Available: http://www.ipss.go.jp/syoushika/tohkei/Popular/P_Detail2021.asp?fname=T0...
-
- National Institute of Population and Social Security Research . Number of divorces and divorce rates by type: 1883-2019 [shuruibetsu rikonsuu oyobi rikonritsu: 1883-2019, in Japanese]. Available: http://www.ipss.go.jp/syoushika/tohkei/Popular/P_Detail2021.asp?fname=T0...
-
- World Bank . Fertility rate, total (births per woman). Available: https://data.worldbank.org/indicator/SP.DYN.TFRT.IN
-
- Hisanaga R. Japan’s births in 2020 lowest ever; fewest marry since WWII’s end. The Asahi Shimbun. Available: https://www.asahi.com/ajw/articles/14365588
-
- Takenaka K. Something blue: pandemic wedding plunge adds to Japan demographic woes. Reuters. Available: https://www.reuters.com/article/us-health-coronavirus-japan-marriages-id...
Publication types
MeSH terms
LinkOut - more resources
Full Text Sources
Medical
Miscellaneous