

Inwardly rectifying potassium channels mediate polymyxin-induced nephrotoxicity
- PMID: 35570209
- PMCID: PMC9108107
- DOI: 10.1007/s00018-022-04316-z
Inwardly rectifying potassium channels mediate polymyxin-induced nephrotoxicity
Abstract
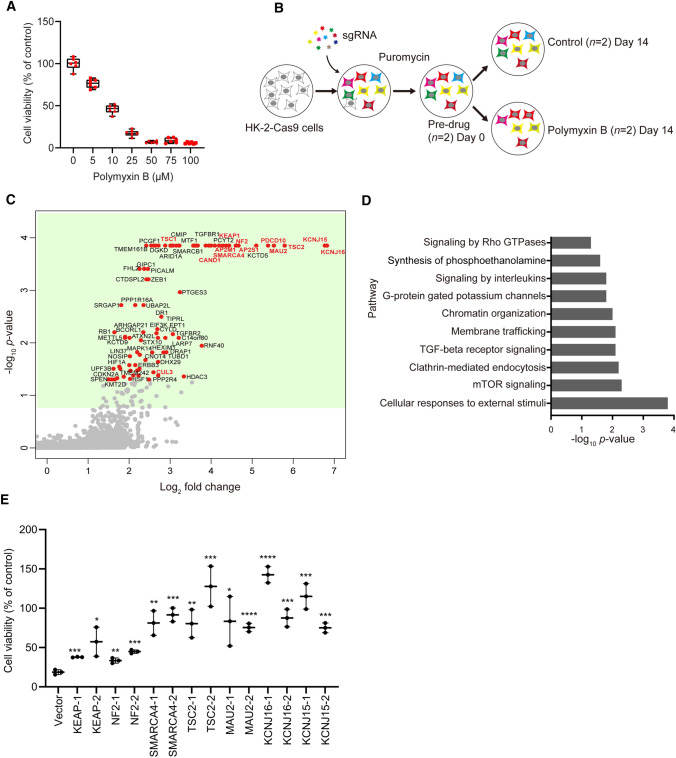
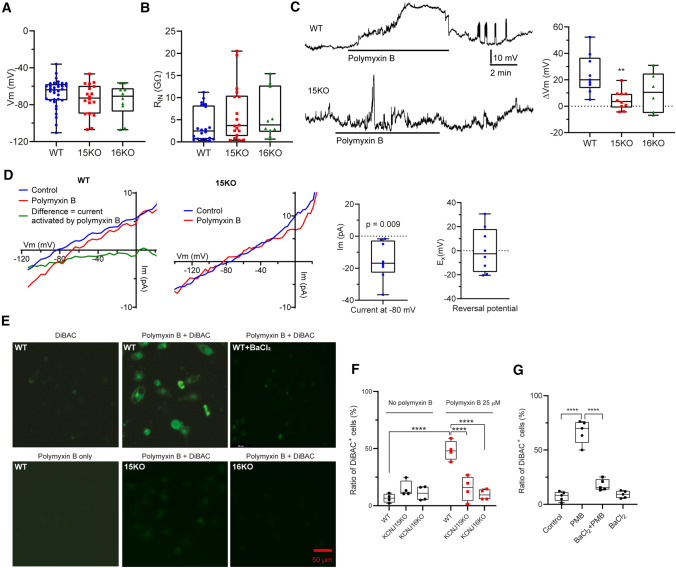
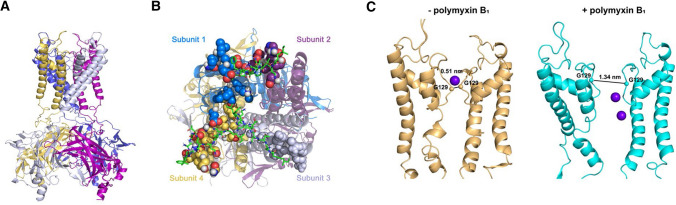
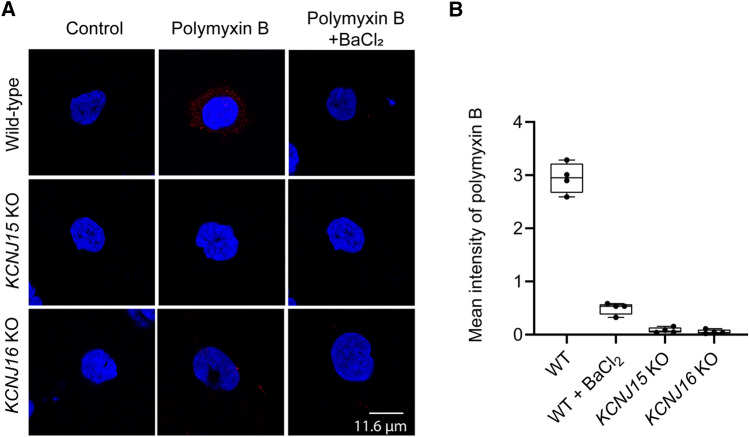
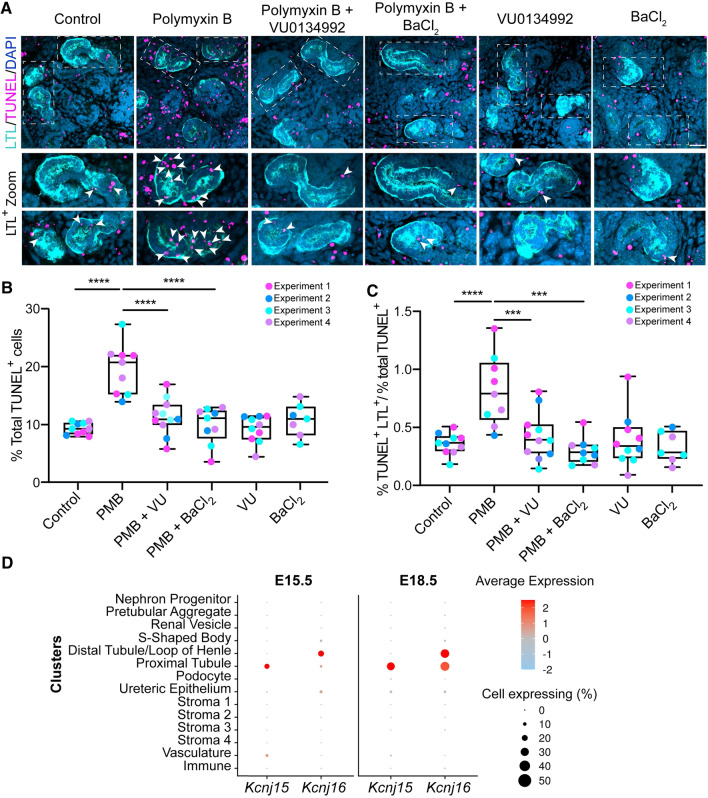
Polymyxin antibiotics are often used as a last-line defense to treat life-threatening Gram-negative pathogens. However, polymyxin-induced kidney toxicity is a dose-limiting factor of paramount importance and can lead to suboptimal treatment. To elucidate the mechanism and develop effective strategies to overcome polymyxin toxicity, we employed a whole-genome CRISPR screen in human kidney tubular HK-2 cells and identified 86 significant genes that upon knock-out rescued polymyxin-induced toxicity. Specifically, we discovered that knockout of the inwardly rectifying potassium channels Kir4.2 and Kir5.1 (encoded by KCNJ15 and KCNJ16, respectively) rescued polymyxin-induced toxicity in HK-2 cells. Furthermore, we found that polymyxins induced cell depolarization via Kir4.2 and Kir5.1 and a significant cellular uptake of polymyxins was evident. All-atom molecular dynamics simulations revealed that polymyxin B1 spontaneously bound to Kir4.2, thereby increasing opening of the channel, resulting in a potassium influx, and changes of the membrane potential. Consistent with these findings, small molecule inhibitors (BaCl2 and VU0134992) of Kir potassium channels reduced polymyxin-induced toxicity in cell culture and mouse explant kidney tissue. Our findings provide critical mechanistic information that will help attenuate polymyxin-induced nephrotoxicity in patients and facilitate the design of novel, safer polymyxins.
Keywords: CRISPR/Cas9 screening; Kir4.2; Kir5.1; Polymyxin nephrotoxicity.
© 2022. The Author(s).
Conflict of interest statement
The authors have declared that no conflict of interest exists.
Figures

Similar articles
-
Kcnj16 (Kir5.1) Gene Ablation Causes Subfertility and Increases the Prevalence of Morphologically Abnormal Spermatozoa.Int J Mol Sci. 2021 Jun 1;22(11):5972. doi: 10.3390/ijms22115972. Int J Mol Sci. 2021. PMID: 34205849 Free PMC article.
-
Expression, localization, and functional properties of inwardly rectifying K+ channels in the kidney.Am J Physiol Renal Physiol. 2020 Feb 1;318(2):F332-F337. doi: 10.1152/ajprenal.00523.2019. Epub 2019 Dec 16. Am J Physiol Renal Physiol. 2020. PMID: 31841387 Free PMC article. Review.
-
Distal tubule basolateral potassium channels: cellular and molecular mechanisms of regulation.Curr Opin Nephrol Hypertens. 2018 Sep;27(5):373-378. doi: 10.1097/MNH.0000000000000437. Curr Opin Nephrol Hypertens. 2018. PMID: 29894319 Free PMC article. Review.
-
Kir5.1 channels: potential role in epilepsy and seizure disorders.Am J Physiol Cell Physiol. 2022 Sep 1;323(3):C706-C717. doi: 10.1152/ajpcell.00235.2022. Epub 2022 Jul 18. Am J Physiol Cell Physiol. 2022. PMID: 35848616 Free PMC article. Review.
-
Loss of transcriptional activation of the potassium channel Kir5.1 by HNF1β drives autosomal dominant tubulointerstitial kidney disease.Kidney Int. 2017 Nov;92(5):1145-1156. doi: 10.1016/j.kint.2017.03.034. Epub 2017 May 31. Kidney Int. 2017. PMID: 28577853 Free PMC article.
Cited by
-
Recent Advances in the Development of Polymyxin Antibiotics: 2010-2023.ACS Infect Dis. 2024 Apr 12;10(4):1056-1079. doi: 10.1021/acsinfecdis.3c00630. Epub 2024 Mar 12. ACS Infect Dis. 2024. PMID: 38470446 Free PMC article. Review.
-
Advancing Kir4.2 Channel Ligand Identification through Collision-Induced Affinity Selection Mass Spectrometry.ACS Chem Biol. 2024 Mar 15;19(3):763-773. doi: 10.1021/acschembio.3c00781. Epub 2024 Mar 7. ACS Chem Biol. 2024. PMID: 38449446 Free PMC article.
-
Lipid A Modification and Metabolic Adaptation in Polymyxin-Resistant, New Delhi Metallo-β-Lactamase-Producing Klebsiella pneumoniae.Microbiol Spectr. 2023 Aug 17;11(4):e0085223. doi: 10.1128/spectrum.00852-23. Epub 2023 Jul 11. Microbiol Spectr. 2023. PMID: 37432123 Free PMC article.
-
The physiological characteristics of inward rectifying potassium channel Kir4.2 and its research progress in human diseases.Front Cell Dev Biol. 2025 Apr 24;13:1519080. doi: 10.3389/fcell.2025.1519080. eCollection 2025. Front Cell Dev Biol. 2025. PMID: 40342929 Free PMC article. Review.
-
Kir5.1 regulates Kir4.2 expression and is a key component of the 50-pS inwardly rectifying potassium channel in basolateral membrane of mouse proximal tubules.Am J Physiol Renal Physiol. 2025 Feb 1;328(2):F248-F257. doi: 10.1152/ajprenal.00178.2024. Epub 2025 Jan 2. Am J Physiol Renal Physiol. 2025. PMID: 39745541 Free PMC article.
References
-
- Tsuji BT, Pogue JM, Zavascki AP, Paul M, Daikos GL, et al. International consensus guidelines for the optimal use of the polymyxins: endorsed by the American College of Clinical Pharmacy (ACCP), European Society of Clinical Microbiology and Infectious Diseases (ESCMID), Infectious Diseases Society of America (IDSA), International Society for Anti-infective Pharmacology (ISAP), Society of Critical Care Medicine (SCCM), and Society of Infectious Diseases Pharmacists (SIDP) Pharmacotherapy. 2019;39:10–39. doi: 10.1002/phar.2209. - DOI - PMC - PubMed
MeSH terms
Substances
Grants and funding
LinkOut - more resources
Full Text Sources
Research Materials
