. 2022 Jul 6;30(7):2537-2553.
doi: 10.1016/j.ymthe.2022.05.011. Epub 2022 May 14.

Locally secreted BiTEs complement CAR T cells by enhancing killing of antigen heterogeneous solid tumors

Affiliations

Locally secreted BiTEs complement CAR T cells by enhancing killing of antigen heterogeneous solid tumors

Yibo Yin et al. Mol Ther. .

Abstract

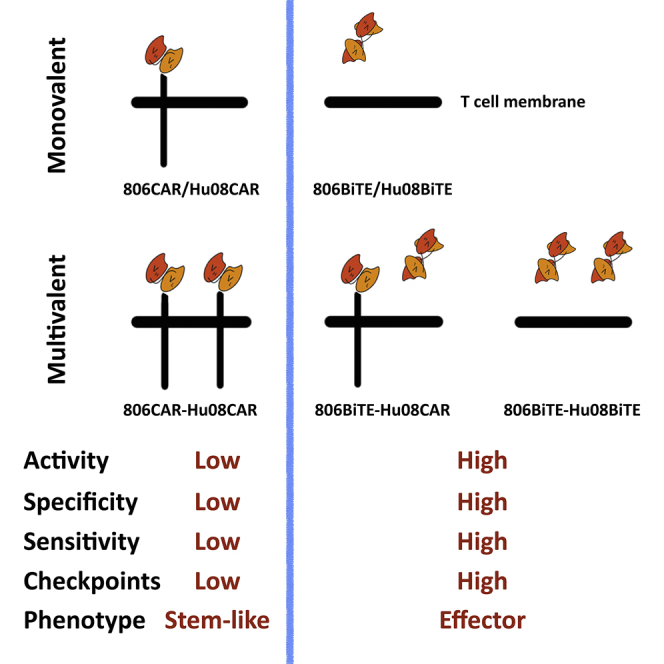
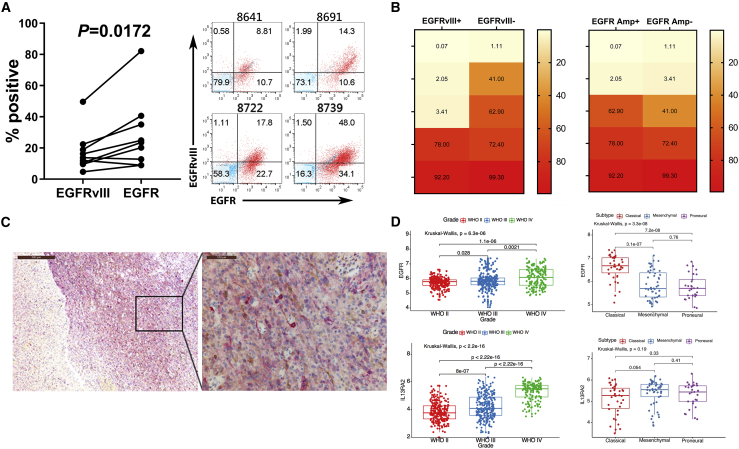
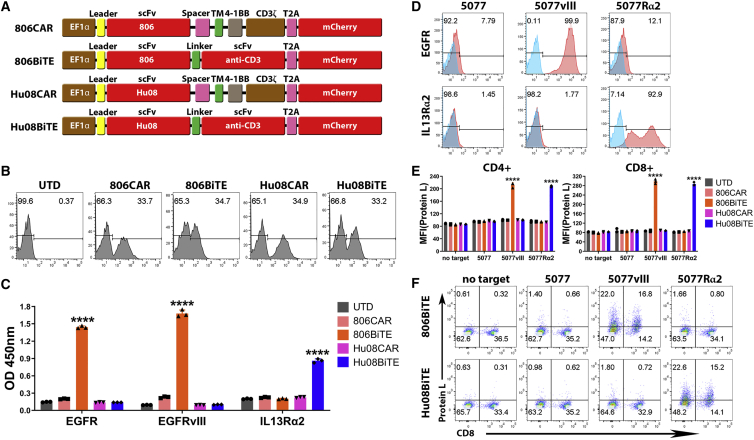
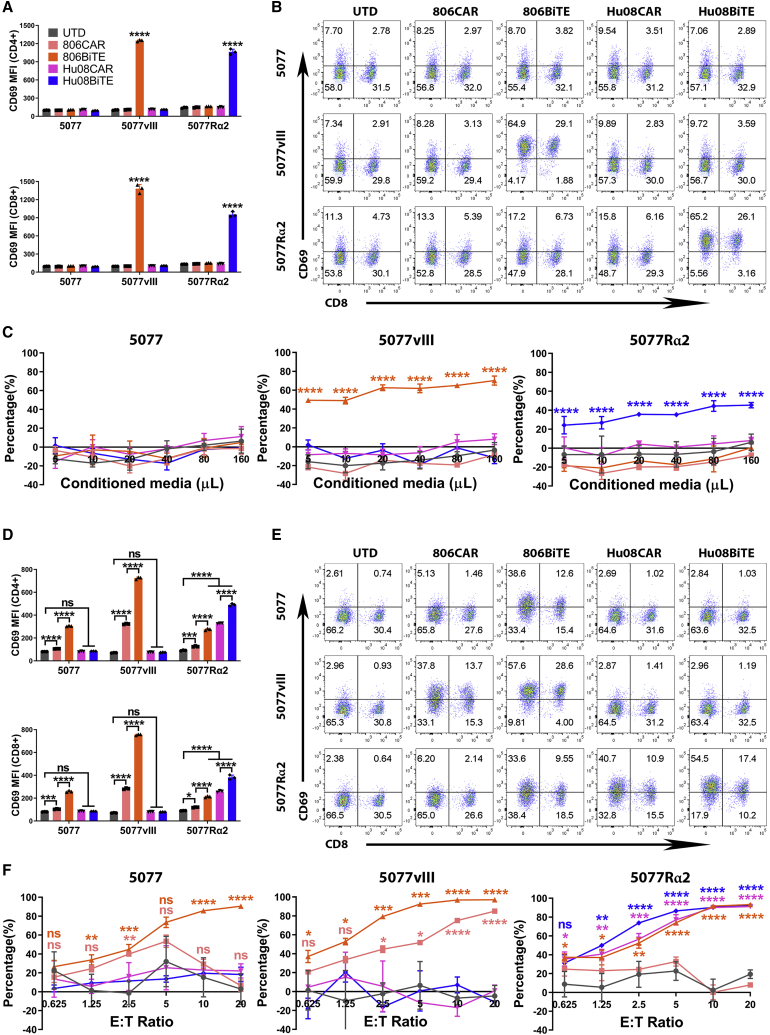
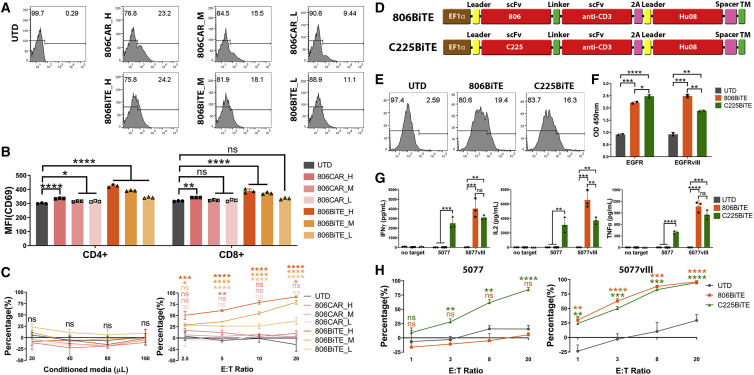
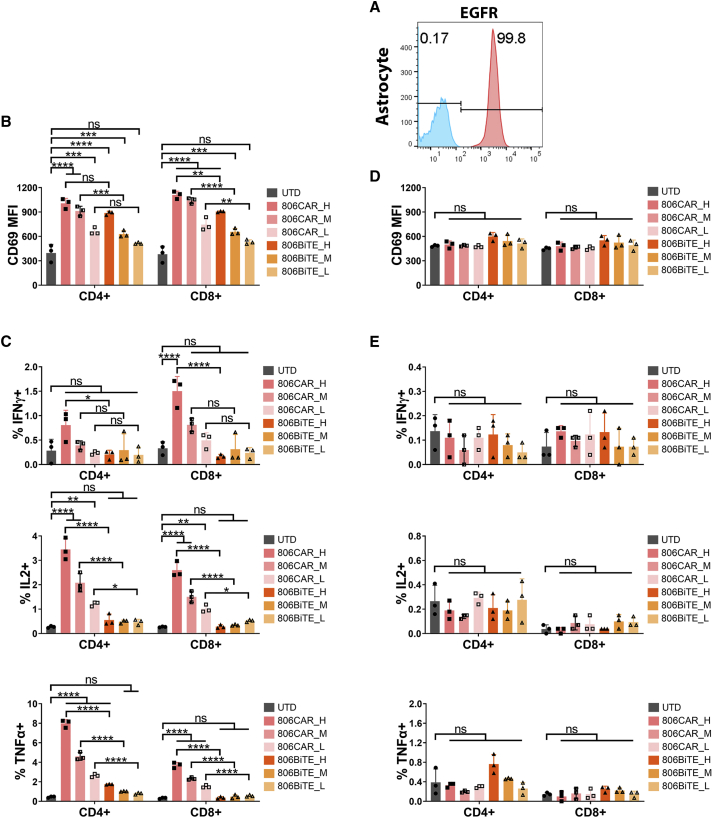
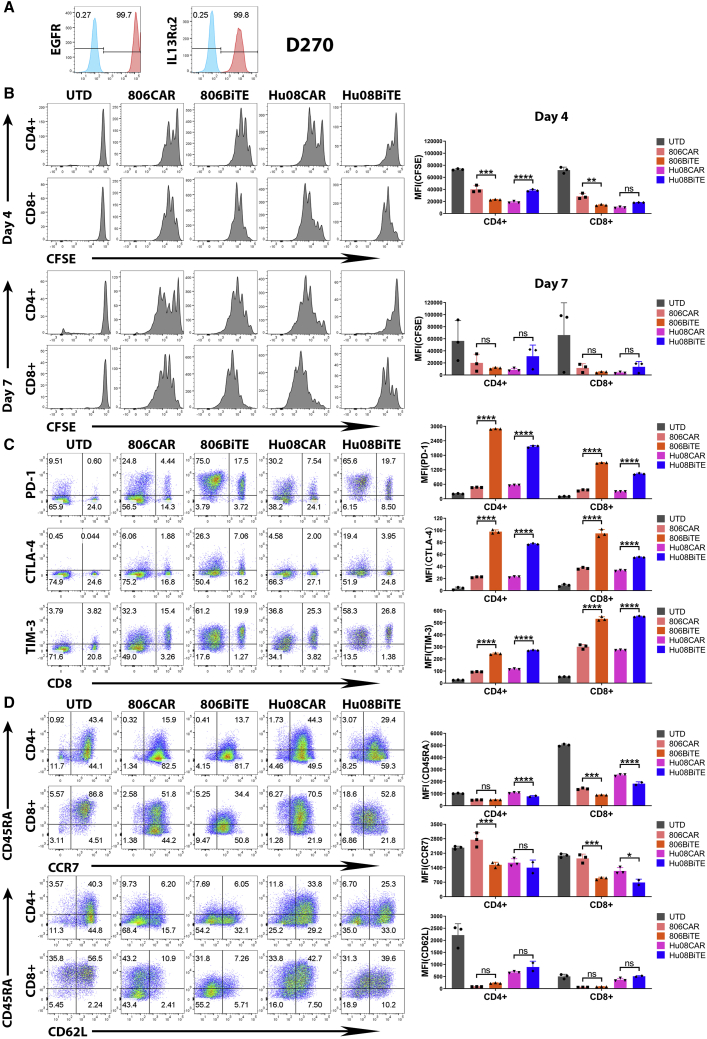
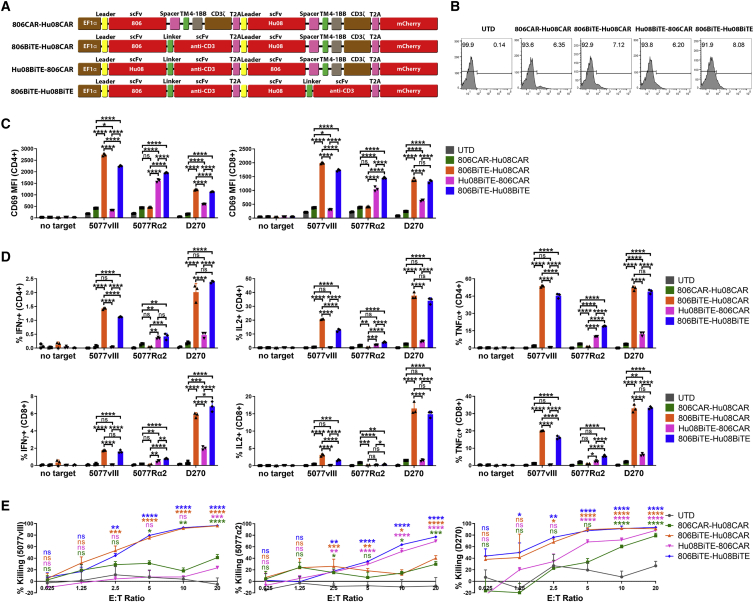
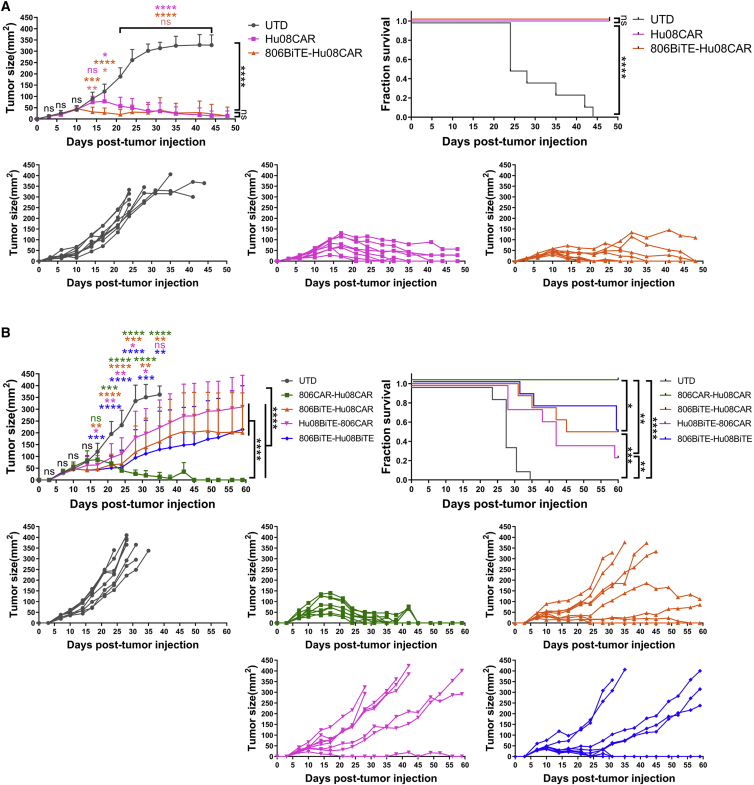
Bispecific T cell engagers (BiTEs) are bispecific antibodies that redirect T cells to target antigen-expressing tumors. We hypothesized that BiTE-secreting T cells could be a valuable therapy in solid tumors, with distinct properties in mono- or multi-valent strategies incorporating chimeric antigen receptor (CAR) T cells. Glioblastomas represent a good model for solid tumor heterogeneity, representing a significant therapeutic challenge. We detected expression of tumor-associated epidermal growth factor receptor (EGFR), EGFR variant III, and interleukin-13 receptor alpha 2 (IL13Rα2) on glioma tissues and cancer stem cells. These antigens formed the basis of a multivalent approach, using a conformation-specific tumor-related EGFR targeting antibody (806) and Hu08, an IL13Rα2-targeting antibody, as the single chain variable fragments to generate new BiTE molecules. Compared with CAR T cells, BiTE T cells demonstrated prominent activation, cytokine production, and cytotoxicity in response to target-positive gliomas. Superior response activity was also demonstrated in BiTE-secreting bivalent T cells compared with bivalent CAR T cells in a glioma mouse model at early phase, but not in the long term. In summary, BiTEs secreted by mono- or multi-valent T cells have potent anti-tumor activity in vitro and in vivo with significant sensitivity and specificity, demonstrating a promising strategy in solid tumor therapy.

Keywords: EGFR; IL13Ra2; bispecific T cell engager; chimeric antigen receptor; glioblastoma; glioma.


Conflict of interest statement

Declaration of interests Y.Y., R.T., Z.A.B., and D.M.O. are on patent filings related to the research presented here. D.M.O. received monetary support from Tmunity Therapeutics for related laboratory work.

Figures

None
Graphical abstract
Figure 1
Figure 1
EGFR, EGFRvIII, and IL13Rα2 co-express in GBM (A) Flow cytometry analyses of EGFRvIII and EGFR expression in resected glioma tissues (left). Statistically significant differences were determined using two-tailed paired t test. Flow panels of red dots indicated EGFR expression along the x axis and EGFRvIII expression along the y axis of four representative cases (right), with blue dots as controls of staining. (B) Heat maps showing percentage of IL13Rα2-positive cells in 10 EGFRvIII-positive or -negative (left) and amplified or unamplified EGFR (right) GSC lines. (C) Immunohistochemical stains of IL13Rα2 (brown) and EGFRvIII (red) in a recurrent/residual GBM tissue section. (D) EGFR (upper) and IL13Rα2 (lower) expression segregated by WHO grades (left) and GBM molecular subtypes (right) based on the RNA sequencing data from the TCGA database. The y axis indicates the relative expression levels of each cases. Statistically significant differences were calculated by Kruskal-Wallis test with p < 0.05 being considered statistically significant.
Figure 2
Figure 2
BiTEs secreted from T cells specifically bind to target antigens and T cells (A) Schematic vector maps of 806CAR/806BiTE/Hu08CAR/Hu08BiTE constructs. (B) Flow cytometric detection of T cell transduction by mCherry expression. (C) Conditioned media of T cells in each group tested by ELISA to evaluate the binding ability of secreted BiTEs to recombinant EGFR, EGFRvIII, and IL13Rα2 proteins. (D) The GSC line 5077 was lentivirally transduced to overexpress EGFRvIII or IL13Rα2 (red) and assessed via flow cytometry. Staining control was showed (blue). (E) Conditioned media of CAR/BiTE T cells was collected and co-cultured with UTD T cells and target cells. BiTE binding on T cells was detected by biotinylated protein L with secondary streptavidin coupled FITC after 16-h co-culture. The median fluorescence intensity was quantified on CD4- and CD8-positive T cells. (F) Flow based results of representative samples in (E). CD8 was stained to distinguish the CD4-positive and CD8-positive subgroups of T cells along the x axis. Statistically significant differences were calculated by one-way ANOVA with post hoc Tukey test. ∗∗∗∗p < 0.0001. Data are presented as means ± standard deviation.
Figure 3
Figure 3
BiTE T cells respond to target positive glioma cells (A) UTD T cell activation, as demonstrated by CD69 expression, in CD4+ (top) and CD8+ (bottom) T cells after 16 h co-culture with conditioned media from CAR/BiTE T cells. (B) Flow-based results of representative samples in (A). CD8 was stained to distinguish the CD4-positive and CD8-positive subgroups of T cells along the x axis. (C) Bioluminescence cytotoxicity assay of UTD T cells co-cultured with tumor cell lines and conditioned media of CAR/BiTE T cells. (D) T cell activation, as measured by CD69 expression, in CD4+ (top) and CD8+ (bottom) T cells after 16 h co-culture of CAR/BiTE T cells with target cells. (E) Flow cytometry panels of bar graphs in (D). CD8 was stained to distinguish the CD4-positive and CD8-positive subgroups of T cells along the x axis. (F) Bioluminescence cytotoxicity assays of CAR/BiTE T cells co-cultured with tumor cell lines was analyzed at different effector/target (E:T) ratios (0.625:1, 1.25:1, 2.5:1, 5:1, 10:1, and 20:1) and compared with the UTD T cell group. Statistically significant differences were calculated by one-way ANOVA with post hoc Tukey test. ns, not significant; ∗p < 0.05, ∗∗p < 0.01, ∗∗∗p < 0.001, ∗∗∗∗p < 0.0001. Data are presented as means ± standard deviation.
Figure 4
Figure 4
BiTE T cells respond to low antigen expression on glioma cancer stem cells (A) Flow cytometry showing the high (H), medium (M), and low (L) levels of transduction of 806CARs (top row) and 806BiTEs (bottom row) by mCherry expression. (B) T cell activation, as measured by CD69 expression, in CD4+ and CD8+ T cells after 16 h co-culture of 806CAR/BiTE T cells with 5077. (C) Bioluminescence cytotoxicity assays of UTD T cells co-cultured with 5077 target cells in the presence of conditioned media of 806CAR/BiTE T cells. The volume of conditioned media used in each co-culture was indicated along the x axis (left panel). Bioluminescence cytotoxicity assay of 806CAR/BiTE T cells co-cultured with 5077 at different effector/target (E:T) ratios (2.5:1, 5:1, 10:1, and 20:1) and compared with the UTD T cell group (right panel). (D) Vector maps of the 806 (top) and C225 (bottom) BiTE designs, Hu08CAR lacking signaling motifs (Hu08TM) was used as a cell surface tag. (E) Flow panels showing the transduction of the BiTE constructs, as determined by Hu08TM staining. (F) Conditioned media of T cells in each group tested with a standard direct ELISA to evaluate the binding ability of secreted BiTEs to recombinant EGFR and EGFRvIII protein. (G) 806/C225BiTE T cells and UTD T cells were co-cultured with 5077 or 5077EGFRvIII+ cells. Cytokine secretion was detected with ELISA. (H) Bioluminescence cytotoxicity assays of 806/C225BiTE T cells co-cultured with 5077 cells (left panel) and 5077EGFRvIII+ cells (right panel), analyzed at different effector/target (E:T) ratios (1:1, 3:1, 8:1, and 20:1) and compared with the UTD T cell group. Statistically significant differences were calculated by one-way ANOVA with post hoc Tukey test. ns, not significant; ∗p < 0.05, ∗∗p < 0.01, ∗∗∗p < 0.001, ∗∗∗∗p < 0.0001. Data are presented as means ± standard deviation.
Figure 5
Figure 5
806BiTE was reluctant in responding to physiologically expressed EGFR (A) Flow profile showing the expression of EGFR in astrocytes (red), with staining control (blue). (B) 806CAR/BiTE T cells with high (H), medium (M), and low (L) levels of transduction were co-cultured with astrocytes. T cell activation, as measured by CD69 expression, in CD4+ and CD8+ T cells after 16 h co-culture. (C) Flow based intracellular cytokine (IFNγ, IL2, and TNFα) staining of 806CAR/BiTE T cells co-cultured with astrocytes. CD4- and CD8-positive subgroups of T cells were distinguished by human CD8 staining. (D) T cell activation, as demonstrated by CD69 expression, in CD4+ (top) and CD8+ (bottom) T cells after 16 h co-culture with target cells and conditioned media of CAR/BiTE T cells. (E) Flow based intracellular cytokine (IFNγ, IL2, and TNFα) staining of UTD T cells co-cultured with astrocytes in conditioned media of CAR/BiTE T cells. Statistically significant differences were determined using log rank test. ns, not significant; ∗p < 0.05, ∗∗p < 0.01, ∗∗∗p < 0.001, ∗∗∗∗p < 0.0001. Data are presented as means ± standard deviation.
Figure 6
Figure 6
BiTEs’ activation significantly up-regulated checkpoints and T cell effector phenotypes (A) Flow panel of EGFR (left) and IL13Rα2 (right) expression (red) on glioma line D270 with staining control (blue). (B) Flow cytometry determined T cell proliferation assay with CFSE staining was performed on UTD T cells, 806CAR T cells, 806BiTE T cells, Hu08CAR T cells, and Hu08BiTE T cells on day 4 (upper panel) and day 7 (lower panel) coculturing with D270 cell line. The median fluorescence intensity was quantified on CD4-positive and CD8-positive subgroups of T cells. (C) The expression of checkpoints (PD-1, CTLA-4, and TIM-3) on the T cells was determined by flow cytometry after overnight co-culturing of CAR/BiTE T cells with D270 cell line. Flow based results of representative samples were illustrated, CD8 was stained to distinguish the CD4-positive and CD8-positive subgroups of T cells along the x axis. The median fluorescence intensity was quantified and compared between CAR T cells and BiTE T cells. (D) The expression of CD45RA, CCR7, and CD62L on the T cells was determined by flow cytometry after 4 days co-culturing of CAR/BiTE T cells with D270 cell line. Flow-based results of representative samples were illustrated. The median fluorescence intensity was quantified and compared between CAR T cells and BiTE T cells on CD4-positive and CD8-positive subgroups. Statistically significant differences were calculated by one-way ANOVA with post hoc Tukey test. ns, not significant; ∗p < 0.05, ∗∗p < 0.01, ∗∗∗p < 0.001, ∗∗∗∗p < 0.0001. Data are presented as means ± standard deviation.
Figure 7
Figure 7
BiTE mediates anti-tumor activity in antigen positive cells in bivalent targeting constructs (A) Vector maps of 806CAR-Hu08CAR, 806BiTE-Hu08CAR, Hu08BiTE-806CAR, and 806BiTE-Hu08BiTE constructs. (B) Flow cytometric detection of T cell transduction by mCherry expression. (C) Bivalent T cell activation, as measured by CD69 expression, in CD4+ (left) and CD8+ (right) T cells after 16 h co-culture with target cells. (D) Flow-based intracellular cytokine (IFNγ, IL2, and TNFα) staining of bivalent targeting T cells co-cultured with target cells. CD4+ (top) and CD8+ (bottom) subgroups of T cells were distinguished by human CD8 staining. (E) Bioluminescence cytotoxicity assays of bivalent targeting T cells co-cultured with 5077EGFRvIII+ cells (left panel), 5077IL13Rα2+ cells (middle panel) and D270 cells (right panel), analyzed at different effector/target (E:T) ratios (0.625:1, 1.25:1, 2.5:1, 5:1, 10:1, and 20:1) and compared with the UTD T cell group. Statistically significant differences were calculated by one-way ANOVA with post hoc Tukey test. ns, not significant; ∗p < 0.05, ∗∗p < 0.01, ∗∗∗p < 0.001, ∗∗∗∗p < 0.0001. Data are presented as means ± standard deviation.
Figure 8
Figure 8
BiTE transduced T cells significantly delay early tumor growth in a GBM implanted mouse model (A) There were 800,000 Hu08CAR- and 806BiTE-Hu08CAR-positive T cells or the same number of UTD T cells that were injected intravenously (n = 8) 8 days after D270 subcutaneous implantation. (B) There were 1,200,000 bivalent targeting construct-transduced T cells (806CAR-Hu08CAR, 806BiTE-Hu08CAR, Hu08BiTE-806CAR, and 806BiTE-Hu08BiTE) or the same number of UTD T cells that were injected intravenously (n = 8) 8 days after D270 subcutaneous implantation. Tumor size was compared between each group. Statistically significant differences of tumor size at each time point were calculated by one-way ANOVA with the post hoc Tukey test. Linear regression was used to test for significant differences between the experimental groups. Survival based on time to end point was plotted using a Kaplan-Meier curve (Prism software). Statistically significant differences were determined using log rank test. ns, not significant; ∗p < 0.05, ∗∗p < 0.01, ∗∗∗p < 0.001, ∗∗∗∗p < 0.0001. Data are presented as means ± standard deviation.

References

    1. Rafiq S., Hackett C.S., Brentjens R.J. Engineering strategies to overcome the current roadblocks in CAR T cell therapy. Nat. Rev. Clin. Oncol. 2020;17:147–167. doi: 10.1038/s41571-019-0297-y. - DOI - PMC - PubMed
    1. Maude S.L., Frey N., Shaw P.A., Aplenc R., Barrett D.M., Bunin N.J., Chew A., Gonzalez V.E., Zheng Z., Lacey S.F., et al. Chimeric antigen receptor T cells for sustained remissions in leukemia. N. Engl. J. Med. 2014;371:1507–1517. doi: 10.1056/NEJMoa1407222. - DOI - PMC - PubMed
    1. Schuster S.J., Svoboda J., Chong E.A., Nasta S.D., Mato A.R., Anak O., Brogdon J.L., Pruteanu-Malinici I., Bhoj V., Landsburg D., et al. Chimeric antigen receptor T cells in refractory B-cell lymphomas. N. Engl. J. Med. 2017;377:2545–2554. doi: 10.1056/NEJMoa1708566. - DOI - PMC - PubMed
    1. Chong E.A., Ruella M., Schuster S.J., Lymphoma Program Investigators at the University of, Pennsylvania Five-year outcomes for refractory B-cell lymphomas with CAR T-cell therapy. N. Engl. J. Med. 2021;384:673–674. doi: 10.1056/NEJMc2030164. - DOI - PubMed
    1. Raje N., Berdeja J., Lin Y., Siegel D., Jagannath S., Madduri D., Liedtke M., Rosenblatt J., Maus M.V., Turka A., et al. Anti-BCMA CAR T-cell therapy bb2121 in relapsed or refractory multiple myeloma. N. Engl. J. Med. 2019;380:1726–1737. doi: 10.1056/NEJMoa1817226. - DOI - PMC - PubMed

Publication types

Substances