. 2022 Oct;77(10):2961-2973.
doi: 10.1111/all.15375. Epub 2022 May 30.

Nontypeable Haemophilus influenzae infection of pulmonary macrophages drives neutrophilic inflammation in severe asthma

Affiliations

Nontypeable Haemophilus influenzae infection of pulmonary macrophages drives neutrophilic inflammation in severe asthma

Jodie Ackland et al. Allergy. 2022 Oct.

Abstract

Background: Nontypeable Haemophilus influenzae (NTHi) is a respiratory tract pathobiont that chronically colonizes the airways of asthma patients and is associated with severe, neutrophilic disease phenotypes. The mechanism of NTHi airway persistence is not well understood, but accumulating evidence suggests NTHi can persist within host airway immune cells such as macrophages. We hypothesized that NTHi infection of pulmonary macrophages drives neutrophilic inflammation in severe asthma.

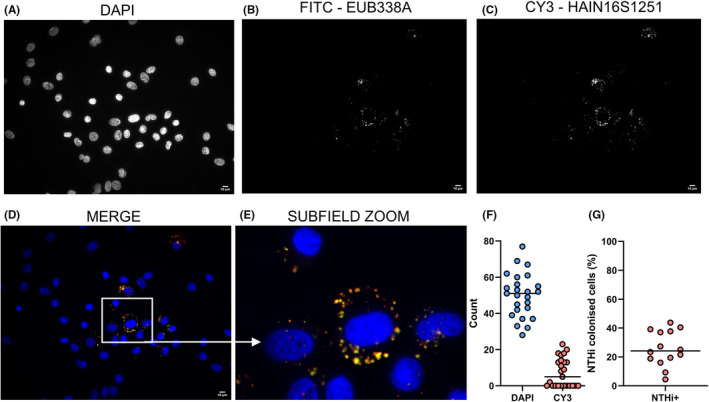
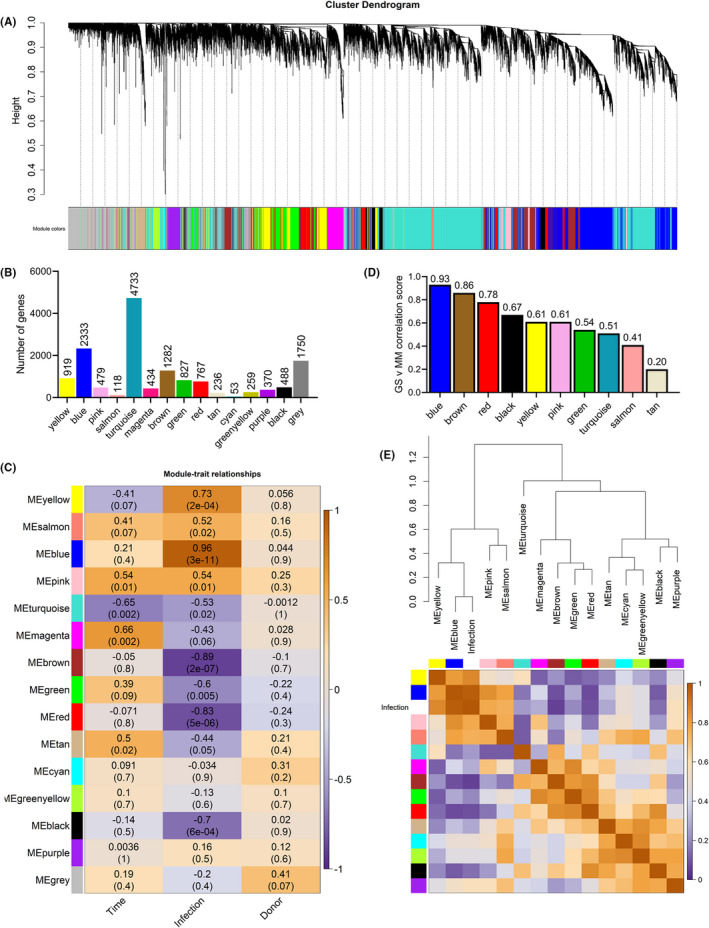
Methods: Bronchoalveolar lavage (BAL) samples from 25 severe asthma patients were assessed by fluorescence in situ hybridisation to quantify NTHi presence. Weighted gene correlation network analysis (WGCNA) was performed on RNASeq data from NTHi-infected monocyte-derived macrophages to identify transcriptomic networks associated with NTHi infection.

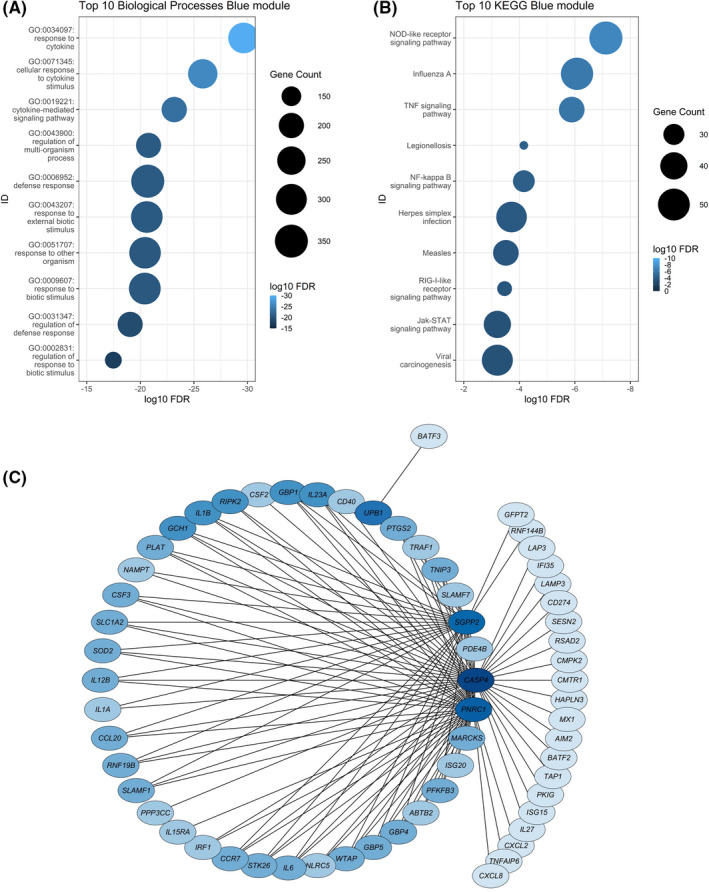
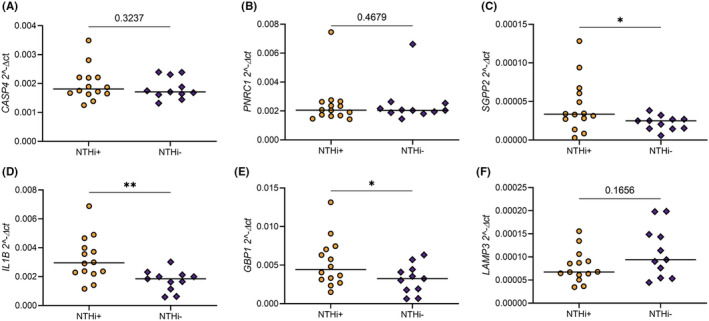
Results: NTHi was detected in 56% of BAL samples (NTHi+) and was associated with longer asthma duration (34 vs 22.5 years, p = .0436) and higher sputum neutrophil proportion (67% vs 25%, p = .0462). WGCNA identified a transcriptomic network of immune-related macrophage genes significantly associated with NTHi infection, including upregulation of T17 inflammatory mediators and neutrophil chemoattractants IL1B, IL8, IL23 and CCL20 (all p < .05). Macrophage network genes SGPP2 (p = .0221), IL1B (p = .0014) and GBP1 (p = .0477) were more highly expressed in NTHi+ BAL and moderately correlated with asthma duration (IL1B; rho = 0.41, p = .041) and lower prebronchodilator FEV1/FVC% (GBP1; rho = -0.43, p = .046 and IL1B; rho = -0.42, p = .055).

Conclusions: NTHi persistence with pulmonary macrophages may contribute to chronic airway inflammation and T17 responses in severe asthma, which can lead to decreased lung function and reduced steroid responsiveness. Identifying therapeutic strategies to reduce the burden of NTHi in asthma could improve patient outcomes.

Keywords: NTHi; T17 responses; asthma; inflammation; macrophage; neutrophil.


Conflict of interest statement

DC reports that he was a postdoctoral researcher on projects funded by Pfizer and GSK between April 2014 and October 2017. RJK received a nonpromotional grant (£35,000) from Novartis to assist in funding initial database support for the WATCH study. PH reports that he is an employee of GSK. TW reports grants and personal fees from AstraZeneca, personal fees and others from MMH, grants and personal fees from GSK, personal fees from BI, and grants and personal fees from Synairgen, outside the submitted work. KS reports grants from AstraZeneca, outside the submitted work. The remaining authors declare that the research was conducted in the absence of any commercial or financial relationships that could be construed as a potential conflict of interest.

Figures

FIGURE 1
FIGURE 1
Detection of NTHi colonization of asthmatic BAL cells by FISH. Images show representative cytospin slide of severe asthma BAL cells colonized with NTHi. Slides were stained with (A) DAPI, (B) a pan‐bacteria FITC probe (EUB338A) and (C) an NTHi‐specific CY3 probe (HAIN16S1251). (D) Merged color composite of all three fluorescent channels. (E) Enlarged subfield view of (D), indicated by the white arrow. Images were acquired using a ×40 magnification immersion oil objective. Scale bar shows 10 μm. (F) Quantification of NTHi colonization of asthmatic BAL cells for all 25 patients within the study cohort. The total DAPI (host cell nucleus) and CY3 (NTHi) signal detected in 25 asthma BAL cytospins were quantified in Image J. Each individual dot indicates the total DAPI count and CY3 count for each patient cytospin. (G) The percentage of host cells colonized with NTHi per field of view for each cytospin slide was determined by the number of CY3 counts over the DAPI count for each individual patient. The median percentage of colonized cells per field of view was 24.2%. Only samples that returned a CY3 count >1, indicating NTHi presence, were included. Line on graphs indicates median
FIGURE 2
FIGURE 2
Construction of macrophage transcriptomic gene network using WGCNA identifies significant modules associated with NTHi infection. (A) Clustering dendrogram of all 15,048 genes with dissimilarity based on topological overlap with assigned module colors below. The gray module was categorized as the ‘bin’ module containing genes not assigned to any module. (B) Bar plot depicting the number of genes assigned to each module. (C) Association between modules and sample trait data. Each row corresponds to a module eigengene and each column to a trait. Each cell contains the correlation score (top) and p‐value (bottom) assigned to each relationship. (D) Module membership (MM) and gene significance (GS) correlation scores for infection. The correlation score for each module is present above each bar, and modules are ordered based on significance (most significant to least significant, left to right) for the correlation (all p < .05). (E) Visualization of the eigengene network as a dendrogram and heatmap showing the relationships between individual modules and the NTHi infection. Four distinct clusters of modules were visible in the dendrogram; cluster I (yellow, blue, pink and salmon), cluster II (turquoise), cluster III (magenta, brown, green and red) and cluster IV (tan, cyan, greenyellow, black and purple). Each row and column in the heatmap corresponds to one module eigengene (labeled by color) or NTHi infection. In the heatmap, purple color represents low adjacency, while orange represents high adjacency
FIGURE 3
FIGURE 3
Blue module gene expression profile and gene ontology analysis indicates the enrichment of macrophage immune processes in response to intracellular NTHi. (A) Enrichment of biological processes indicates activation of MDM immune responses in response to NTHi, with (B) KEGG pathway analysis indicating enrichment of immune responses involved in the response to an intracellular pathogen. Pathway/category IDs are ordered by enrichment significance (FDR), which is indicated by the color of each dot, with the size of the dot representing the number of genes assigned to each pathway/category. (C) To identify the top connected genes within this blue module, visualization of the blue module network was generated in Cytoscape using a topological overlap threshold of 0.34. Gene ranking performed by Maximal Clique Centrality (MCC) using the cytoHubba plugin in Cytoscape. Nodes are colored blue, with darker shades indicating high network importance, lighter shades indicate decreasing network importance and solid lines show connecting edges/interactions between nodes
FIGURE 4
FIGURE 4
Expression of macrophage genes was detectable in BAL from severe asthma. The expression of six MDM genes identified in the blue module network deemed to be significantly associated with NTHi infection were investigated in BAL samples by qPCR. Patients were split into NTHi+ or NTHi‐ groups based on the outcome of the FISH analysis identifying NTHi presence in matched BAL cell cytospins. The top three ranked genes, (A) CASP4, (B) PNRC1 and (C) SGPP2, and three other genes present in the blue module network and associated with an intracellular immune response, (D) IL1B, (E) GBP1 and (F) LAMP3, were measured. Gene expression was normalized to B2M. Graphs show medians, n = 25. Data were analyzed by the Mann–Whitney U test, *p < .05, **p < .01
FIGURE 5
FIGURE 5
Correlation of expression of genes from the blue module network with asthma clinical characteristics in severe asthma BAL samples Spearman's correlation was used to determine correlations between the level of gene expression and patient characteristics or demographics. Larger sized dots indicate more significant correlations, with the correlation coefficient (rho) represented by the colored bar (right), with blue representing positive correlations and red representing negative correlations

Similar articles

Cited by

References

    1. Jackson DJ, Sykes A, Mallia P, Johnston SL. Asthma exacerbations: origin, effect, and prevention. J Allergy Clin Immunol. 2011;128:1165‐1174. - PMC - PubMed
    1. Lambrecht BN, Hammad H. The immunology of asthma. Nat Immunol. 2015;16:45‐56. - PubMed
    1. Pembrey L, Barreto ML, Douwes J, et al. Understanding asthma phenotypes: the world asthma phenotypes (WASP) international collaboration. ERJ Open Res. 2018;4:00013‐02018. - PMC - PubMed
    1. Ishmael FT. The inflammatory response in the pathogenesis of asthma. J Am Osteopath Assoc. 2011;111:S11‐S17. - PubMed
    1. Deckers J, Branco Madeira F, Hammad H. Innate immune cells in asthma. Trends Immunol. 2013;34:540‐547. - PubMed

Publication types