. 2022 May 16;82(10):1953-1968.
doi: 10.1158/0008-5472.CAN-21-0933.

Liver Colonization by Colorectal Cancer Metastases Requires YAP-Controlled Plasticity at the Micrometastatic Stage

Affiliations

Liver Colonization by Colorectal Cancer Metastases Requires YAP-Controlled Plasticity at the Micrometastatic Stage

Maria C Heinz et al. Cancer Res. .

Abstract

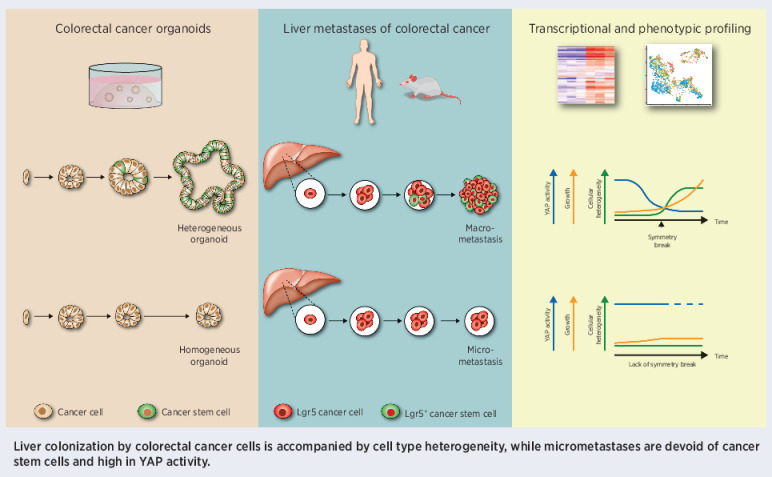
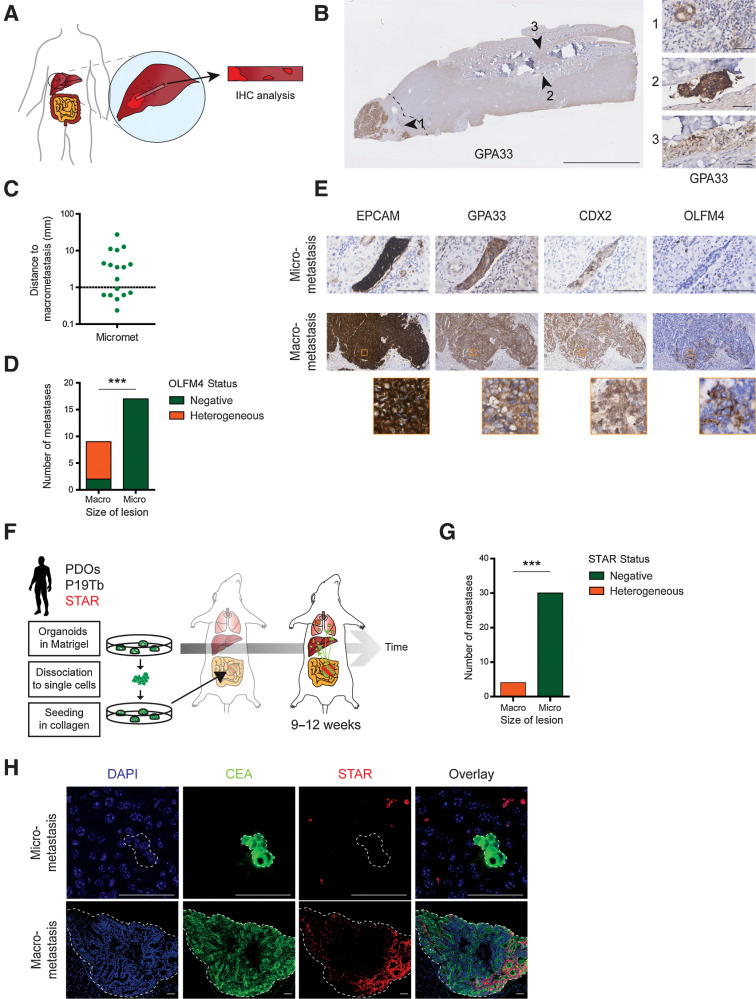
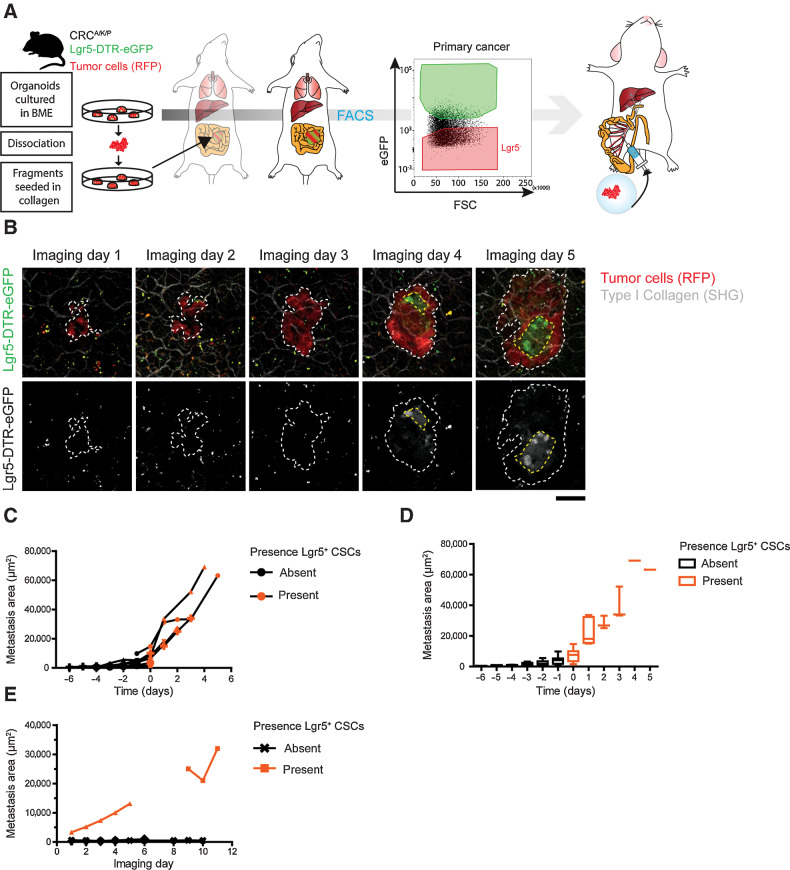
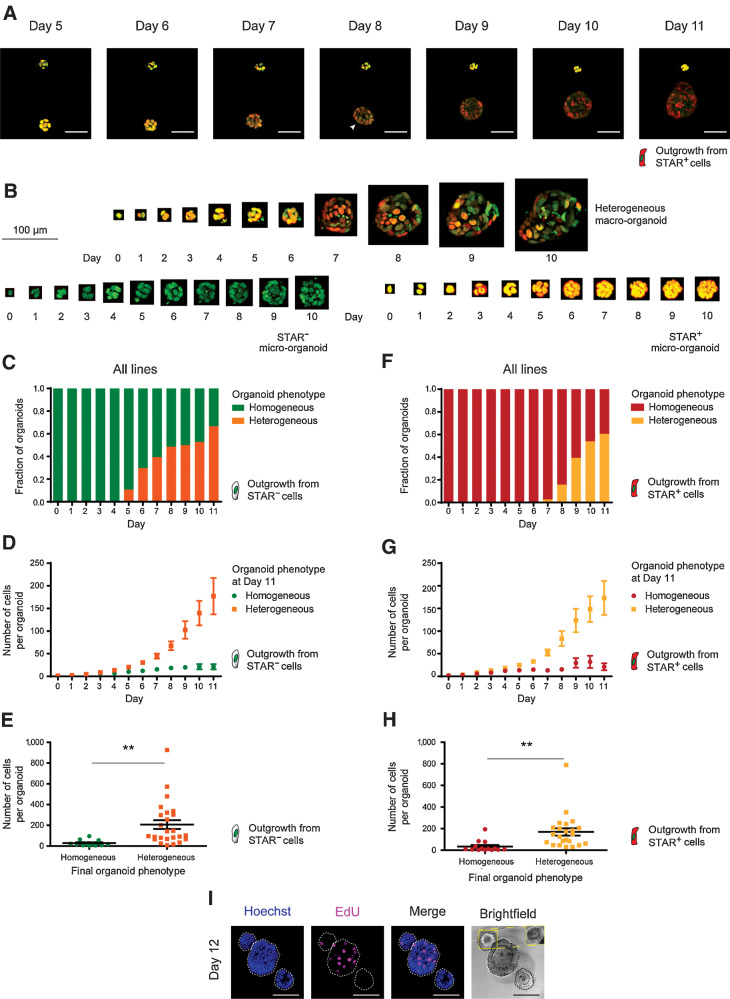
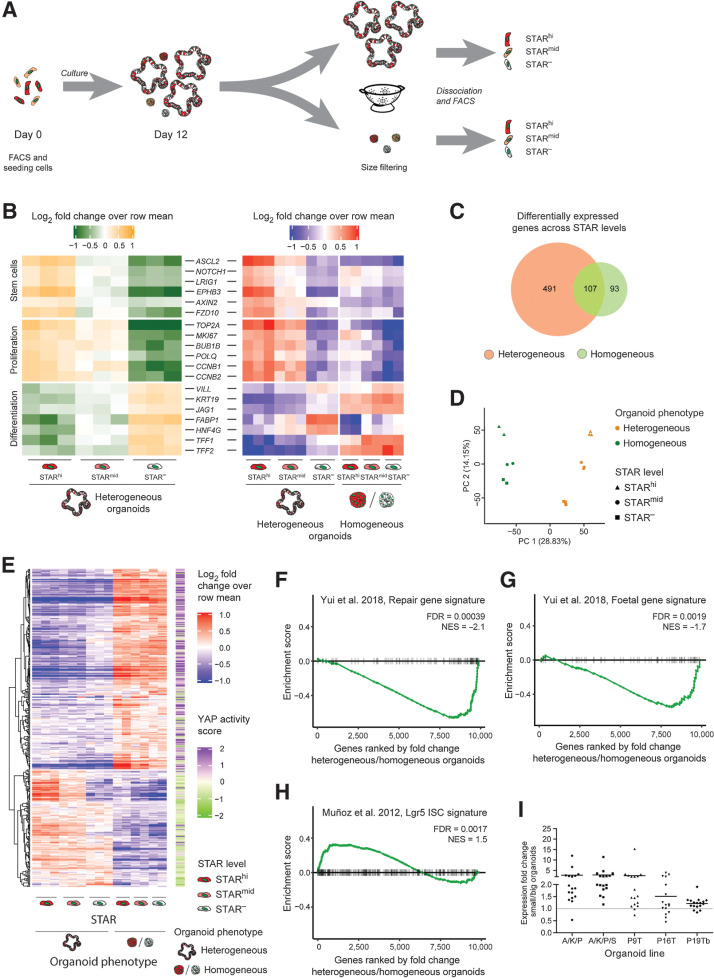
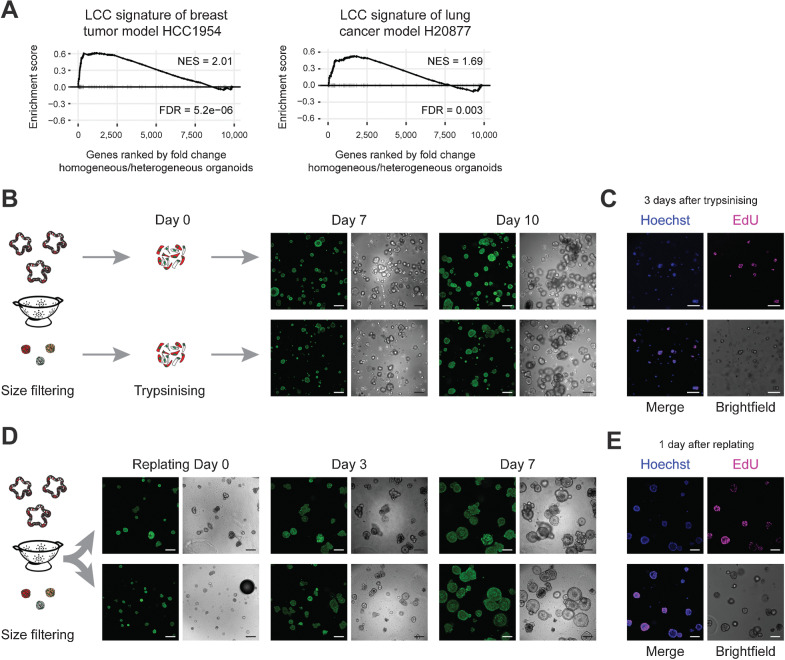
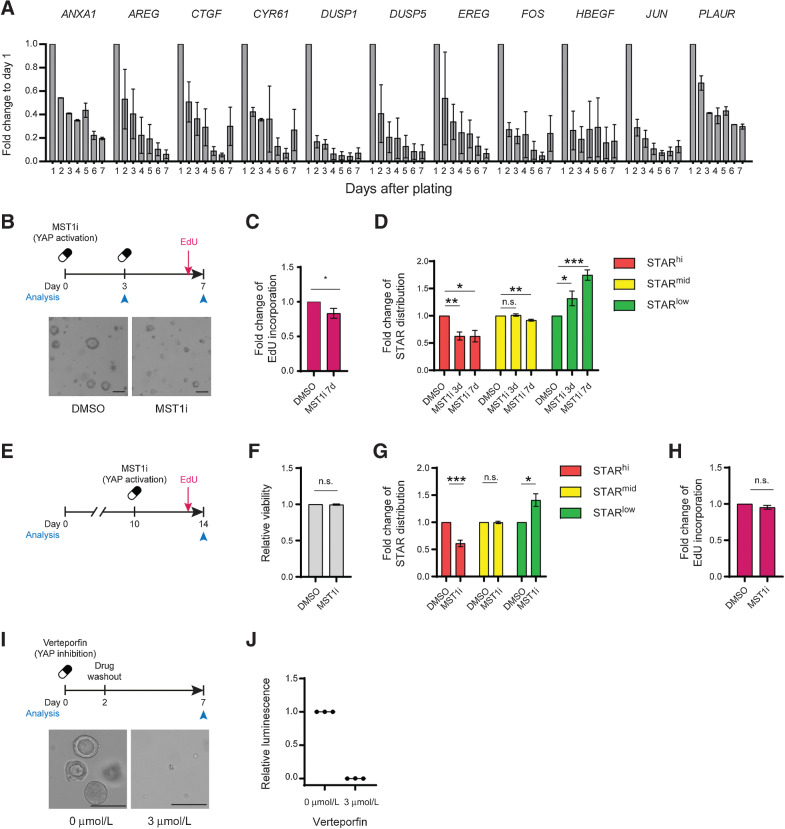
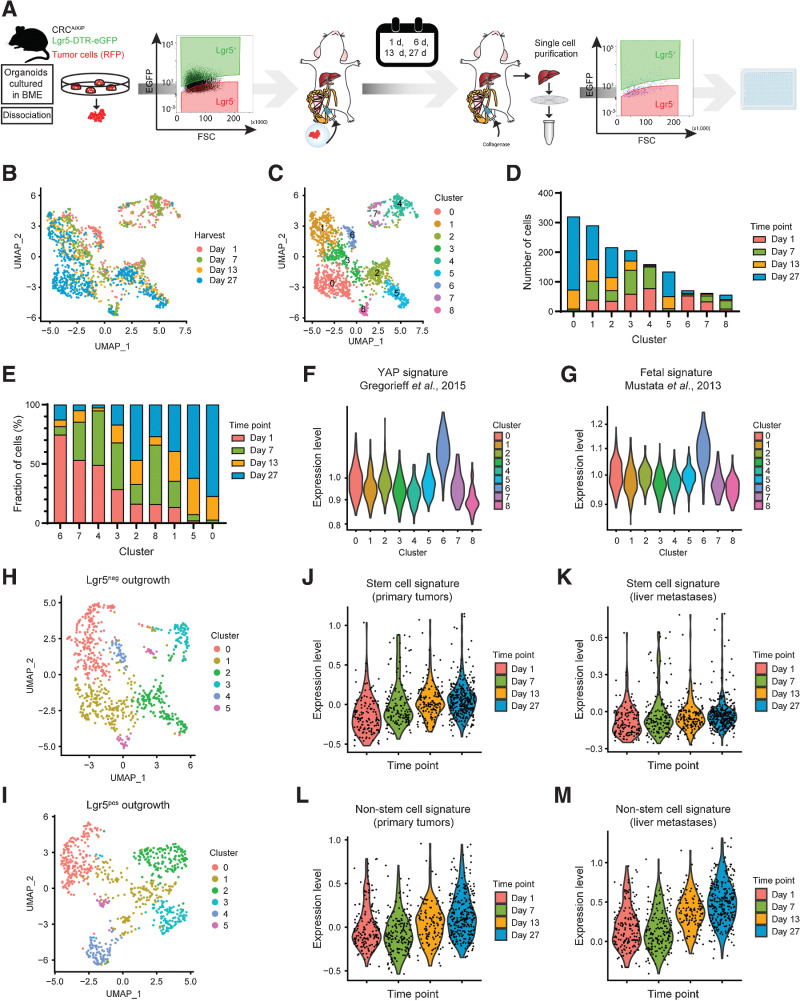
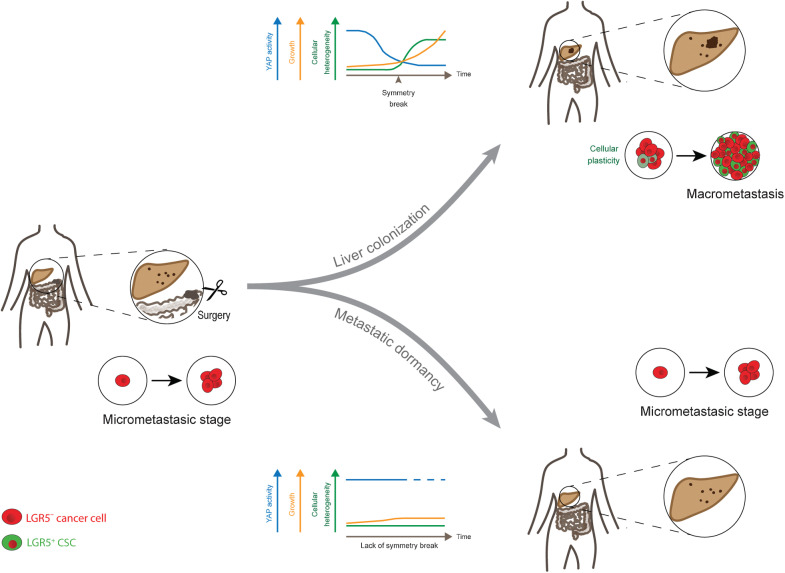
Micrometastases of colorectal cancer can remain dormant for years prior to the formation of actively growing, clinically detectable lesions (i.e., colonization). A better understanding of this step in the metastatic cascade could help improve metastasis prevention and treatment. Here we analyzed liver specimens of patients with colorectal cancer and monitored real-time metastasis formation in mouse livers using intravital microscopy to reveal that micrometastatic lesions are devoid of cancer stem cells (CSC). However, lesions that grow into overt metastases demonstrated appearance of de novo CSCs through cellular plasticity at a multicellular stage. Clonal outgrowth of patient-derived colorectal cancer organoids phenocopied the cellular and transcriptomic changes observed during in vivo metastasis formation. First, formation of mature CSCs occurred at a multicellular stage and promoted growth. Conversely, failure of immature CSCs to generate more differentiated cells arrested growth, implying that cellular heterogeneity is required for continuous growth. Second, early-stage YAP activity was required for the survival of organoid-forming cells. However, subsequent attenuation of early-stage YAP activity was essential to allow for the formation of cell type heterogeneity, while persistent YAP signaling locked micro-organoids in a cellularly homogenous and growth-stalled state. Analysis of metastasis formation in mouse livers using single-cell RNA sequencing confirmed the transient presence of early-stage YAP activity, followed by emergence of CSC and non-CSC phenotypes, irrespective of the initial phenotype of the metastatic cell of origin. Thus, establishment of cellular heterogeneity after an initial YAP-controlled outgrowth phase marks the transition to continuously growing macrometastases.

Significance: Characterization of the cell type dynamics, composition, and transcriptome of early colorectal cancer liver metastases reveals that failure to establish cellular heterogeneity through YAP-controlled epithelial self-organization prohibits the outgrowth of micrometastases. See related commentary by LeBleu, p. 1870.


Figures

None
Graphical abstract
Figure 1. Liver micrometastases of human colorectal cancers (CRC) are devoid of classical SC markers. A, Graphical representation of liver tissue strips extending from macrometastases into adjacent liver tissue. B, Liver tissue strip stained for GPA33 to identify macro- and micrometastases (arrowheads). Dashed lines indicates 1 mm distance to macrometastasis. Scale bar, 5 mm (50 µm in close-ups). C, Distance of identified micrometastases to their respective macrometastasis. Each dot represents one lesion. D, Bar graph summarizing OLFM4 expression patterns in all macro- and micrometastases as either completely absent (green) or heterogeneous (orange). E, Representative IHC stainings of a macro- and micrometastasis of the same patient. Macrometastasis shows heterogeneous OLFM4 expression. Close-ups, orange boxes. Scale bars, 100 µm. F, Experimental setup for spontaneous metastasis formation in mice using orthotopic transplantation of human CRC PDOs with analysis after 9–12 weeks. G, Bar graph depicting the presence of STAR+ CSCs in liver macro- or micrometastases, identified and classified (size) through IHC against human CEA. H, Representative images related to G. STAR minigene is unique to xenotransplanted cancer line. Signal outside CEA-marked metastasis is background. Scale bars, 50 µm.
Figure 1.
Liver micrometastases of human colorectal cancers are devoid of classical SC markers. A, Graphical representation of liver tissue strips extending from macrometastases into adjacent liver tissue. B, Liver tissue strip stained for GPA33 to identify macro- and micrometastases (arrowheads). Dashed line, 1 mm distance to macrometastasis. Scale bar, 5 mm (50 µm in close-ups). C, Distance of identified micrometastases to their respective macrometastasis. Each dot represents one lesion. D, Bar graph summarizing OLFM4 expression patterns in all macro- and micrometastases as either completely absent (green) or heterogeneous (orange). E, Representative IHC stainings of a macro- and micrometastasis of the same patient. Macrometastasis shows heterogeneous OLFM4 expression. Close-ups, orange boxes. Scale bars, 100 µm. F, Experimental setup for spontaneous metastasis formation in mice using orthotopic transplantation of human colorectal cancer PDOs with analysis after 9–12 weeks. G, Bar graph depicting the presence of STAR+ CSCs in liver macro- or micrometastases, identified and classified (size) through IHC against human CEA. H, Representative images related to G. STAR minigene is unique to xenotransplanted cancer line. Signal outside CEA-marked metastasis is background. Scale bars, 50 µm. ***, P < 0.001.
Figure 2. Lgr5+ CSCs appear at micrometastatic stages and mark the transition toward successful metastatic colonization. A, Experimental setup for timed metastasis formation assay in mice: RFP+ murine ApcFL/FL/KrasG12D/+/Tp53KO/KO cancer organoids were orthotopically transplanted into mice to form primary cancers. After 8–10 weeks, Lgr5– primary tumor cells were collected by FACS and injected into the mesenteric vein of recipient mice. Growth kinetics and cellular dynamics of growing liver metastases were monitored by IVM. Stem cells are labeled by endogenous Lgr5-DTR-eGFP expression. B, Representative IVM images of one liver metastasis taken on consecutive days. Top: RFP+ tumor cells (red) visualizing tumor mass, Lgr5-DTR-eGFP expression (green) marking CSCs. Bottom, identical panels in false colors. Dashed line, metastasis border. Scale bar, 50 µm. C, Traces depicting the size of individual metastatic lesions that develop cellular heterogeneity over time. Day 0, time of de novo appearance of Lgr5+ CSCs. Black and orange symbols refer to time points prior to and post symmetry break, respectively. D, As in C, with the mean metastasis size of all lesions represented by a box plot. Whiskers representing min to max. E, Traces showing the size of individual metastatic lesions over time with no symmetry break event during the course of imaging. Lesion without Lgr5+ SCs (black), lesions with Lgr5 expression before start of IVM (orange).
Figure 2.
Lgr5+ CSCs appear at micrometastatic stages and mark the transition toward successful metastatic colonization. A, Experimental setup for timed metastasis formation assay in mice. RFP+ murine ApcFL/FL/KrasG12D/+/Tp53KO/KO cancer organoids were orthotopically transplanted into mice to form primary cancers. After 8 to 10 weeks, Lgr5 primary tumor cells were collected by FACS and injected into the mesenteric vein of recipient mice. Growth kinetics and cellular dynamics of growing liver metastases were monitored by IVM. Stem cells are labeled by endogenous Lgr5-DTR-eGFP expression. B, Representative IVM images of one liver metastasis taken on consecutive days. Top, RFP+ tumor cells (red) visualizing tumor mass and Lgr5-DTR-eGFP expression (green) marking CSCs. Bottom, identical panels in false colors. Dashed line, metastasis border. Scale bar, 50 µm. C, Traces depicting the size of individual metastatic lesions that develop cellular heterogeneity over time. Day 0, time of de novo appearance of Lgr5+ CSCs. Black and orange symbols refer to time points prior to and post symmetry break, respectively. D, As in C, with the mean metastasis size of all lesions represented by a box plot. Whiskers represent minimum to maximum. E, Traces showing the size of individual metastatic lesions over time with no symmetry break event during the course of imaging. Lesion without Lgr5+ SCs (black), lesions with Lgr5 expression before start of IVM (orange).
Figure 3. CRC organoids phenocopy the cellular dynamics during metastatic outgrowth. A, Stills from live-cell recordings of A/K/P/S–mutant organoid formation (day 5 to 11) from single nuclear STAR+ cells (red). Top, organoid fails to establish heterogeneity and stagnates in growth. Bottom, organoid develops cellular heterogeneity indicated by varying STAR levels and continues to grow. Nuclei are marked with a chromatin tag (green). Color hues are red/green overlaid (resulting in yellow to dark orange). Arrowhead, symmetry break. Scale bars, 50 µm. B, 3D-rendered pictures of single cells growing into either a heterogeneous organoid (top) or into homogeneous STAR− (bottom left) or STAR+ (bottom right) micro-organoids. Nuclei (green), STAR (nuclear, red), overlay (yellow). Scale bar, 100 µm. C–H, Pooled data of four human colorectal cancer organoid lines: Engineered APCKO/KO/KRASG12D/–/TP53KO/KO (A/K/P), APCKO/KO/KRASG12D/–/TP53KO/KO/SMADKO/KO (A/K/P/S), PDO P16T, and PDO P19bT. Data are stratified by STAR identity at the time of plating. (C–E/F–H) Outgrowth of STAR−/STAR+ cells with homogeneously STAR− (green)/STAR+ (red) organoids and heterogeneous organoids (orange/yellow). C and F, Graph representing the fraction of organoid phenotypes per indicated time point during the outgrowth of STAR–/STAR+ CRC cells. D and G, Graph representing the size (mean cell number + SEM) of developing organoids from single STAR–/STAR+ cells, stratified by final phenotype. E and H, Organoid size per final phenotype for the outgrowth of single STAR–/STAR+ cells. Two-tailed Student t test (P value 0.0070/0.0045) indicates significant difference. I, Three 12-day-old organoids with EdU incorporation (pink) to label proliferative cells. Counterstain Hoechst 33342 (blue). Selection (yellow) shows optimal bright-field cross-section. Scale bars, 100 µm.
Figure 3.
Colorectal cancer organoids phenocopy the cellular dynamics during metastatic outgrowth. A, Stills from live-cell recordings of A/K/P/S–mutant organoid formation (day 5 to 11) from single nuclear STAR+ cells (red). Top, organoid fails to establish heterogeneity and stagnates in growth. Bottom, organoid develops cellular heterogeneity, indicated by varying STAR levels and continues to grow. Nuclei are marked with a chromatin tag (green). Color hues are red/green overlaid (resulting in yellow to dark orange). Arrowhead, symmetry break. Scale bars, 50 µm. B, 3D-rendered pictures of single cells growing into either a heterogeneous organoid (top) or into homogeneous STAR (bottom left) or STAR+ (bottom right) micro-organoids. Nuclei (green), STAR (nuclear, red), overlay (yellow). Scale bar, 100 µm. C–H, Pooled data of four human colorectal cancer organoid lines. Engineered APCKO/KO/KRASG12D/–/TP53KO/KO (A/K/P), APCKO/KO/KRASG12D/–/TP53KO/KO/SMADKO/KO (A/K/P/S), PDO P16T, and PDO P19bT. Data are stratified by STAR identity at the time of plating. Outgrowth of STAR/STAR+ cells with homogeneously STAR (green)/STAR+ (red) organoids and heterogeneous organoids (orange/yellow). C and F, Graph representing the fraction of organoid phenotypes per indicated time point during the outgrowth of STAR/STAR+ colorectal cancer cells. D and G, Graph representing the size (mean cell number + SEM) of developing organoids from single STAR/STAR+ cells, stratified by final phenotype. E and H, Organoid size per final phenotype for the outgrowth of single STAR/STAR+ cells. Two-tailed Student t test (P value, 0.0070/0.0045) indicates significant difference. I, Three 12-day-old organoids with EdU incorporation (pink) to label proliferative cells. Blue, counterstain Hoechst 33342. Inset (yellow) shows optimal brightfield cross-section. Scale bars, 100 µm. **, P < 0.01.
Figure 4. Growth restricted micro-organoids are in a YAP state. A, Experimental setup: single STAR+ cells were cultured for 12 days. Organoids were size separated and STAR-hi, STARmid, and STAR− cells were collected by FACS for each organoid subfraction for prospective expression analysis. B, Heatmap representing expression levels of intestinal markers for SCs, proliferation, and differentiation (log2 fold change over row mean). Left, relative expression per STAR population of only heterogeneous organoids. Right, both organoid types. C, Venn diagram depicting the number of differentially expressed genes across STAR populations (FDR < 0.01 in at least one comparison) in heterogeneous (orange) and homogeneous (green) organoids. D, Principal component analysis of the expression patterns across STAR populations and organoid phenotypes. E, Heatmap showing all 369 differentially expressed genes between small (homogeneous) and large (heterogeneous) organoids (fold change > 1.5, FDR < 0.05) for which the assigned YAP score (right side) represents at least a 10% change (YAP score < 0.9 (green) or > 1.1 (purple), score from ref. 28. F–H, GSEA demonstrating the similarity of (homogeneous) micro-organoids to the regenerative state of mouse intestine (ref. 30; F), the fetal state of mouse intestine (ref. 30; G) or of large (heterogeneous) organoids to intestinal SCs (ref. 29; H). I, Expression pattern (by qPCR) of 17 micro-organoid–associated genes across five lines. Horizontal bar per line, mean fold change of all genes. Individual values depicted in Supplementary Fig. S5A.
Figure 4.
Growth restricted micro-organoids are in a YAP state. A, Experimental setup. Single STAR+ cells were cultured for 12 days. Organoids were size separated and STARhi, STARmid, and STAR cells were collected by FACS for each organoid subfraction for prospective expression analysis. B, Heatmap representing expression levels of intestinal markers for SCs, proliferation, and differentiation (log2-fold change over row mean). Left, relative expression per STAR population of only heterogeneous organoids. Right, both organoid types. C, Venn diagram depicting the number of differentially expressed genes across STAR populations (FDR < 0.01 in at least one comparison) in heterogeneous (orange) and homogeneous (green) organoids. D, Principal component analysis of the expression patterns across STAR populations and organoid phenotypes. E, Heatmap showing all 369 differentially expressed genes between small (homogeneous) and large (heterogeneous) organoids (fold change > 1.5, FDR < 0.05), for which, the assigned YAP score (right side) represents at least a 10% change (YAP score < 0.9 (green) or > 1.1 (purple); score from ref. . F–H, GSEA demonstrating the similarity of (homogeneous) micro-organoids to the regenerative state of mouse intestine (ref. ; F), the fetal state of mouse intestine (ref. ; G), or of large (heterogeneous) organoids to intestinal SCs (ref. ; H). I, Expression pattern (by qPCR) of 17 micro-organoid–associated genes across five lines. Horizontal bar per line, mean fold change of all genes. Individual values depicted in Supplementary Fig. S5A.
Figure 5. Micro-organoids are in a pseudo-stable state and resemble dormant micrometastases. A, GSEA demonstrating similarity of micro-organoids to alternative models of metastatic dormancy (ref. 13; breast tumor line HCC1954 and lung adenocarcinoma line H20877). B, Outgrowth potential of single cells derived from micro- or macro-organoids (A/K/P/S) isolated after 12 days of culturing. H2B (green). Scale bars, 200 µm. C, EdU incorporation (pink) indicates proliferating cells 3 days after plating single cells derived from micro-organoids. Counterstain Hoechst 33342 (blue). Scale bars, 100 µm. D, Growth potential of 12-day-old micro- and macro-organoids (A/K/P/S) upon isolation and replating as intact structures. H2B (green). Scale bars, 200 µm. E, EdU incorporation (pink) indicates regained proliferative activity of micro-organoids 1 day after replating. Counterstain Hoechst 33342 (blue). Scale bars, 100 µm.
Figure 5.
Micro-organoids are in a pseudo-stable state and resemble dormant micrometastases. A, GSEA demonstrating similarity of micro-organoids to alternative models of metastatic dormancy (breast tumor line HCC1954 and lung adenocarcinoma line H20877; ref. 13). B, Outgrowth potential of single cells derived from micro- or macro-organoids (A/K/P/S) isolated after 12 days of culturing. Green, H2B. Scale bars, 200 µm. C, EdU incorporation (pink) indicates proliferating cells 3 days after plating single cells derived from micro-organoids. Blue, counterstain Hoechst 33342. Scale bars, 100 µm. D, Growth potential of 12-day-old micro- and macro-organoids (A/K/P/S) upon isolation and replating as intact structures. Green, H2B. Scale bars, 200 µm. E, EdU incorporation (pink) indicates regained proliferative activity of micro-organoids 1 day after replating. Blue, counterstain Hoechst 33342. Scale bars, 100 µm.
Figure 6. Dynamic Yap activity is required for the outgrowth of colorectal cancer (CRC) organoids. A, Diminishing expression of micro-organoid associated genes during the first 7 days of A/K/P/S organoid outgrowth. Gene expression, represented as mean + SEM, is normalized to day 1. B–D, Single A/K/P/S cells treated with 500 nmol/L XMU-MP-1 (MST1/2 inhibitor) for 3 or 7 days. B, Schematic of experimental setup (top) and representative organoid overview after 7 days of culture (bottom). Scale bars, 100 µm. C, Relative fraction of EdU-incorporating cells. D, Flow analysis of STAR levels. C and D, Data is normalized to DMSO control. E–H, 10-day-old A/K/P/S organoids were treated with 500 nmol/L XMU-MP-1 and analyzed after 96 hours by flow cytometry. E, Experimental setup. F, Relative viability assessed by DAPI. G, Relative change in STAR populations. H, Relative fraction of EdU-incorporating cells. F–H, Data are normalized to their respective DMSO control. I–J, 3 µmol/L verteporfin was added to single A/K/P/S cells for 48 hours prior to wash out. Organoids were analyzed after 7 days. I, Schematic of experimental setup (top) and representative organoid overview after 7 days of culture (bottom). Scale bars, 100 µm. J, Relative viability as assessed by CellTiter-Glo. Data are normalized to DMSO control.
Figure 6.
Dynamic Yap activity is required for the outgrowth of colorectal cancer organoids. A, Diminishing expression of micro-organoid–associated genes during the first 7 days of A/K/P/S organoid outgrowth. Gene expression, represented as mean + SEM, is normalized to day 1. B–D, Single A/K/P/S cells treated with 500 nmol/L XMU-MP-1 (MST1/2 inhibitor) for 3 or 7 days. B, Schematic of experimental setup (top) and representative organoid overview after 7 days of culture (bottom). Scale bars, 100 µm. C, Relative fraction of EdU-incorporating cells. D, Flow analysis of STAR levels. C and D, Data is normalized to DMSO control. E–H, Ten-day-old A/K/P/S organoids were treated with 500 nmol/L XMU-MP-1 and analyzed after 96 hours by flow cytometry. E, Experimental setup. F, Relative viability assessed by DAPI. G, Relative change in STAR populations. H, Relative fraction of EdU-incorporating cells. F–H, Data are normalized to their respective DMSO control. I–J, Three µmol/L verteporfin was added to single A/K/P/S cells for 48 hours prior to wash out. Organoids were analyzed after 7 days. I, Schematic of experimental setup (top) and representative organoid overview after 7 days of culture (bottom). Scale bars, 100 µm. J, Relative viability as assessed by CellTiter-Glo. Data are normalized to DMSO control. n.s., nonsignificant; *, P < 0.05; **, P < 0.01; ***, P < 0.001.
Figure 7. Mapping cellular phenotypes during in vivo formation of colorectal cancer (CRC) liver metastases. A, Experimental design of scRNA-seq analysis of metastatic cells at specific time points during in vivo liver metastasis formation initiated by either Lgr5+ or Lgr5– CRC cells. B and C, UMAP of scRNA-seq data color-coded by time of harvest (B) and clusters (C) resulting from unsupervised hierarchical clustering. D and E, Composition of clusters color-coded by time of harvest. D, Absolute number of cells. E, Relative composition of clusters ranked (in descending order) according to highest relative contribution from day 1. F and G, Expression levels of Yap-associated gene signatures by cluster for Yap overexpression (F) in murine intestine (28) and fetal intestinal organoids (ref. 33; G). H–I, UMAP after unsupervised hierarchical clustering of all Lgr5– (H) and Lgr5+ (G) injected cells. J–M, Expression levels of SC (J–K) and non-SC (L–M) gene signatures over time. Signatures are derived from primary tumors (ref. 8; J and L) and liver metastases (ref. 8; K and M). Data input: Lgr5– (J and K) and Lgr5+ (L and M) injected cells.
Figure 7.
Mapping cellular phenotypes during in vivo formation of colorectal cancer liver metastases. A, Experimental design of scRNA-seq analysis of metastatic cells at specific time points during in vivo liver metastasis formation initiated by either Lgr5+ or Lgr5 colorectal cancer cells. B and C, UMAP of scRNA-seq data color-coded by time of harvest (B) and clusters (C) resulting from unsupervised hierarchical clustering. D and E, Composition of clusters color-coded by time of harvest. D, Absolute number of cells. E, Relative composition of clusters ranked (in descending order) according to highest relative contribution from day 1. F and G, Expression levels of Yap-associated gene signatures by cluster for Yap overexpression (F) in murine intestine (28) and fetal intestinal organoids (ref. ; G). H and I, UMAP after unsupervised hierarchical clustering of all Lgr5- (H) and Lgr5+- (I) injected cells. J–M, Expression levels of SC (J and K) and non-SC (L and M) gene signatures over time. Signatures are derived from primary tumors (ref. ; J and L) and liver metastases (ref. ; K and M). Data input: Lgr5- (J and K) and Lgr5+- (L and M) injected cells.
Figure 8. Summarizing model.
Figure 8.
Summarizing model.

Comment in

  • Cancer Res. 82:1870.
  • Cancer Res. 82:1870.

References

    1. Schepers AG, Snippert HJ, Stange DE, Van Den Born M, Van Es JH, Van De Wetering M, et al. . Lineage tracing reveals Lgr5+ stem cell activity in mouse intestinal adenomas. Science 2012;337:730–5. - PubMed
    1. Humphries A, Cereser B, Gay LJ, Miller DSJ, Das B, Gutteridge A, et al. . Lineage tracing reveals multipotent stem cells maintain human adenomas and the pattern of clonal expansion in tumor evolution. Proc Natl Acad Sci U S A 2013;110:E2490–9. - PMC - PubMed
    1. Shimokawa M, Ohta Y, Nishikori S, Matano M, Takano A, Fujii M, et al. . Visualization and targeting of LGR5 + human colon cancer stem cells. Nature 2017;545:187–92. - PubMed
    1. Morral C, Stanisavljevic J, Hernando-Momblona X, Mereu E, Álvarez-Varela A, Cortina C, et al. . Zonation of ribosomal DNA transcription defines a stem cell hierarchy in colorectal cancer. Cell Stem Cell 2020;26:845–61. - PMC - PubMed
    1. De Sousa E Melo F, Kurtova AV, Harnoss JM, Kljavin N, Hoeck JD, Hung J, et al. . A distinct role for Lgr5 + stem cells in primary and metastatic colon cancer. Nature 2017;543:676–80. - PubMed

Publication types