

Increased interictal synchronicity of respiratory related brain pulsations in epilepsy
- PMID: 35570730
- PMCID: PMC9536129
- DOI: 10.1177/0271678X221099703
Increased interictal synchronicity of respiratory related brain pulsations in epilepsy
Abstract
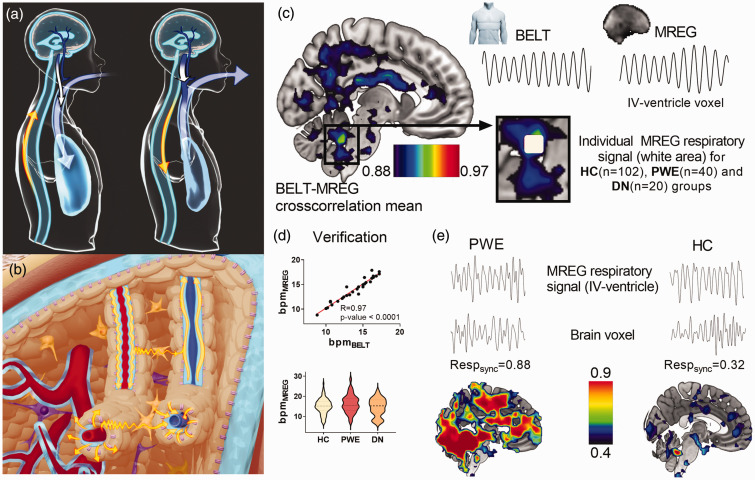
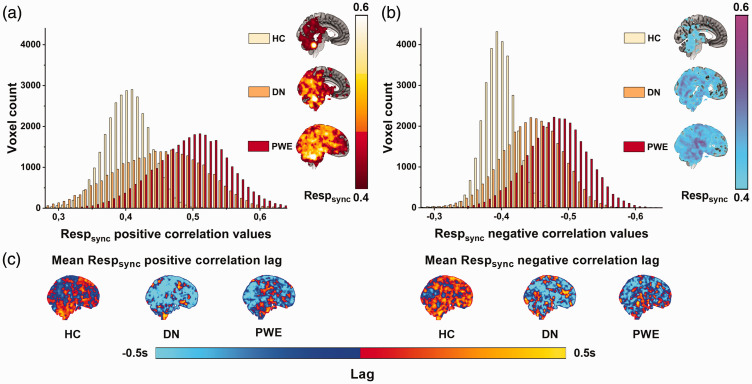
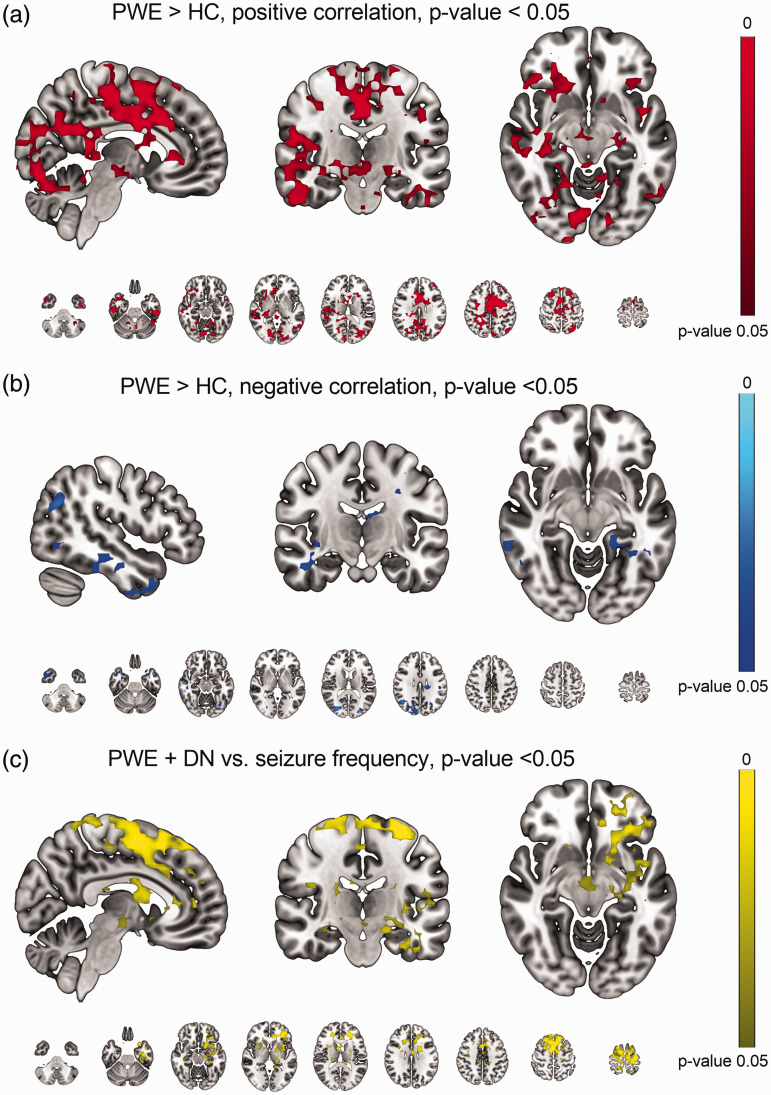
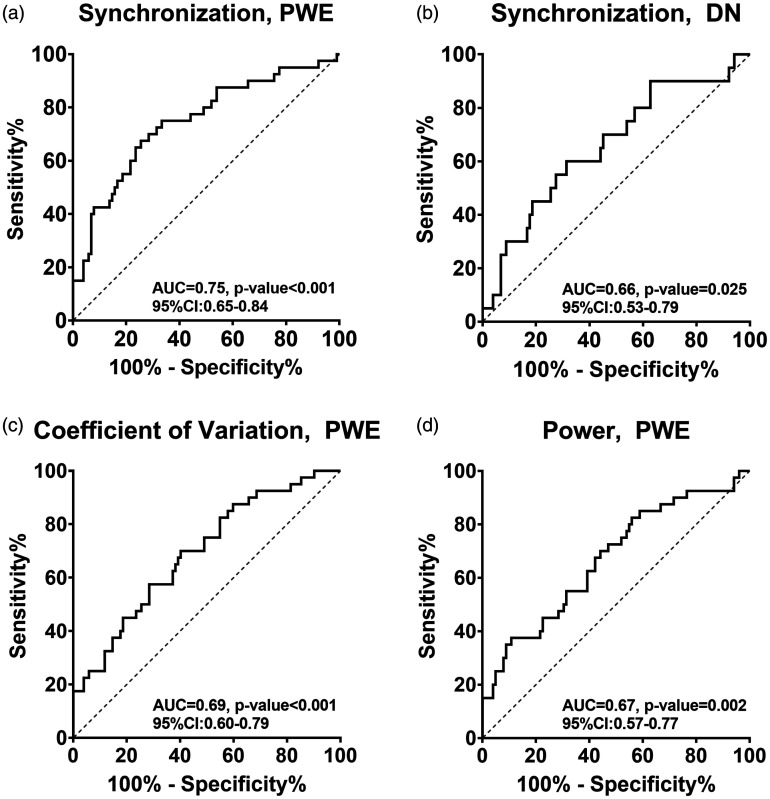
Respiratory brain pulsations have recently been shown to drive electrophysiological brain activity in patients with epilepsy. Furthermore, functional neuroimaging indicates that respiratory brain pulsations have increased variability and amplitude in patients with epilepsy compared to healthy individuals. To determine whether the respiratory drive is altered in epilepsy, we compared respiratory brain pulsation synchronicity between healthy controls and patients. Whole brain fast functional magnetic resonance imaging was performed on 40 medicated patients with focal epilepsy, 20 drug-naïve patients and 102 healthy controls. Cerebrospinal fluid associated respiratory pulsations were used to generate individual whole brain respiratory synchronization maps, which were compared between groups. Finally, we analyzed the seizure frequency effect and diagnostic accuracy of the respiratory synchronization defect in epilepsy. Respiratory brain pulsations related to the verified fourth ventricle pulsations were significantly more synchronous in patients in frontal, periventricular and mid-temporal regions, while the seizure frequency correlated positively with synchronicity. The respiratory brain synchronicity had a good diagnostic accuracy (ROCAUC = 0.75) in discriminating controls from medicated patients. The elevated respiratory brain synchronicity in focal epilepsy suggests altered physiological effect of cerebrospinal fluid pulsations possibly linked to regional brain water dynamics involved with interictal brain physiology.
Keywords: Brain physiology; brain pulsations; epilepsy; fast fMRI; respiratory synchronization.
Conflict of interest statement
Figures
Similar articles
-
Respiratory-related brain pulsations are increased in epilepsy-a two-centre functional MRI study.Brain Commun. 2020 Jun 8;2(2):fcaa076. doi: 10.1093/braincomms/fcaa076. eCollection 2020. Brain Commun. 2020. PMID: 32954328 Free PMC article.
-
Respiratory brain impulse propagation in focal epilepsy.Sci Rep. 2023 Mar 30;13(1):5222. doi: 10.1038/s41598-023-32271-7. Sci Rep. 2023. PMID: 36997658 Free PMC article.
-
Spectral entropy indicates electrophysiological and hemodynamic changes in drug-resistant epilepsy - A multimodal MREG study.Neuroimage Clin. 2019;22:101763. doi: 10.1016/j.nicl.2019.101763. Epub 2019 Mar 12. Neuroimage Clin. 2019. PMID: 30927607 Free PMC article.
-
Neuroimaging of memory in frontal lobe epilepsy.Epilepsy Behav. 2020 Feb;103(Pt A):106857. doi: 10.1016/j.yebeh.2019.106857. Epub 2020 Jan 11. Epilepsy Behav. 2020. PMID: 31937510 Review.
-
Simultaneous EEG and fMRI recordings (EEG-fMRI) in children with epilepsy.Epilepsia. 2013 Jun;54(6):971-82. doi: 10.1111/epi.12197. Epub 2013 May 3. Epilepsia. 2013. PMID: 23647021 Review.
Cited by
-
Sex-specific effects of intensity and dose of physical activity on BOLD-fMRI cerebrovascular reactivity and cerebral pulsatility.J Cereb Blood Flow Metab. 2025 Mar 13:271678X251325399. doi: 10.1177/0271678X251325399. Online ahead of print. J Cereb Blood Flow Metab. 2025. PMID: 40079560 Free PMC article.
-
Orexin effect on physiological pulsations of the human brain.Proc Natl Acad Sci U S A. 2025 Aug 5;122(31):e2501578122. doi: 10.1073/pnas.2501578122. Epub 2025 Aug 1. Proc Natl Acad Sci U S A. 2025. PMID: 40748959 Free PMC article.
-
Characterization of pulsations in the brain and cerebrospinal fluid using ultra-high field magnetic resonance imaging.Front Neurosci. 2024 May 9;18:1305939. doi: 10.3389/fnins.2024.1305939. eCollection 2024. Front Neurosci. 2024. PMID: 38784099 Free PMC article.
-
Cerebrospinal fluid flow in small-breed dogs with idiopathic epilepsy observed using time-spatial labeling inversion pulse images: a preliminary study.J Vet Med Sci. 2024 Nov 15;86(11):1168-1176. doi: 10.1292/jvms.23-0305. Epub 2024 Oct 3. J Vet Med Sci. 2024. PMID: 39358237 Free PMC article.
-
Amplitude fluctuations of cerebrovascular oscillations and CSF movement desynchronize during NREM3 sleep.J Cereb Blood Flow Metab. 2025 May 15:271678X251337637. doi: 10.1177/0271678X251337637. Online ahead of print. J Cereb Blood Flow Metab. 2025. PMID: 40370321 Free PMC article.
References
-
- Devinsky O, Vezzani A, O'Brien TJ, et al.. Epilepsy. Nat Rev Dis Primers 2018; 4: 124. - PubMed
Publication types
MeSH terms
Substances
LinkOut - more resources
Full Text Sources
Medical
