

Association of Blood Glucose Level and Glycemic Variability With Mortality in Sepsis Patients During ICU Hospitalization
- PMID: 35570924
- PMCID: PMC9099235
- DOI: 10.3389/fpubh.2022.857368
Association of Blood Glucose Level and Glycemic Variability With Mortality in Sepsis Patients During ICU Hospitalization
Abstract
Background: There was considerable debate regarding the effect of mean blood glucose (MBG) and glycemic variability (GV) on the mortality of septic patients. This retrospective cohort study aimed to assess the association between MBG and GV with ICU mortality of sepsis patients and to explore the optimal MBG range.
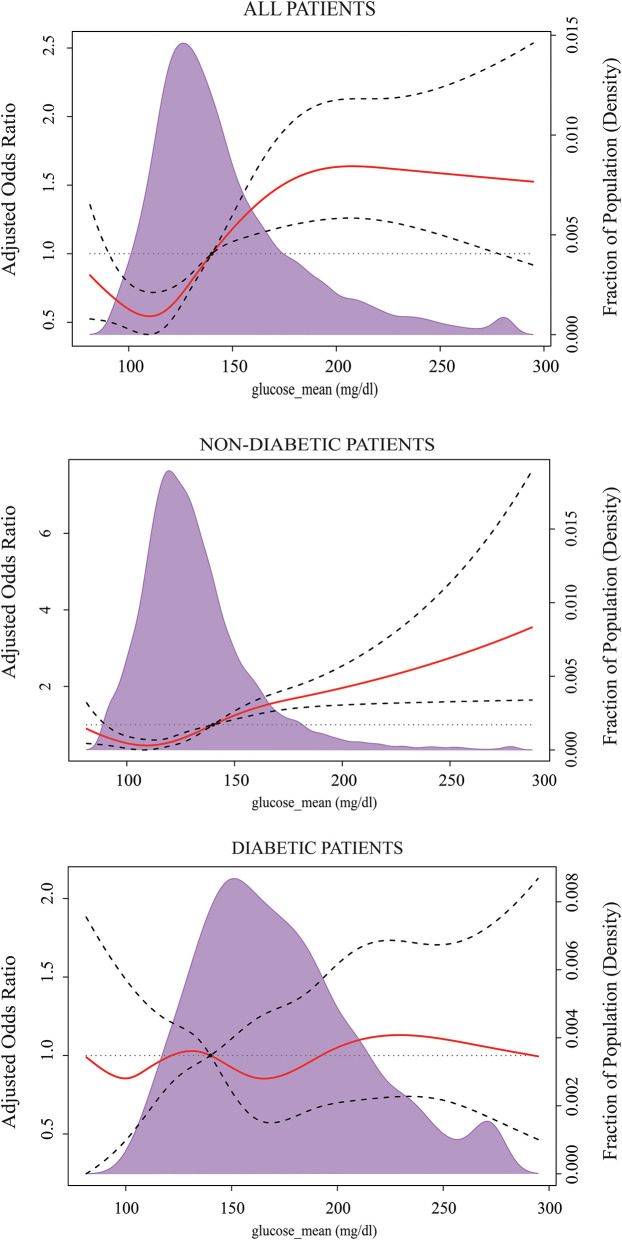
Methods: Sepsis patients were enrolled from the Medical Information Mart for Intensive Care IV database (MIMIC-IV). MBG and glycemic coefficient of variation (GluCV) were, respectively, calculated to represent the overall glycemic status and GV during ICU stay. The associations between MBG, GluCV, and ICU mortality of the septic patients were assessed by using multivariate logistic regression in different subgroups and the severity of sepsis. Restricted cubic splines evaluated the optimal MBG target.
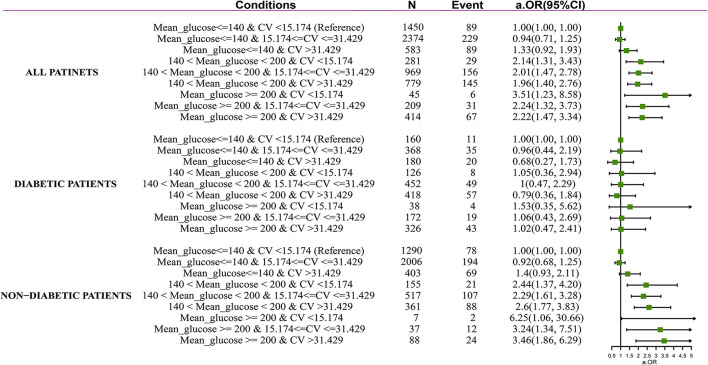
Results: A total of 7,104 adult sepsis patients were included. The multivariate logistic regression results showed that increased MBG and GluCV were significantly correlated with ICU mortality. The adjusted odds ratios were 1.14 (95% CI 1.09-1.20) and 1.05 (95% CI 1.00-1.12). However, there was no association between hyperglycemia and ICU mortality among diabetes, liver disease, immunosuppression, and hypoglycemia patients. And the impact of high GluCV on ICU mortality was not observed in those with diabetes, immunosuppression, liver disease, and non-septic shock. The ICU mortality risk of severe hyperglycemia (≧200 mg/dl) and high GluCV (>31.429%), respectively, elevated 2.30, 3.15, 3.06, and 2.37, 2.79, 3.14-folds in mild (SOFA ≦ 3), middle (SOFA 3-7), and severe group (SOFA ≧ 7). The MBG level was associated with the lowest risk of ICU mortality and hypoglycemia between 120 and 140 mg/dl in the subgroup without diabetes. For the diabetic subset, the incidence of hypoglycemia was significantly reduced when the MBG was 140-190 mg/dl, but a glycemic control target effectively reducing ICU mortality was not observed.
Conclusion: MBG and GluCV during the ICU stay were associated with all-cause ICU mortality in sepsis patients; however, their harms are not apparent in some particular subgroups. The impact of hyperglycemia and high GV on death increased with the severity of sepsis. The risk of ICU mortality and hypoglycemia in those with no pre-existing diabetes was lower when maintaining the MBG in the range of 120-140 mg/dl.
Keywords: glucose metabolism disorders; glycemic control; mortality; restricted cubic splines regression; sepsis.
Copyright © 2022 Lu, Tao, Sun, Zhang, Jiang, Liu, Ling, Zhang, Xiao, Hua, Zhu and Yang.
Conflict of interest statement
The authors declare that the research was conducted in the absence of any commercial or financial relationships that could be construed as a potential conflict of interest.
Figures
Similar articles
-
[Predictive value of glycemic variability within 6 hours on the short-term prognosis of patients with septic shock].Zhonghua Wei Zhong Bing Ji Jiu Yi Xue. 2021 Jan;33(1):28-32. doi: 10.3760/cma.j.cn121430-20200410-00274. Zhonghua Wei Zhong Bing Ji Jiu Yi Xue. 2021. PMID: 33565396 Chinese.
-
Between blood glucose and mortality in critically ill patients: Retrospective analysis of the MIMIC-IV database.J Diabetes Investig. 2024 Jul;15(7):931-938. doi: 10.1111/jdi.14182. Epub 2024 Mar 12. J Diabetes Investig. 2024. PMID: 38470005 Free PMC article.
-
Association between glycemic variability and short-term mortality in patients with acute kidney injury: a retrospective cohort study of the MIMIC-IV database.Sci Rep. 2024 Mar 11;14(1):5945. doi: 10.1038/s41598-024-56564-7. Sci Rep. 2024. PMID: 38467770 Free PMC article.
-
Blood glucose control in patients with severe sepsis and septic shock.World J Gastroenterol. 2009 Sep 7;15(33):4132-6. doi: 10.3748/wjg.15.4132. World J Gastroenterol. 2009. PMID: 19725146 Free PMC article. Review.
-
[Glycemic control in sepsis and septic shock: friend or foe?].Anaesthesist. 2008 Jan;57(1):43-8. doi: 10.1007/s00101-007-1285-7. Anaesthesist. 2008. PMID: 18034219 Review. German.
Cited by
-
Development of a nomogram for predicting in-hospital mortality in patients with liver cirrhosis and sepsis.Sci Rep. 2024 Apr 29;14(1):9759. doi: 10.1038/s41598-024-60305-1. Sci Rep. 2024. PMID: 38684696 Free PMC article.
-
The U-shaped association between serum osmolality and 28-day mortality in patients with sepsis: a retrospective cohort study.Infection. 2024 Oct;52(5):1931-1939. doi: 10.1007/s15010-024-02256-3. Epub 2024 Apr 22. Infection. 2024. PMID: 38647828 Free PMC article.
-
Postoperative hyperglycemia in patients with traumatic brain injury: development of a prediction model.Arch Med Sci. 2024 Jun 6;21(1):131-137. doi: 10.5114/aoms/188007. eCollection 2025. Arch Med Sci. 2024. PMID: 40190316 Free PMC article.
-
Stress hyperglycemia ratio as a mortality predictor in non-diabetic septic patients: a retrospective cohort analysis.BMC Infect Dis. 2025 May 25;25(1):752. doi: 10.1186/s12879-025-11151-7. BMC Infect Dis. 2025. PMID: 40414847 Free PMC article.
-
Simultaneous assessment of stress hyperglycemia ratio and glycemic variability to predict mortality in patients with coronary artery disease: a retrospective cohort study from the MIMIC-IV database.Cardiovasc Diabetol. 2024 Feb 9;23(1):61. doi: 10.1186/s12933-024-02146-w. Cardiovasc Diabetol. 2024. PMID: 38336720 Free PMC article.
References
-
- Fleischmann-Struzek C, Mellhammar L, Rose N, Cassini A, Rudd KE, Schlattmann P, et al. . Incidence and mortality of hospital- and ICU-treated sepsis: results from an updated and expanded systematic review and meta-analysis. Intensive Care Med. (2020) 46:1552–62. 10.1007/s00134-020-06151-x - DOI - PMC - PubMed
Publication types
MeSH terms
Substances
LinkOut - more resources
Full Text Sources
Medical