

Impact of SARS-CoV-2 Mutations on PCR Assay Sequence Alignment
- PMID: 35570946
- PMCID: PMC9096222
- DOI: 10.3389/fpubh.2022.889973
Impact of SARS-CoV-2 Mutations on PCR Assay Sequence Alignment
Abstract
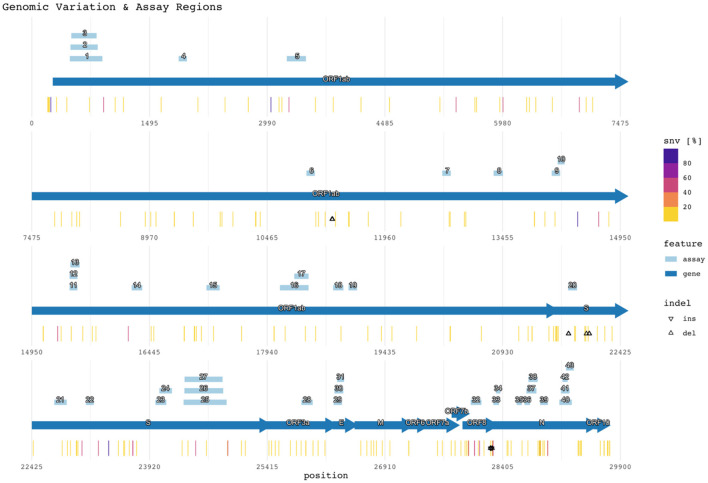
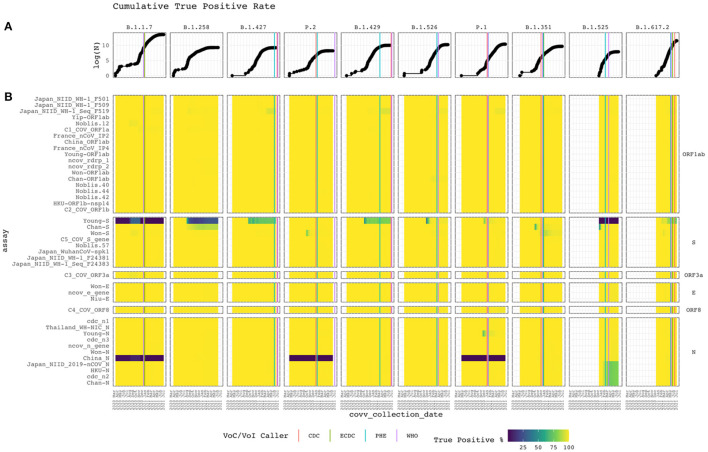
Real-time reverse transcription polymerase chain reaction (RT-PCR) assays are the most widely used molecular tests for the detection of SARS-CoV-2 and diagnosis of COVID-19 in clinical samples. PCR assays target unique genomic RNA regions to identify SARS-CoV-2 with high sensitivity and specificity. In general, assay development incorporates the whole genome sequences available at design time to be inclusive of all target species and exclusive of near neighbors. However, rapid accumulation of mutations in viral genomes during sustained growth in the population can result in signature erosion and assay failures, creating situational blind spots during a pandemic. In this study, we analyzed the signatures of 43 PCR assays distributed across the genome against over 1.6 million SARS-CoV-2 sequences. We present evidence of significant signature erosion emerging in just two assays due to mutations, while adequate sequence identity was preserved in the other 41 assays. Failure of more than one assay against a given variant sequence was rare and mostly occurred in the two assays noted to have signature erosion. Assays tended to be designed in regions with statistically higher mutations rates. in silico analyses over time can provide insights into mutation trends and alert users to the emergence of novel variants that are present in the population at low proportions before they become dominant. Such routine assessment can also potentially highlight false negatives in test samples that may be indicative of mutations having functional consequences in the form of vaccine and therapeutic failures. This study highlights the importance of whole genome sequencing and expanded real-time monitoring of diagnostic PCR assays during a pandemic.
Keywords: COVID-19; PCR; RT-PCR; SARS-CoV-2; biosurveillance; diagnostics; pandemic; signature.
Copyright © 2022 Negrón, Kang, Mitchell, Holland, Wist, Voss, Brinkac, Jennings, Guertin, Goodwin and Sozhamannan.
Conflict of interest statement
DN, JK, SM, MH, SW, LB, and KJ were employed by Noblis, Inc. SG was employed by Noblis ESI. SS was employed by Logistics Management Institute. The remaining authors declare that the research was conducted in the absence of any commercial or financial relationships that could be construed as a potential conflict of interest.
Figures


References
-
- Betacoronavirus . ViralZone. Available online at: https://viralzone.expasy.org/764 (accessed March 30, 2022)
-
- Public Health England. Investigation of novel SARS-CoV-2 variant: Variant of Concern 202012/01. Report No.: Technical briefing 5 (2020). Available online at: https://assets.publishing.service.gov.uk/government/uploads/system/uploa... (accessed Jan 19, 2021).
Publication types
MeSH terms
LinkOut - more resources
Full Text Sources
Medical
Miscellaneous