

Impact of a rapid high-sensitivity troponin pathway on patient flow in an urban emergency department
- PMID: 35571147
- PMCID: PMC9071237
- DOI: 10.1002/emp2.12739
Impact of a rapid high-sensitivity troponin pathway on patient flow in an urban emergency department
Abstract
Study objective: To evaluate whether the introduction of a 1-hour high-sensitivity cardiac troponin-T (hs-TnT) pathway for patients who present to the emergency department (ED) with suspected acute coronary syndrome (ACS) improves ED patient flow without changing the rate of "missed" major adverse cardiac events (MACE), compared to use of conventional cardiac troponin with an associated 3-hour pathway.
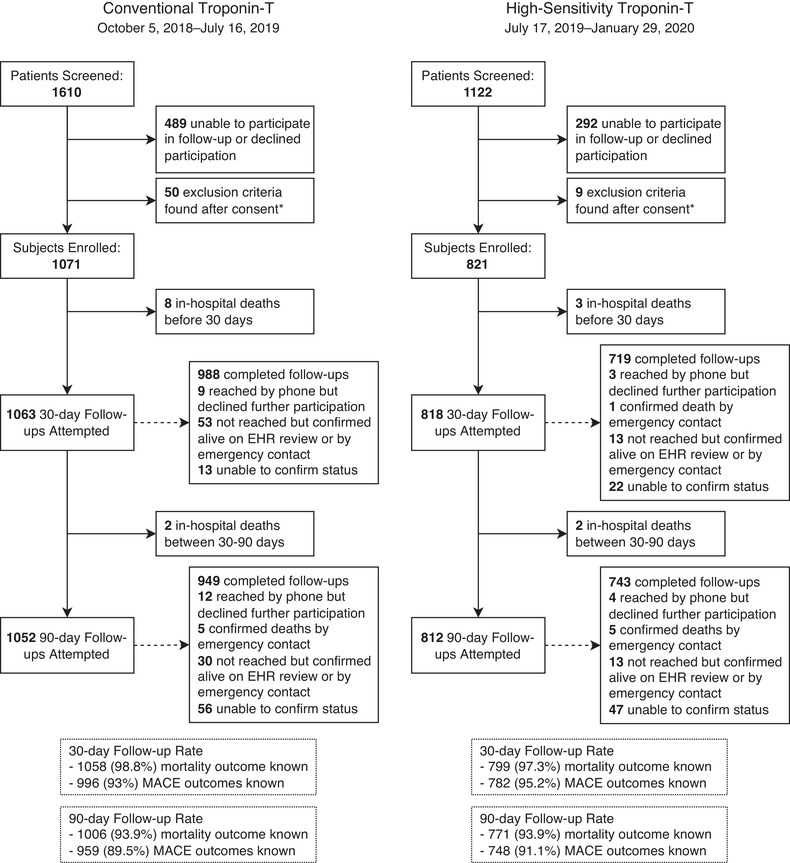
Methods: This was a prospective, uncontrolled observational study conducted before and after implementation of a 1-hour hs-TnT pathway at a high-volume urban ED. Patients undergoing evaluation for ACS in the ED were enrolled during their initial visit and clinical outcomes were assessed at 30 and 90 days. Throughput markers were extracted from the electronic medical record and compared. The primary outcome was provider-to-disposition decision time.
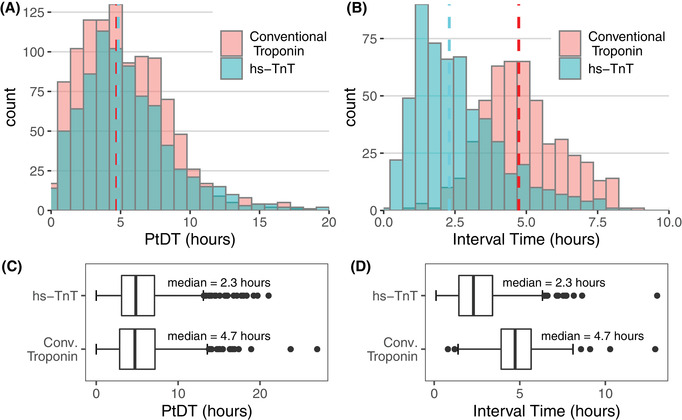
Results: A total of 1892 patients were enrolled, 1071 patients while using conventional troponin and 821 after introduction of hs-TnT. With the new assay and pathway, median interval between troponin tests decreased from 4.7 hours (interquartile range [IQR] 3.9-5.7 hours) to 2.3 hours (IQR 1.5-3.4 hours) (P < 0.001). However, there was no difference in median provider-to-disposition decision time, which measured 4.7 hours (IQR 2.9-7.2) and 4.8 hours (IQR 3.1-7.1) (P = 0.428) respectively. Total 30-day MACE rate in discharged patients was low in both groups, occurring in only 4/472 (0.85%) encounters in the first cohort and 4/381 (1.0%) encounters in the second.
Conclusion: Introduction of a 1-hour hs-TnT ACS evaluation pathway reduced the troponin collection interval but did not reduce provider to disposition time. There was no difference in rate of 30-day MACE in patients discharged from the ED.
Keywords: acute coronary syndrome; high‐sensitivity cardiac troponin; length of stay; myocardial infarction; throughput; troponin.
© 2022 The Authors. JACEP Open published by Wiley Periodicals LLC on behalf of American College of Emergency Physicians.
Conflict of interest statement
A.J.E.: received speaker's fee from Ionetix, consulting fees from W.L. Gore & Associates; and has grants/grants pending from Canon Medical Systems, GE Healthcare, and W.L. Gore & Associates. All of the other authors report no other conflicts of interest.
Figures
References
-
- Mozaffarian D, Benjamin EJ, Go AS, et al. Heart disease and stroke statistics–2015 update: a report from the American Heart Association. Circulation. 2015;131(4):e29–322. - PubMed
-
- Cairns C, Kang K, Santo L. National hospital ambulatory medical care survey: 2018 emergency department summary tables. https://www.cdc.gov/nchs/data/nhamcs/web_tables/2018_ed_web_tables‐508.pdf
-
- Bhuiya Farida A., Pitts Stephen R., McCaig Linda F.. Emergency department visits for chest pain and abdominal pain: United States, 1999–2008. NCHS Data Brief: National Center for Health Statistics; 2010(43):1–8. - PubMed
-
- Hsia RY, Hale Z, Tabas JA. A national study of the prevalence of life‐threatening diagnoses in patients with chest pain. JAMA Intern Med. 2016;176(7):1029–1032. - PubMed
LinkOut - more resources
Full Text Sources