. 2022 May 5:2022:6160539.
doi: 10.1155/2022/6160539. eCollection 2022.

CAPRIN1 Enhances Chemoresistance and Glycolysis in Laryngeal Squamous Cell Carcinoma via Regulation of ZIC5

Affiliations

CAPRIN1 Enhances Chemoresistance and Glycolysis in Laryngeal Squamous Cell Carcinoma via Regulation of ZIC5

Yubo Zhang et al. J Oncol. .

Abstract

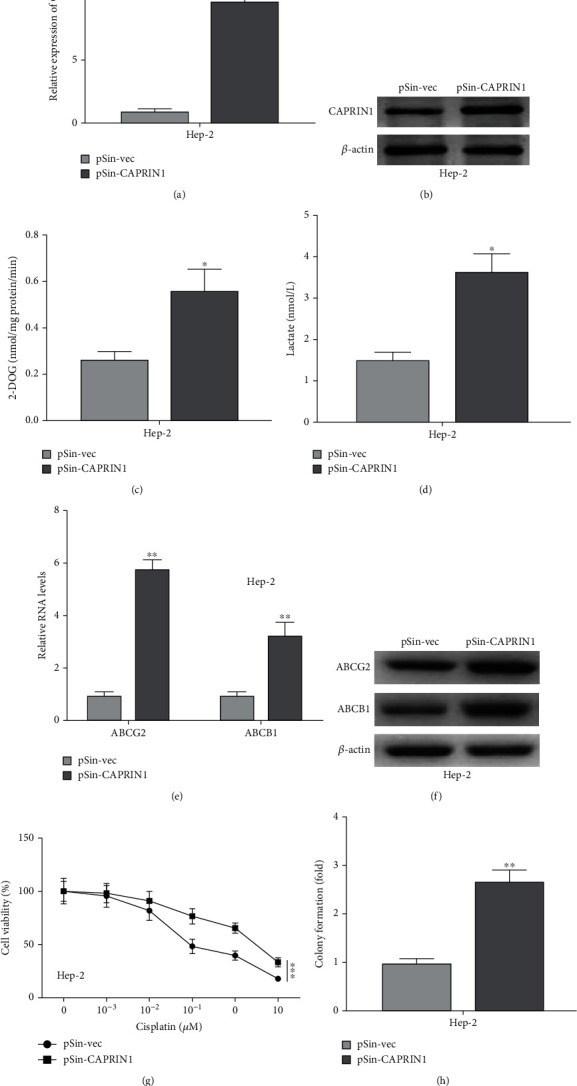
Background: Cytoplasmic activation/proliferation-associated protein-1 (CAPRIN1) plays an important role in carcinogenesis, whereas its role in laryngeal squamous cell carcinoma remains unclear. This study was designed to investigate the roles of CAPRIN1 in glycolysis and chemoresistance and its underlying mechanisms in laryngeal squamous cell carcinoma.

Methods: Cell viability was evaluated by using CCK-8 and colony formation assays. qRT-PCR, Western blotting, and immunohistochemistry were used to determine the expressions of target genes. Gene knockdown and overexpression cell lines were constructed by performing transfection of siRNAs and plasmids, respectively. Luciferase reporter assay, RNA pull-down, and RNA immunoprecipitation assays were applied to evaluate the RNA-protein interactions. The Kaplan-Meier analysis was performed to evaluate the relationship between gene expression and overall survival rate.

Results: An elevation of CAPRIN1 was identified to be associated with chemoresistance and poor prognosis in patients with laryngeal cancer. The increase of CAPRIN1 promoted glycolysis and chemoresistance, whereas the knockdown of CAPRIN1 inhibited glycolysis and chemoresistance in laryngeal cancer cells. The underlying mechanistic investigation revealed that CAPRIN1 promoted glycolysis and chemoresistance of laryngeal cancer cells by the regulation of Zic Family Member 5 (ZIC5).

Conclusion: CAPRIN1 promoted laryngeal squamous cell carcinoma glycolysis and chemoresistance by the regulation of ZIC5.


Conflict of interest statement

The authors declare that they have no conflicts of interest.

Figures

Figure 1
Figure 1
An elevation of CAPRIN1 was identified to be associated with chemoresistance and poor prognosis in laryngeal cancer. (a and b) Immunohistochemistry was used to determine the protein expressions of CAPRIN1 in laryngeal cancer tissues and adjacent normal tissues (ANT). Representative photographs were provided. Scale bars, 100 μm. (c) Besides, qRT-PCR was used to determine the mRNA expression levels of CAPRIN1 in laryngeal cancer tissues and ANT. (d) The Kaplan–Meier analysis was performed to compare the overall survival rate between the CAPRIN1 high group and CAPRIN1 low group from patients with laryngeal cancer (n = 50). (e and f) qRT-PCR and Western blotting were applied to determine the mRNA and protein expression levels of CAPRIN1 in laryngeal cancer cell lines including Hep-2 and TU-177 and cisplatin-resistant cells including Hep-2/R and TU-177/R as well as nasopharyngeal epithelial cells (NP69). P < 0.05; ∗∗P < 0.01.
Figure 2
Figure 2
Forced expression of CAPRIN1 promoted glycolysis and chemoresistance in laryngeal cancer cells. (a and b) qRT-PCR and Western blotting were used to determine the mRNA and protein expression levels of CAPRIN1, respectively, in Hep-2 cells that were transfected with CAPRIN1 plasmid (pSin-CAPRIN1) or empty vector (pSin-vec). (c and d) The cellular uptake of 2-DOG and lactate secretion were also determined in those transfected Hep-2 cells. (e and f) qRT-PCR and Western blotting were used to determine the mRNA and protein expression levels of multidrug transporter expression (ABCG2 and ABCB1), respectively, in Hep-2 cells that were transfected with CAPRIN1 plasmid (pSin-CAPRIN1) or empty vector (pSin-vec). (g and h) Cell viability and colony formation were determined to evaluate cell viabilities in cisplatin-treated Hep-2 cells that were transfected with CAPRIN1 plasmid (pSin-CAPRIN1) or empty vector (pSin-vec). The data were shown as the means ± SD. P < 0.05, ∗∗P < 0.01, and ∗∗∗P < 0.001.
Figure 3
Figure 3
Knockdown of CAPRIN1 inhibited glycolysis and chemoresistance in laryngeal cancer cells. (a and b) qRT-PCR and Western blotting were used to determine the mRNA and protein expression levels of CAPRIN1, respectively, in TU-177 and TU-177/R cells that were transfected with CAPRIN1 siRNAs (si-CAPRIN1#1 and si-CAPRIN1#2) or negative control (si-NC). (c and d) Besides, the cellular uptake of 2-DOG and lactate secretion were also determined. (e and f) qRT-PCR and Western blotting were used to determine the mRNA and protein expression levels of multidrug transporter expression (ABCG2 and ABCB1), respectively, in TU-177/R cells that were transfected with CAPRIN1 siRNAs (si-CAPRIN1#1 and si-CAPRIN1#2) or negative control (si-NC). (g and h) Cell viability and colony formation assay were determined in cisplatin-treated TU-177/R cells that were transfected with CAPRIN1 siRNAs (si-CAPRIN1#1 and si-CAPRIN1#2) or negative control (si-NC). The data were shown as the means ± SD. P < 0.05, ∗∗P < 0.01, and ∗∗∗P < 0.001.
Figure 4
Figure 4
CAPRIN1 regulated the ZIC5 expression. (a and b) qRT-PCR was used to determine the mRNA expression levels of ZIC5 in Hep-2 cells that were transfected with CAPRIN1 plasmid (pSin-CAPRIN1) or empty vector (pSin-vec) and mRNA expression levels of ZIC5 in TU-177 cells that were transfected with CAPRIN1 siRNAs (si-CAPRIN1#1 and si-CAPRIN1#2) or negative control (si-NC). In addition, (c and d) after the cells were transfected for 48 h, the cells were then treated with actinomycin D (10 μg/ml). These cells were harvested at 0, 2, 4, 6, and 8 h after treatment. The mRNA expression levels of ZIC5 were then detected using qRT-PCR. The data were shown as the means ± SD. P < 0.05 and ∗∗P < 0.01.
Figure 5
Figure 5
CAPRIN1 regulated ZIC5 through 3′UTR binding. (a) A biotinylated RNA pull-down assay was performed. The biotinylated different regions of ZIC5 mRNA were incubated with cell lysates (Hep-2 and TU-177) and the mRNA region that was interacted with CAPRIN1 was analyzed by using Western blotting. β-Actin was used as an internal control. Besides, (b) RNP IP assay was also operated. After mRNA of ZIC5 in cell lysates were captured by anti-CAPRIN1 antibody or anti-IgG, qRT-PCR was then determined. (c) Luciferase reporter activity was performed in the Hep-2 cells that were cotransfected with pSin-CAPRIN1/pSin-vec and ZIC5 3′UTR/psi-check2, respectively. (d) Luciferase reporter activity was detected in the TU-177 cells that were cotransfected with si-CAPRIN1#1/si-CAPRIN1#2/si-NC and ZIC5 3′UTR/psi-check2, respectively.
Figure 6
Figure 6
CAPRIN1 promoted glycolysis and chemoresistance of laryngeal cancer cells by the regulation of ZIC5. Hep-2 cells were transfected with pSin-vec plus si-NC, pSin-CAPRIN1 plus si-NC, or pSin-CAPRIN1 plus si-ZIC5. (a and b) qRT-PCR and Western blotting were used to determine the mRNA and protein expression levels of ZIC5. (c and d) Besides, the cellular uptake of 2-DOG and lactate secretion were determined. (e and f) qRT-PCR and Western blotting were used to determine the mRNA and protein levels of multidrug transporter expression (ABCG2 and ABCB1), respectively. (g and h) CCK-8 and colony formation assays were performed to determine cell viability in cisplatin-treated Hep-2 cells that were transfected. The data were shown as the means ± SD. P < 0.05, ∗∗P < 0.01, and ∗∗∗P < 0.001.
Figure 7
Figure 7
Effects of CAPRIN1 on glycolysis and chemoresistance of laryngeal cancer cells depended on ZIC5. TU-177 and TU-177/R cells were also transfected with si-NC plus pSin-vec, si-CAPRIN1#1 plus pSin-vec, or si-CAPRIN1#1 plus pSin-ZIC5. (a and b) The mRNA and protein expression levels of ZIC5 in those transfected cells were determined. (c and d) The cellular uptake of 2-DOG and lactate secretion were determined. (e and f) qRT-PCR and Western blotting were used to determine the mRNA and protein expression levels of multidrug transporter expression (ABCG2 and ABCB1), respectively. (g and h) Cell viability of these cotransfected TU-177/R cells after 24-h treatment with the indicated dose of cisplatin was determined by using MTT assay and colony formation assay, respectively. The data were shown as the means ± SD. P < 0.05, ∗∗P < 0.01, and ∗∗∗P < 0.001.

References

    1. Chu E. A., Kim Y. J. Laryngeal cancer: diagnosis and preoperative work-up. Otolaryngologic Clinics of North America . 2008;41(4):673–695. doi: 10.1016/j.otc.2008.01.016. - DOI - PubMed
    1. Cattaruzza M., Maisonneuve P., Boyle P. Epidemiology of laryngeal cancer. European Journal of Cancer Part B: Oral Oncology. . 1996;32(5):293–305. doi: 10.1016/0964-1955(96)00002-4. - DOI - PubMed
    1. Genden E. M., Ferlito A., Silver C. E., et al. Evolution of the management of laryngeal cancer. Oral Oncology . 2007;43(5):431–439. doi: 10.1016/j.oraloncology.2006.08.007. - DOI - PubMed
    1. Bray F., Ferlay J., Soerjomataram I., Siegel R. L., Torre L. A., Jemal A. Global cancer statistics 2018: GLOBOCAN estimates of incidence and mortality worldwide for 36 cancers in 185 countries. CA: a Cancer Journal for Clinicians . 2018;68(6):394–424. doi: 10.3322/caac.21492. - DOI - PubMed
    1. Jurkiewicz D., Dzaman K., Rapiejko P. Laryngeal cancer risk factors. Polski Merkuriusz Lekarski: Organ Polskiego Towarzystwa Lekarskiego. . 2006;21(121):94–98. - PubMed