. 2022 Apr 29:16:848026.
doi: 10.3389/fnhum.2022.848026. eCollection 2022.

Neural Synchrony and Network Dynamics in Social Interaction: A Hyper-Brain Cell Assembly Hypothesis

Affiliations

Neural Synchrony and Network Dynamics in Social Interaction: A Hyper-Brain Cell Assembly Hypothesis

Viktor Müller. Front Hum Neurosci. .

Abstract

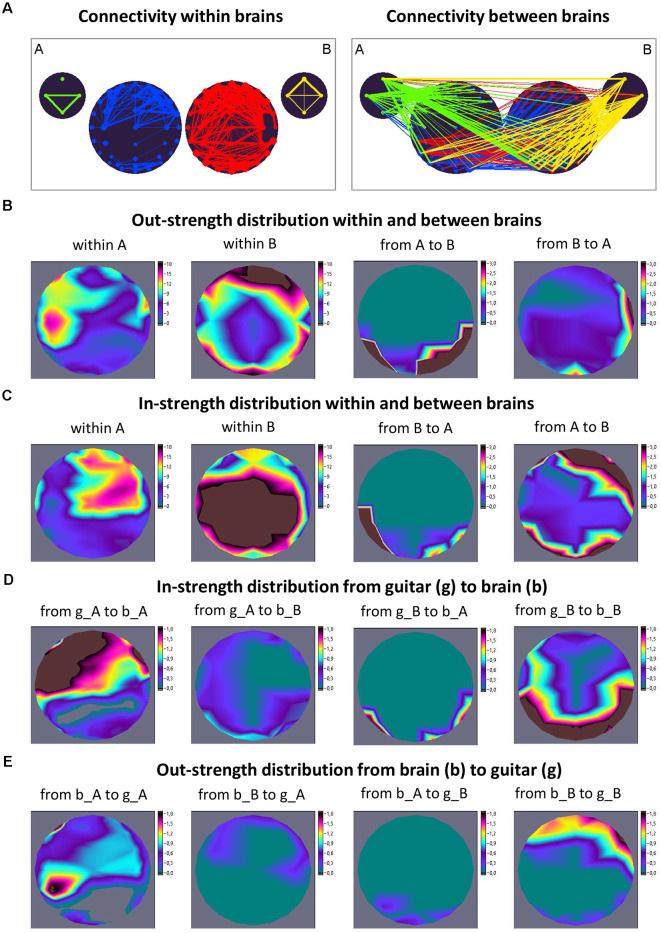
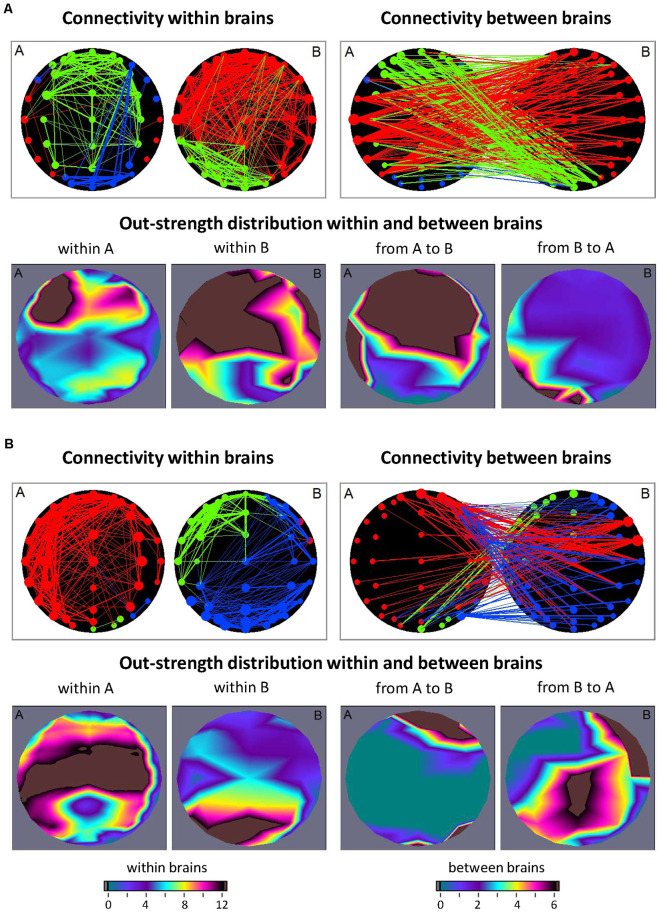
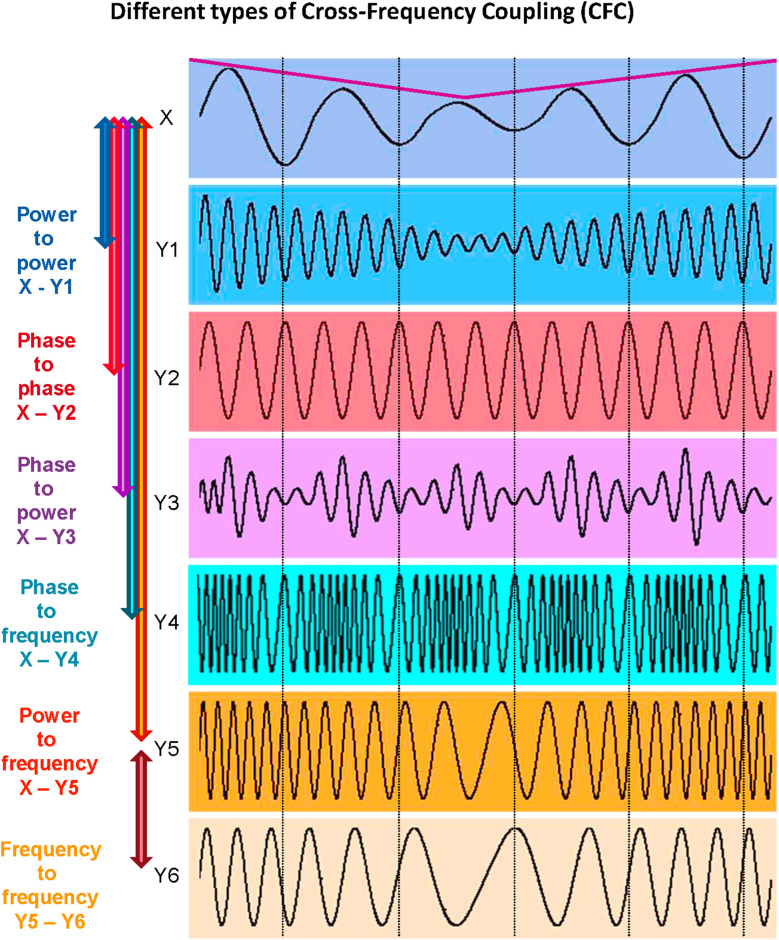
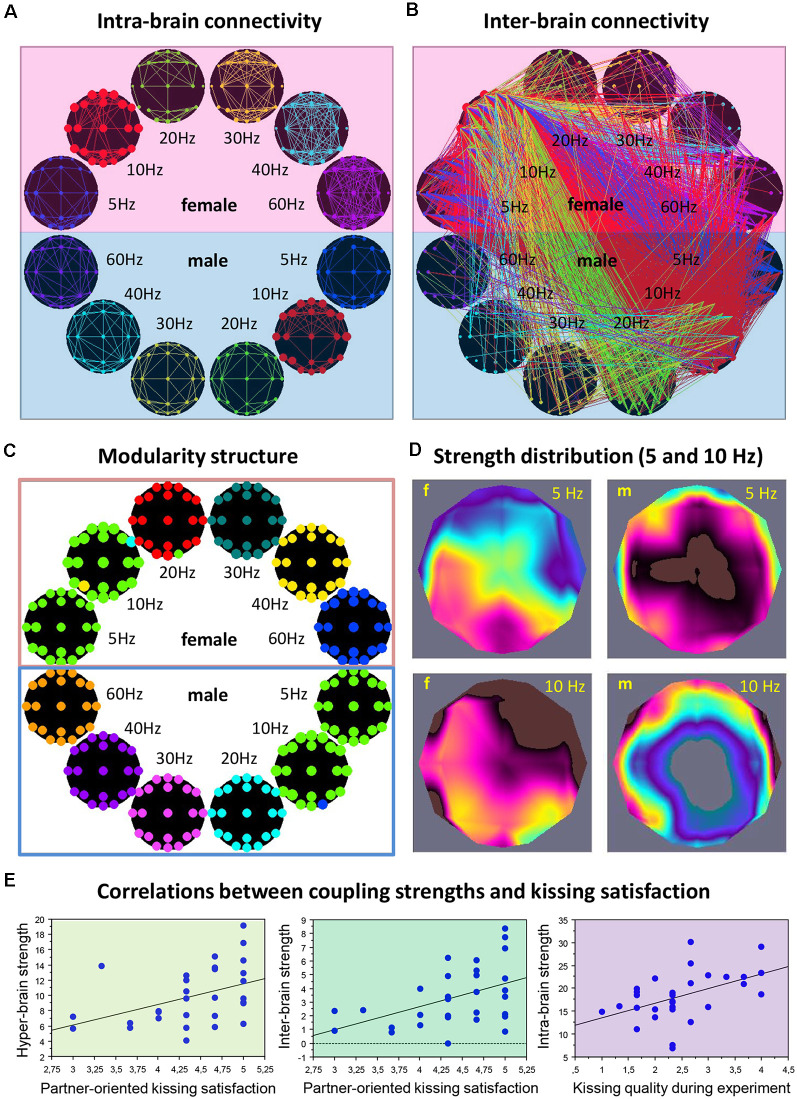
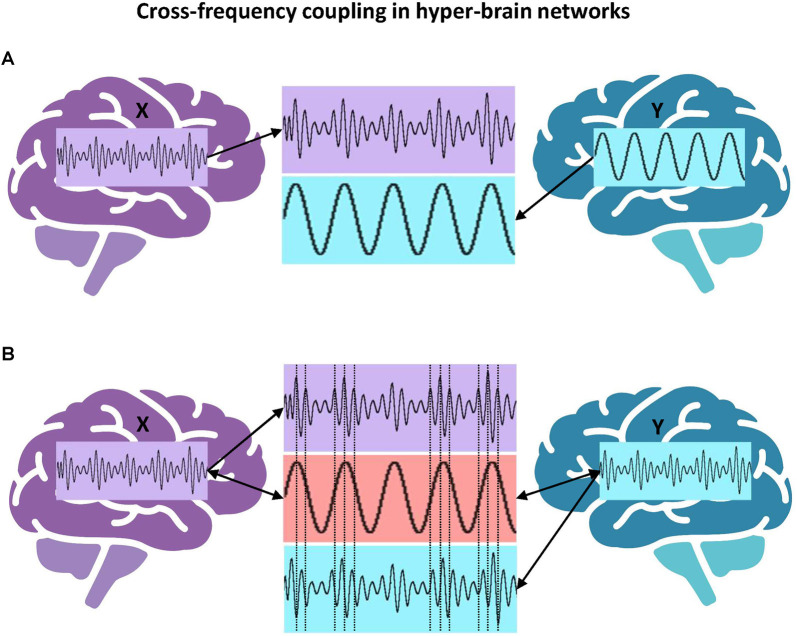
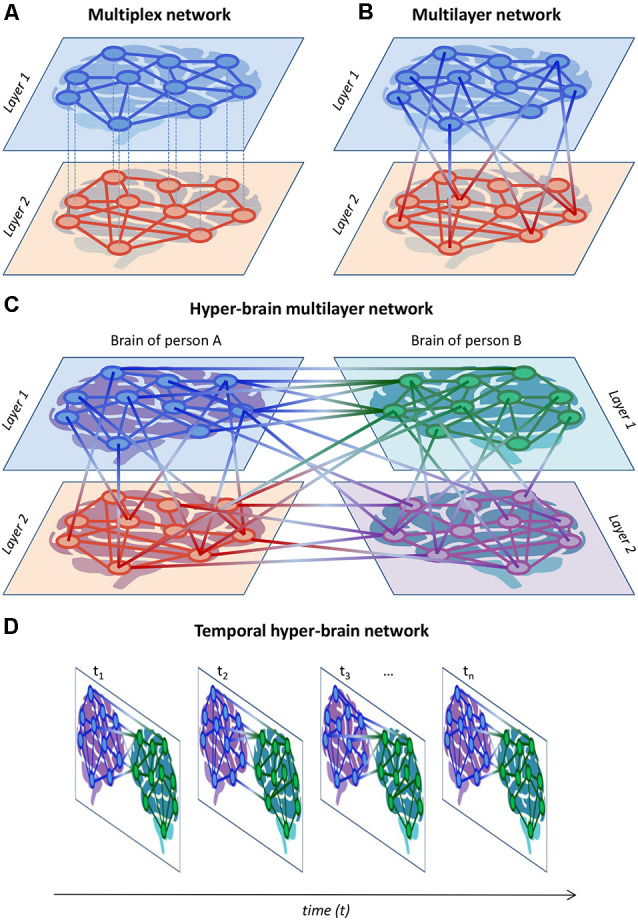
Mounting neurophysiological evidence suggests that interpersonal interaction relies on continual communication between cell assemblies within interacting brains and continual adjustments of these neuronal dynamic states between the brains. In this Hypothesis and Theory article, a Hyper-Brain Cell Assembly Hypothesis is suggested on the basis of a conceptual review of neural synchrony and network dynamics and their roles in emerging cell assemblies within the interacting brains. The proposed hypothesis states that such cell assemblies can emerge not only within, but also between the interacting brains. More precisely, the hyper-brain cell assembly encompasses and integrates oscillatory activity within and between brains, and represents a common hyper-brain unit, which has a certain relation to social behavior and interaction. Hyper-brain modules or communities, comprising nodes across two or several brains, are considered as one of the possible representations of the hypothesized hyper-brain cell assemblies, which can also have a multidimensional or multilayer structure. It is concluded that the neuronal dynamics during interpersonal interaction is brain-wide, i.e., it is based on common neuronal activity of several brains or, more generally, of the coupled physiological systems including brains.

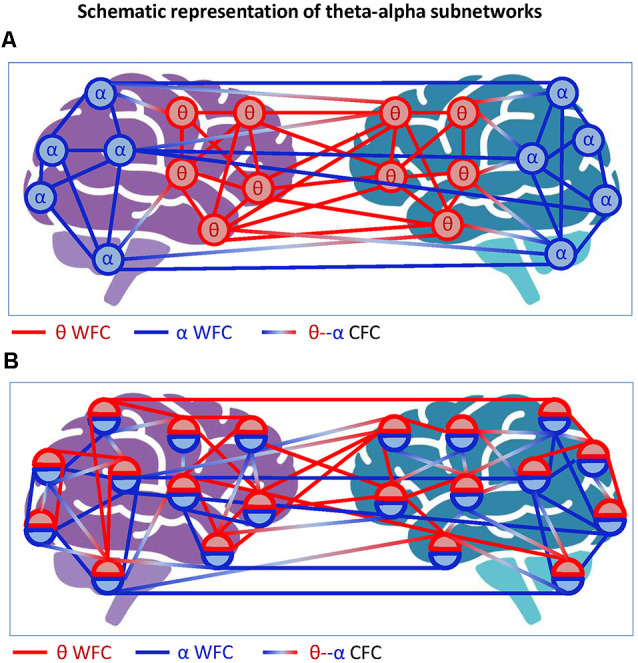
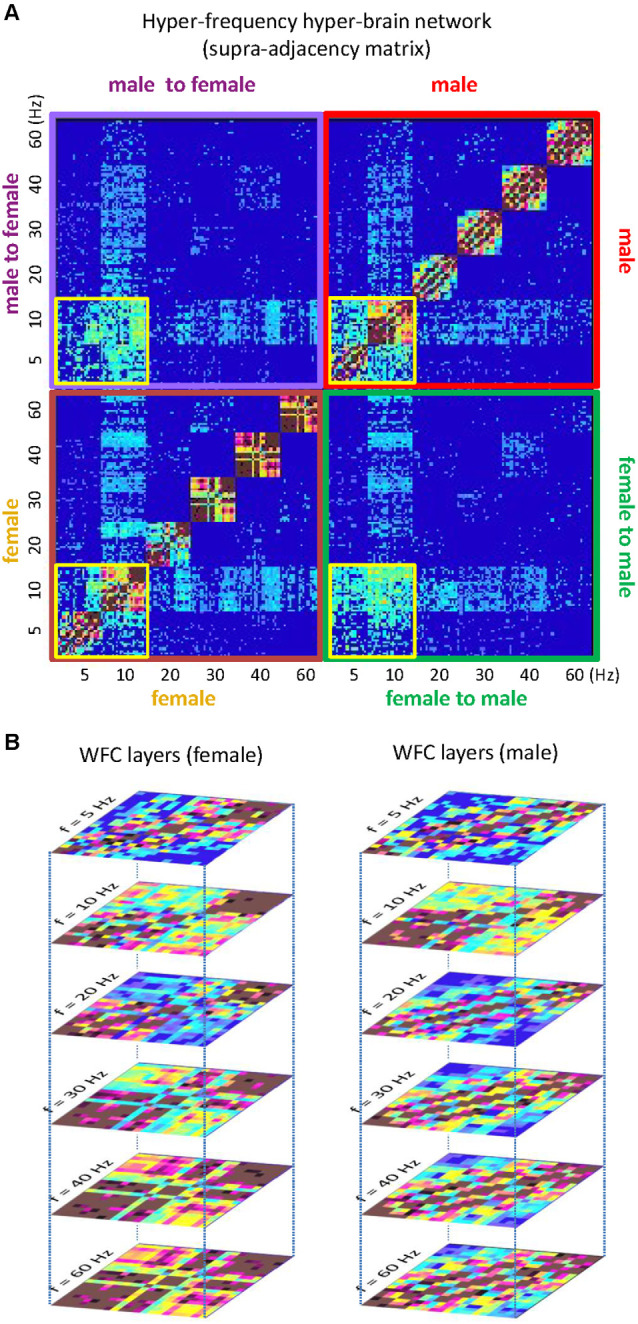
Keywords: graph-theoretic approach; hyper-brain network dynamics; multiplex and multilayer networks; neural synchrony; social interaction; within- and cross-frequency coupling.


Conflict of interest statement

The author declares that the research was conducted in the absence of any commercial or financial relationships that could be construed as a potential conflict of interest.

Figures

Figure 1
Figure 1
Connectivity within and between the brains and instruments and corresponding strength distributions during free guitar improvisation. (A) Connectivity maps. The left panel represents the connectivity between the guitars and brains, and the right panel represents the connectivity between the guitars and brains. The strength of the nodes (sum of all out-going connections) is coded by circle size, and the strength of edges is coded by line thickness. The different parts of the network are color-coded: guitar A, green; guitar B, yellow; guitarist A’s brain, blue; guitarist B’s brain, red. The guitars comprise four nodes each, indicating different frequency ranges of auditory signals ordered clockwise from top: low, middle, high, and whole range (see text). The brains comprise 40 nodes (electrodes) each. (B) Out-strength distribution within and between brains. The two maps on the left represent the topological distribution of the out-strengths within the brains of the two guitarists, and the ones on the right display the topological distribution of the out-strengths going from guitarist A’s brain to guitarist B’s brain and vice versa. (C) In-strength distribution within and between brains. The two maps on the left represent the topological distribution of the in-strengths within the brains of the two guitarists, and the ones on the right display the topological distribution of the in-strengths coming from guitarist B’s brain to guitarist A’s brain and vice versa. (D) In-strength distribution from the guitar (g) to the brain (b). The strength distribution maps from left to right represent the topological distribution of the in-strengths coming from guitar A to brain A, from guitar A to brain B, from guitar B to brain A, and from guitar B to brain B. (E) Out-strength distribution from the brain (b) to guitar (g). The strength distribution maps from left to right represent the topological distribution of the out-strengths coming from brain A to guitar A, from brain B to guitar A, from brain A to guitar B, and from brain B to guitar B. It can be seen that the guitars address brain regions in the two brains that are interconnected as well as those that are not. In addition, there are connections between the brains that are not connected with the guitars (adapted from Müller and Lindenberger, 2019).
Figure 2
Figure 2
Connectivity within and between the brains and corresponding out-strength distributions during free guitar improvisation. (A) Connectivity maps and out-strength distributions in the first time window. In the first row, the left panel represents the connectivity within the brains, and the right panel represents the connectivity between the brains. The size of the circles represents the strength of the nodes (electrodes) and connectivity strength is coded by line thickness. The three different modules are coded by color. In the second row, the two maps on the left represent the topological distribution of the out-strengths within the brains of the two guitarists, and the right ones display the topological distribution of the out-strengths going from guitarist A’s brain to guitarist B’s brain and vice versa. (B) Connectivity maps and out-strength distributions in the second time window. Connectivity maps within and between the brains and corresponding out-strength distribution maps are represented in the same way as in (A).
Figure 3
Figure 3
Different types of cross-frequency coupling (CFC). Power-to-power CFC can be identified between signals X and Y1: Signal Y1 about five times higher frequency than that of signal X shows slow amplitude modulations over time like signal X (indicated by the purple line). Phase-to-phase CFC can be identified between signals X and Y2: Signal Y2 shows 3:1 phase-to-phase coupling with signal X, i.e., one oscillation period of signal X corresponds to three periods of signal Y2. Phase-to-power CFC can be identified between signals X and Y3: Signal Y3 shows fast amplitude modulations that are related (or coupled) to the phase of signal X. Phase-to-frequency CFC can be identified between signals X and Y4: Signal Y4 shows frequency modulations that are coupled with phase changes of signal X. Power-to-frequency CFC can be identified between signals X and Y5: Signal Y5 shows frequency modulations that are related to, or coupled with, the slow amplitude modulations of signal X (purple line). Frequency-to-frequency CFC can be identified between signals Y5 and Y6: Signal Y6 shows slower but similar frequency modulations as the signal Y5. The different types of CFC are not mutually exclusive (cf. Jensen and Colgin, 2007). For instance, slow amplitude modulations of signal X are coupled not only with the amplitude changes of signal Y1 but also with frequency changes of signals Y5 and Y6, which are coupled in their frequency modulations at the same time (adapted from Jirsa and Müller, 2013).
Figure 4
Figure 4
Representation of the hyper-brain network and the theta-alpha subnetwork during kissing. (A) Intra-brain connectivity. The brain maps represent connectivity at six different frequencies within the female and male partners’ brains, respectively. (B) Intra-brain connectivity. The brain maps represent the between-brain connectivity within and between the six frequencies. It can be seen that the strongest connections are found in the theta (blue) and alpha (red) frequency bands, and between them. (C) Modularity structure. Modularity analysis revealed nine different modules. The biggest module is the so-called theta-alpha module or subnetwork comprising 5- and 10-Hz nodes in both female and male brains. Other modules represent different frequencies in both brains separately. (D) Out-strength distribution of theta (5 Hz) and alpha (10 Hz) nodes within the female and male brains. The topological distribution of coupling strength represents the overall within- and cross-frequency connectivity within the theta-alpha subnetwork for female and male brains, respectively. (E) Correlations between coupling strengths and kissing satisfaction and kissing quality. Partner-oriented kissing satisfaction correlated significantly positively with the hyper- and especially inter-brain strengths determined for 5-Hz oscillation nodes. Kissing quality during the experiment correlated significantly positively with intra-brain strength determined for 10-Hz oscillation nodes (adapted from Müller and Lindenberger, and Müller et al., 2021a).
Figure 5
Figure 5
Schematic representation of theta-alpha subnetworks. (A) Theta-alpha subnetwork as two hyper-brain modules oscillating at different frequencies. The two hyper-brain modules oscillating at different frequencies (θ and α) are coded by colors (blue and red). The coupling within the modules is given by WFC and the coupling between the modules by CFC. (B) Theta-alpha subnetwork with nodes oscillating at two different frequencies each. The two hyper-brain modules oscillating at different frequencies (θ and α), also coded in blue and red, are distributed across two brains, whereby each node belongs to both modules. The coupling within the modules is given by WFC and the coupling between the modules by CFC.
Figure 6
Figure 6
Cross-frequency coupling in hyper-brain networks. (A) Hyper-brain theta-gamma phase-amplitude CFC, scenario 1. The amplitude or envelope of signal X in the brain on the left is coupled to the phase of signal Y in the brain on the right. (B) Hyper-brain theta-gamma phase-amplitude CFC, scenario 2. Signals X and Y (in the brains on the left and right, respectively) are gamma oscillations, which are mostly out of phase (indicated by the vertical dotted lines in the middle) but their amplitude or envelope is modulated by the common theta rhythm, which can be either endogenous or exogenous.
Figure 7
Figure 7
Schematic representation of multiplex, multilayer, and temporal networks. (A) Multiplex network. A two-layer single-brain multiplex network is represented. The layers can represent, for example, different frequencies or other brain attributes (e.g., structural and functional connectivity). (B) Multilayer network. A two-layer single-brain multilayer network is represented, where the nodes are connected within and between the layers. The connections within the layers can be given by WFC and those between the layers by CFC. (C) Hyper-brain multilayer network. A two-layer hyper-brain multilayer network is represented, where the nodes are connected within and between the layers as well as within and between the brains. In the case of an HFN, connections within the layers are given by WFC, connections between the layers are given by CFC, and connections between the brains are given both by WFC and CFC. The two layers of persons A and B can be considered as two different aspects. (D) Temporal hyper-brain network. Network structures can change across time and can be considered multiplex (if the temporal layers do not have any causal relationships or are not connected) or multilayer (if the temporal layers are causally dependent or connected) networks. For simplicity, the connections between the temporal layers were omitted but they would appear if the network was multilayer.
Figure 8
Figure 8
Hyper-frequency hyper-brain network during kissing. (A) Supra-adjacency matrix of the common network. The supra-adjacency matrix (252 × 252) comprises all connections between 21 electrodes and six frequencies (5, 10, 20, 30, 40, and 60 Hz) within (brown and red quadrats) and between (green and purple quadrats) female and male brains, respectively. WFC connections between all electrodes within the female and male brains are distributed along the main diagonal of the matrix. The electrodes for each frequency are organized in anterior-posterior order from left to right: Fp1, Fpz, Fp2, …,O1, Oz, and O2. WFC connections between the brains are distributed along diagonals within the green and purple quadrats. The 5- and 10-Hz nodes (indicated by four smaller yellow squares) represent the so-called theta-alpha subnetwork. The alpha frequency (10 Hz) has the most connections and serves a cleaving or pacemaker function in the common network. (B) WFC layers of the female and male subnetworks or aspects. The WFC subnetworks are presented here in the form of a six-layer structure that is depicted in A along the diagonal. The connections between the layers within the female and male brains are represented by remaining edges in brown or red quadrats in A. The two other quadrats in A (green and purple) represent connections (WFC and CFC) between the brains.

Similar articles

Cited by

References

    1. Acquadro M. A. S., Congedo M., De Riddeer D. (2016). Music performance as an experimental approach to hyperscanning studies. Front. Hum. Neurosci. 10:242. 10.3389/fnhum.2016.00242 - DOI - PMC - PubMed
    1. Adrian E. D. (1926a). The impulses produced by sensory nerve-endings: Part 1. J. Physiol. 61, 49–72. 10.1113/jphysiol.1926.sp002273 - DOI - PMC - PubMed
    1. Adrian E. D. (1926b). The impulses produced by sensory nerve-endings: Part 4. Impulses from pain receptors. J. Physiol. 62, 33–51. 10.1113/jphysiol.1926.sp002334 - DOI - PMC - PubMed
    1. Adrian E. D., Bronk D. W. (1928). The discharge of impulses in motor nerve fibers: Part I. Impulses in single fibers of the phrenic nerve. J. Physiol. 66, 81–101. 10.1113/jphysiol.1928.sp002509 - DOI - PMC - PubMed
    1. Adrian E. D., Bronk D. W. (1929). The discharge of impulses in motor nerve fibers: Part II. The frequency of discharge in reflex and voluntary contractions. J. Physiol. 67, 119–151. - PMC - PubMed

LinkOut - more resources