. 2022;82(5):421.
doi: 10.1140/epjc/s10052-022-10379-w. Epub 2022 May 10.

The matrix optimum filter for low temperature detectors dead-time reduction

Affiliations

The matrix optimum filter for low temperature detectors dead-time reduction

Matteo Borghesi et al. Eur Phys J C Part Fields. 2022.

Abstract

Experiments aiming at high sensitivities usually demand for a very high statistics in order to reach more precise measurements. However, for those exploiting Low Temperature Detectors (LTDs), a high source activity may represent a drawback, if the events rate becomes comparable with the detector characteristic temporal response. Indeed, since commonly used optimum filtering approaches can only process LTDs signals well isolated in time, a non-negligible part of the recorded experimental data-set is discarded and hence constitute the dead-time. In the presented study we demonstrate that, thanks to the matrix optimum filtering approach, the dead-time of an experiment exploiting LTDs can be strongly reduced.


Figures

Fig. 1
Fig. 1
Example of a simulated pulse of a HOLMES microcalorimeter. In its 2.048 ms record window (light-blue in the figure), the pulse is sampled with 1024 points (out of which 100 are of pretrigger) with a sampling frequency of 500 kHz
Fig. 2
Fig. 2
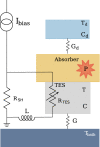
Two-body dangling model for HOLMES microcalorimeter pulses simulation. The TES is represented by the gray body, the absorber part of the microcalorimeter where the 163Ho is implanted is depicted in yellow and the dangling body is illustrated in light-blue. Whenever a 163Ho decay occurs in the absorber, a release of energy E, corresponding to a power P (depicted in red in the scheme), triggers the microcalorimeter response which depends both on the electric and thermal circuit parameters
Fig. 3
Fig. 3
Results of a HOLMES experiment TES simulation: composition of the HOLMES experiment data-set (top); part of raw data flow from a HOLMES microcalorimeter with triggered record windows colored as the classification of the events (bottom)
Fig. 4
Fig. 4
Distribution of arrival times difference (delay) between the triggered pulse and its previous one in bad-baseline events. It follows a quadratic trend
Fig. 5
Fig. 5
Detector responses (R(E)) generated with the application of the standard filter to different sub-sets of the data-set. In yellow R(E) obtained with the complete data-set (good plus all single bad-baseline events), in red R(E) including only bad-baseline single pulses with delay greater than 0.4 ms and in light-blue R(E) considering those with delay greater than 0.8 ms. The plot also shows the Gaussian fit (in black) of the yellow detector response. The values of the Gaussian parameters from the fit are: mean =3000.191±0.005 eV, standard deviation =1.993±0.004 eV and norm =(2.658±0.007)×104
Fig. 6
Fig. 6
Detector responses (R(E)) generated with the application of the matrix filter to different sub-sets of the data-set, by omitting the evaluation of Multi2 events with a delay larger than 1.756 ms. In yellow R(E) obtained with the complete data-set (good plus all bad-baseline and all multiple events), in red R(E) including only bad-baseline and multiple events with delay greater than 0.4 ms and in light-blue R(E) considering those with delay greater than 0.8 ms. The plot also shows the Gaussian fit (in black) of the yellow detector response. The values of the Gaussian parameters from the fit are: mean =3000.132±0.004 eV, standard deviation =2.124±0.003 eV and norm =(4.196±0.008)×104
Fig. 7
Fig. 7
Systematic mν2 shift introduced by ignoring the non Gaussian detector response R(E) (computed for several lower thresholds on the delay with a step of 0.1 ms) caused by the application of both standard (light-blue) and matrix (blue) filters. In this study, in a conservative way, 0.1eV2 was established as maximum acceptable absolute value of the systematic shift on |mν2|
Fig. 8
Fig. 8
Dead-time (fraction of pulses that have to be discarded in the analysis phase) for both standard and matrix filters. Percentages are computed on a pulse-based and not event-based analysis

References

    1. N.E. Booth, B. Cabrera, E. Fiorini, Annu. Rev. Nucl. Part. Sci. 46e (1996). 10.1146/annurev.nucl.46.1.471
    1. E. Gatti, P. Manfredi, Riv. Nuovo Cim. 9N1 (1986). 10.1007/BF02822156
    1. Fowler JW, et al. Am. Astron. Soc. 2015 doi: 10.1088/0067-0049/219/2/35. - DOI
    1. Alpert B, et al. Eur. Phys. J. C. 2015;75(3):112. doi: 10.1140/epjc/s10052-015-3329-5. - DOI - PMC - PubMed
    1. K. Irwin, G. Hilton, Cryog. Part. Det. 99 (2005). 10.1007/10933596_3

LinkOut - more resources