. 2022 Apr 27:14:749991.
doi: 10.3389/fnagi.2022.749991. eCollection 2022.

Bioinformatics Analysis of Publicly Available Single-Nuclei Transcriptomics Alzheimer's Disease Datasets Reveals APOE Genotype-Specific Changes Across Cell Types in Two Brain Regions

Affiliations

Bioinformatics Analysis of Publicly Available Single-Nuclei Transcriptomics Alzheimer's Disease Datasets Reveals APOE Genotype-Specific Changes Across Cell Types in Two Brain Regions

Stella A Belonwu et al. Front Aging Neurosci. .

Abstract

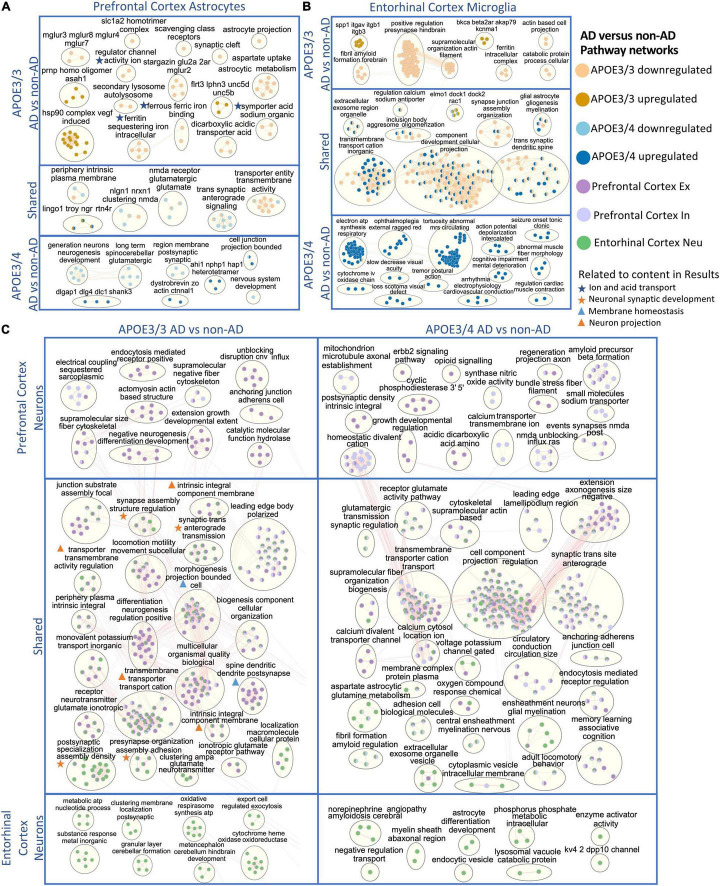
Alzheimer's Disease (AD) is a complex neurodegenerative disease that gravely affects patients and imposes an immense burden on caregivers. Apolipoprotein E4 (APOE4) has been identified as the most common genetic risk factor for AD, yet the molecular mechanisms connecting APOE4 to AD are not well understood. Past transcriptomic analyses in AD have revealed APOE genotype-specific transcriptomic differences; however, these differences have not been explored at a single-cell level. To elucidate more complex APOE genotype-specific disease-relevant changes masked by the bulk analysis, we leverage the first two single-nucleus RNA sequencing AD datasets from human brain samples, including nearly 55,000 cells from the prefrontal and entorhinal cortices. In each brain region, we performed a case versus control APOE genotype-stratified differential gene expression analysis and pathway network enrichment in astrocytes, microglia, neurons, oligodendrocytes, and oligodendrocyte progenitor cells. We observed more global transcriptomic changes in APOE4 positive AD cells and identified differences across APOE genotypes primarily in glial cell types. Our findings highlight the differential transcriptomic perturbations of APOE isoforms at a single-cell level in AD pathogenesis and have implications for precision medicine development in the diagnosis and treatment of AD.

Keywords: APOE; Alzheimer’s disease; RNA-sequencing; differential expression; network enrichment; single-cell.


Conflict of interest statement

YH is a cofounder and scientific advisory board member of Escape Bio, Inc., GABAeron, Inc., and Mederon Bio, LLC. MS is on the advisory board of Aria Pharmaceuticals. The remaining authors declare that the research was conducted in the absence of any commercial or financial relationships that could be construed as a potential conflict of interest.

Figures

FIGURE 1
FIGURE 1
Workflow for sample definition and APOE genotype-stratified cell type-specific differential gene expression analysis and functional enrichment. AD and non-AD cells were determined based on tau tangle (Braak) and amyloid β plaque (CERAD) burden. Cell types were identified, and AD versus non-AD differential expression and pathway network enrichment analyses were performed separately for APOE3/3 and APOE3/4 cells.
FIGURE 2
FIGURE 2
APOE genotype-stratified cell type-specific disease signatures in the prefrontal cortex. (A) AD versus non-AD DEG counts for astrocytes (Ast), excitatory (Ex) and inhibitory (In) neurons, microglia (Mic), oligodendrocytes (Oli), and oligodendrocyte progenitor cells (Opc) in surveyed APOE genotypes. DEGs were selected using a BH adjusted p-value < 0.05 and >20% change in expression. (B) Subset of DEGs shared by both APOE genotypes and their corresponding change in expression. (C) Pairwise DEG plots of DEGs in APOE3/3 and APOE3/4 samples using change in expression. Genes shown are significant and have >20% change in expression in at least one APOE genotype. Colors indicate significance level of DEGs and whether DEGs are unique or shared by APOE genotypes. (D) Change in expression of all genes in the DE analysis clustered by cell type and APOE genotype.
FIGURE 3
FIGURE 3
Shared and unique disease signatures across cell types in APOE3/3 and APOE3/4 prefrontal cortex samples. (A) Upset plots indicating intersections of AD versus non-AD DEGs (BH adjusted p-value < 0.05 and >20% change in expression) across cell types. Rows correspond to cell types. The bar chart shows the number of single and common sets of DEGs across cell types. Single filled dots represent a unique set of DEGs for each cell type. Multiple filled black dots connected by vertical lines represent common sets of DEGs across cell types. DEGs with more overlaps across groups were prioritized for labeling. (B) LINGO1, RASGEF1B, NRXN1 and CLU expression. Asterisks represent meeting both significance (BH adjusted p-value < 0.05) and change in expression (>20%) thresholds. Colors correspond to APOE genotype and AD status.
FIGURE 4
FIGURE 4
APOE genotype-stratified cell type-specific disease signatures in the entorhinal cortex. (A) AD versus non-AD DEG counts for astrocytes (Ast), neurons (Neu), microglia (Mic), oligodendrocytes (Oli), and oligodendrocyte progenitor cells (Opc) in surveyed APOE genotypes. DEGs were selected using a BH adjusted p-value < 0.05 and >20% change in expression. (B) Pairwise DEG plots of DEGs in APOE3/3 and APOE3/4 samples using change in expression. Genes shown are significant and have >20% change in expression in at least one APOE genotype. Colors indicate significance level of DEGs and whether DEGs are unique or shared by APOE genotypes. (C) Subset of DEGs shared by both APOE genotypes and their corresponding change in expression. (D) Change in expression of all genes in the DE analysis clustered by cell type and APOE genotype.
FIGURE 5
FIGURE 5
Shared and unique disease signatures across cell types in APOE3/3 and APOE3/4 entorhinal cortex samples. (A) Upset plots indicating intersections of AD versus non-AD DEGs (BH adjusted p-value < 0.05 and >20% change in expression) across cell types. Rows correspond to cell types. The bar chart shows the number of single and common sets of DEGs across cell types. Single filled dots represent a unique set of DEGs for each cell type. Multiple filled black dots connected by vertical lines represent common sets of DEGs across cell types. A subset of DEGs shared are highlighted to show examples of shared genes. (B) LINGO1, FTL, NRXN1, and ADGRL3 expression. Asterisks represent meeting both significance (BH adjusted p-value < 0.05) and change in expression (>20%) thresholds. Colors represent APOE genotype and diagnosis.
FIGURE 6
FIGURE 6
APOE genotype-stratified cell type-specific disease signatures across brain regions. (A) Upset plots indicating intersections of AD versus non-AD DEGs (BH adjusted p-value < 0.05 and >20% change in expression) within cell types across brain region and APOE genotype. Rows correspond to brain region and APOE genotype pairings. The bar chart shows the number of single and common sets of DEGs across brain regions and APOE genotype pairings. Single filled dots represent a unique set of DEGs for each brain region and APOE genotype pairing. Multiple filled black dots connected by vertical lines represent common sets of DEGs across brain region and APOE genotype pairings. Bar chart colors correspond to whether DEGs are shared between brain regions or APOE genotype using the bottom right key. DEGs with more overlaps across groups were prioritized for labeling. (B) Change in expression of all genes in the DE analysis of both brain regions clustered by cell type, brain region, and APOE genotype.
FIGURE 7
FIGURE 7
Enriched disease pathway networks in APOE3/3 and APOE3/4 cells. AD compared to non-AD functionally enriched pathways with a BH adjusted p-value < 0.01 clustered into biological themes for: (A) astrocytes of the prefrontal cortex, (B) microglia of the entorhinal cortex, and (C) prefrontal cortex excitatory (Ex) and inhibitory (In) neurons, and entorhinal cortex undistinguished neurons (Neu). Lines represent gene set overlaps with magnitude showed by thickness.

References

    1. Allen M., Carrasquillo M. M., Funk C., Heavner B. D., Zou F., Younkin C. S., et al. (2016). Human whole genome genotype and transcriptome data for Alzheimer’s and other neurodegenerative diseases. Sci. Data 3:160089. 10.1038/sdata.2016.89 - DOI - PMC - PubMed
    1. Bik-Multanowski M., Pietrzyk J. J., Midro A. (2015). MTRNR2L12: a candidate blood marker of early Alzheimer’s disease-like dementia in adults with down syndrome. J. Alzheimers Dis. 46 145–150. 10.3233/JAD-143030 - DOI - PMC - PubMed
    1. Bunis D. G., Andrews J., Fragiadakis G. K., Burt T. D., Sirota M. (2020). dittoSeq: universal user-friendly single-cell and bulk RNA sequencing visualization toolkit. Bioinformatics 36 5535–5536. 10.1093/bioinformatics/btaa1011 - DOI - PMC - PubMed
    1. Cario H., Smith D. E. C., Blom H., Blau N., Bode H., Holzmann K., et al. (2011). Dihydrofolate reductase deficiency due to a homozygous DHFR mutation causes megaloblastic anemia and cerebral folate deficiency leading to severe neurologic disease. Am. J. Hum. Genet. 88 226–231. 10.1016/j.ajhg.2011.01.007 - DOI - PMC - PubMed
    1. Chen X., Li X., Wong Y. T., Zheng X., Wang H., Peng Y., et al. (2019). Cholecystokinin release triggered by NMDA receptors produces LTP and sound-sound associative memory. PNAS 116 6397–6406. 10.1073/pnas.1816833116 - DOI - PMC - PubMed