. 2022 Apr 28:13:880288.
doi: 10.3389/fimmu.2022.880288. eCollection 2022.

Establishment of a lncRNA-Based Prognostic Gene Signature Associated With Altered Immune Responses in HCC

Affiliations

Establishment of a lncRNA-Based Prognostic Gene Signature Associated With Altered Immune Responses in HCC

Xiawei Li et al. Front Immunol. .

Abstract

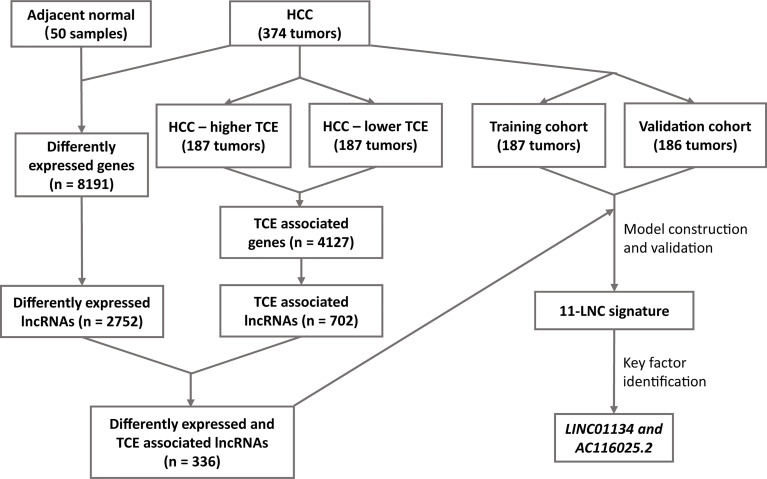
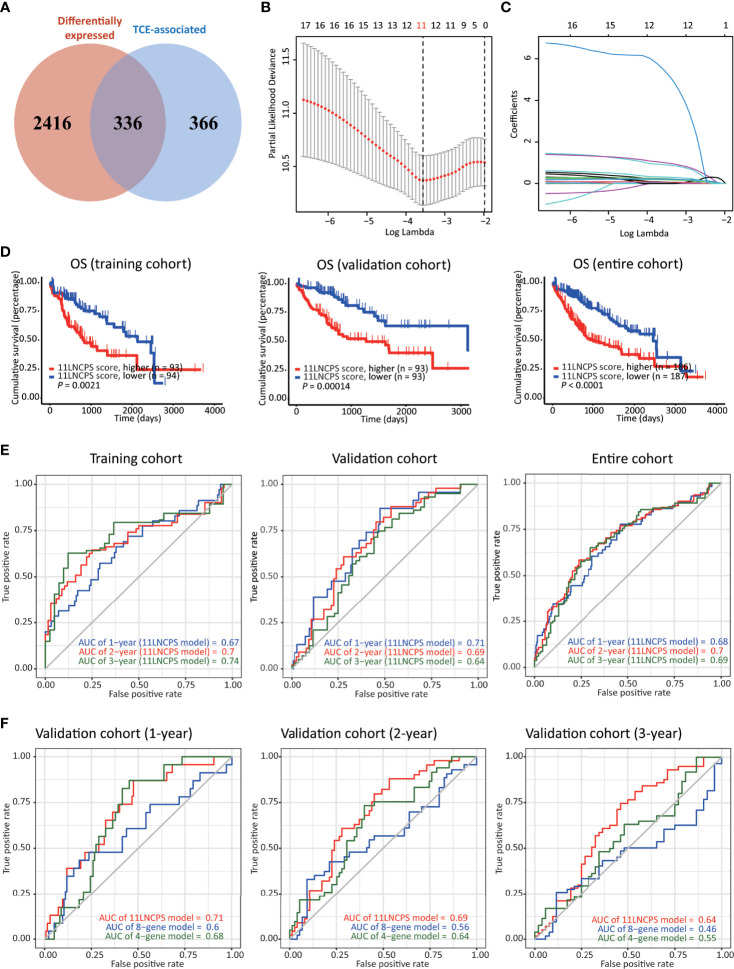
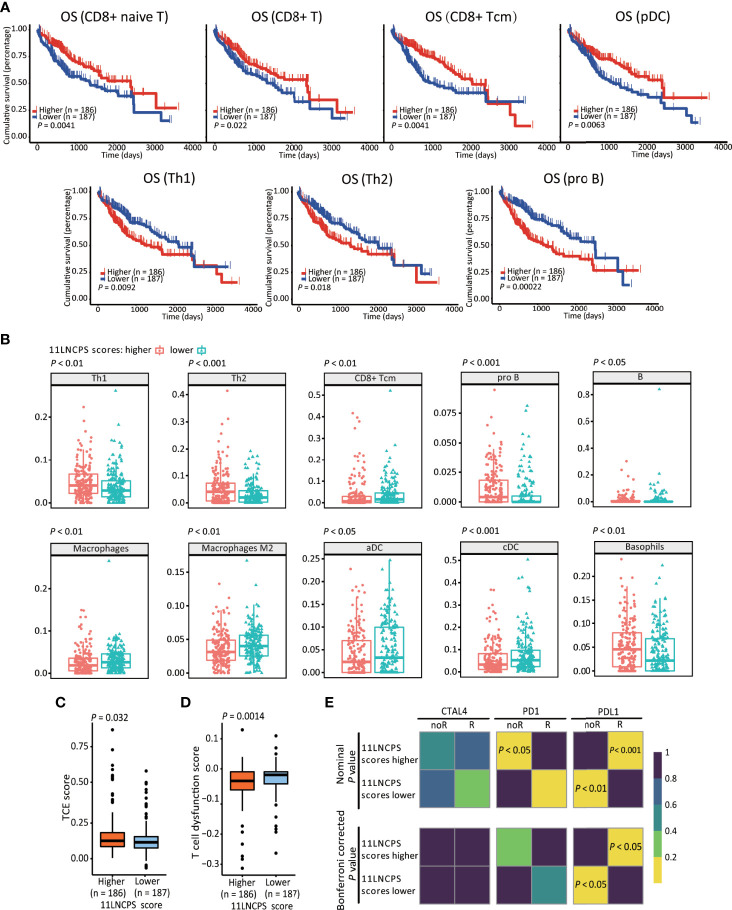
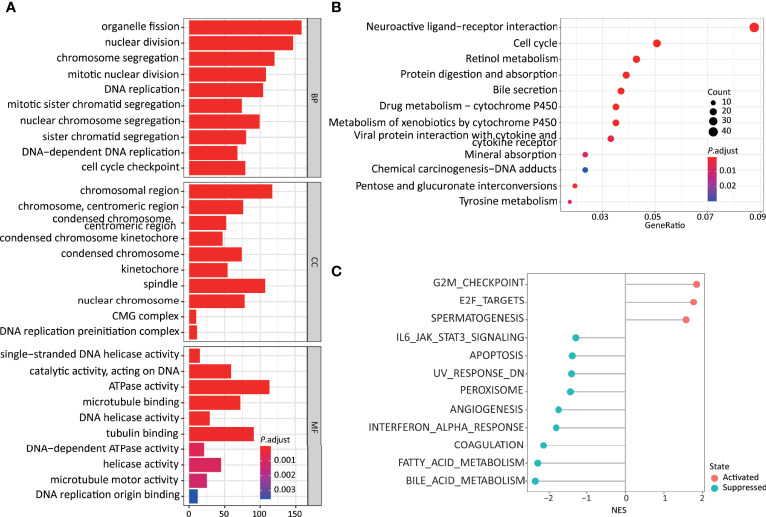
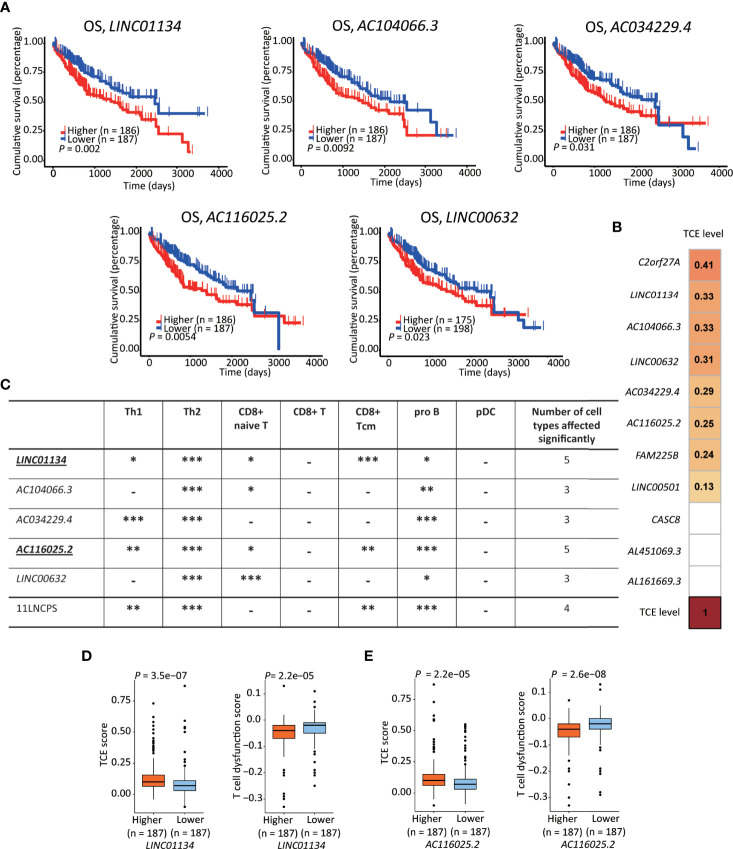
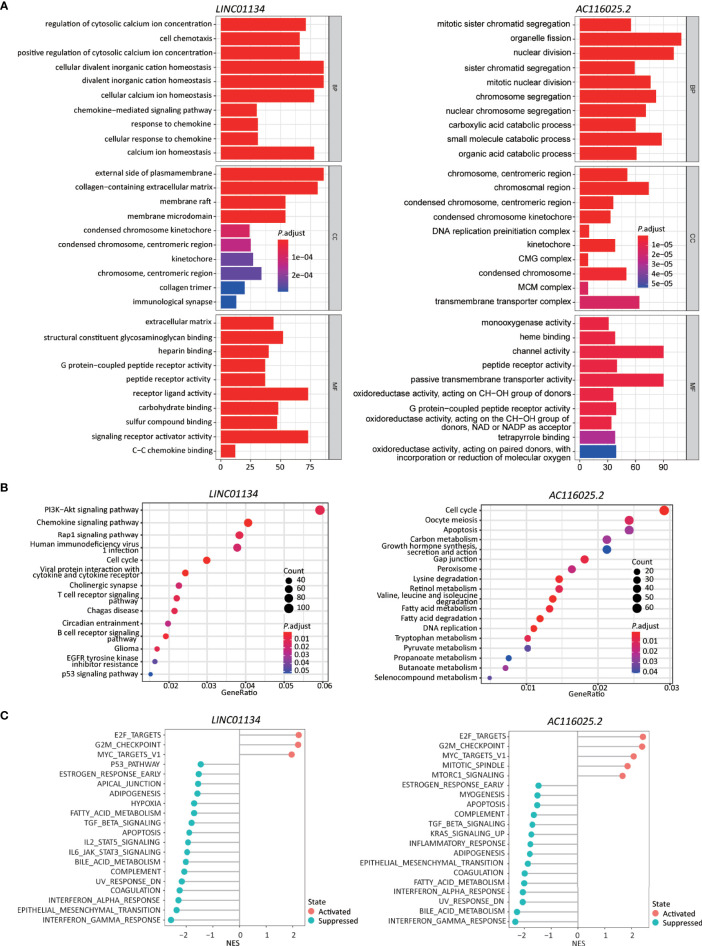
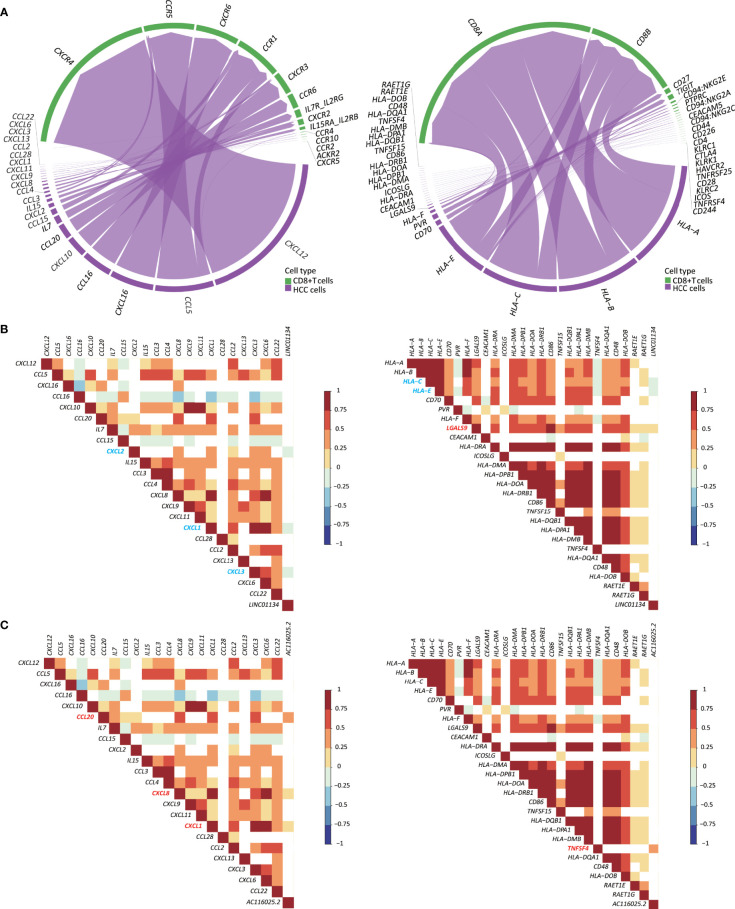
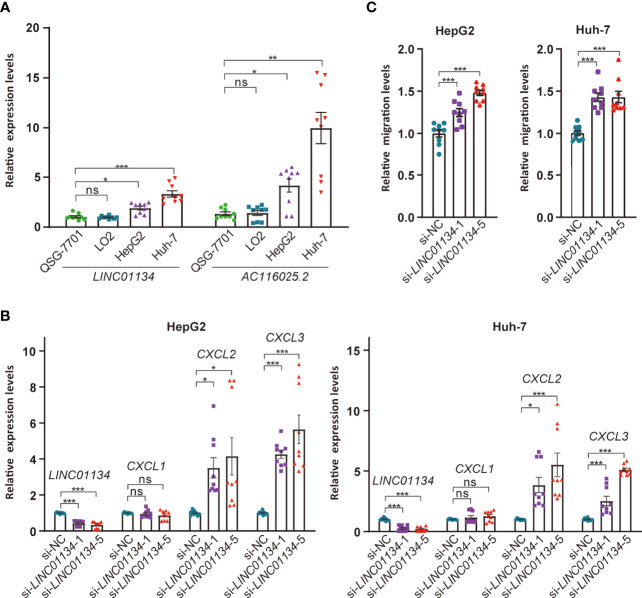
Hepatocellular carcinoma (HCC) is a common malignancy with higher mortality, and means are urgently needed to improve the prognosis. T cell exclusion (TCE) plays a pivotal role in immune evasion, and lncRNAs represent a large group of tumor development and progression modulators. Using the TCGA HCC dataset (n=374), we identified 2752 differentially expressed and 702 TCE-associated lncRNAs, of which 336 were in both groups. As identified using the univariate Cox regression analysis, those associated with overall survival (OS) were subjected to the LASSO-COX regression analysis to develop a prognosis signature. The model, which consisted of 11 lncRNAs and was named 11LNCPS for 11-lncRNA prognosis signature, was validated and performed better than two previous models. In addition to OS and TCE, higher 11LNCPS scores had a significant correlation with reduced infiltrations of CD8+ T cells and dendritic cells (DCs) and decreased infiltrations of Th1, Th2, and pro B cells. As expected, these infiltration alterations were significantly associated with worse OS in HCC. Analysis of published data indicates that HCCs with higher 11LNCPS scores were transcriptomically similar to those that responded better to PDL1 inhibitor. Of the 11LNCPS lncRNAs, LINC01134 and AC116025.2 seem more crucial, as their upregulations affected more immune cell types' infiltrations and were significantly associated with TCE, worse OS, and compromised immune responses in HCC. LncRNAs in the 11LNCPS impacted many cancer-associated biological processes and signaling pathways, particularly those involved in immune function and metabolism. The 11LNCPS should be useful for predicting prognosis and immune responses in HCC.

Keywords: AC116025.2; LINC01134; T cell exclusion; hepatocellular carcinoma (HCC); lncRNA; prognosis.


Conflict of interest statement

The authors declare that the research was conducted in the absence of any commercial or financial relationships that could be construed as a potential conflict of interest.

Figures

Figure 1
Figure 1
The workflow of the study. Expression data of hepatocellular carcinoma (HCC) and adjacent normal liver tissues were compared to identify differentially expressed lncRNAs in HCC. All HCC with expression data were divided into higher and lower T cell exclusion (TCE) levels using the TIDE analysis. Higher- and lower-TCE groups were compared to identify TCE-associated lncRNAs. Differentially expressed and TCE-associated lncRNAs were then merged to identify differently expressed and TCE-associated lncRNAs, which were then subjected to LASSO and multivariate Cox analyses to construct the 11LNCPS predictive of patient survival. LINC01134 and AC116025.2 were then identified as the critical members of the signature.
Figure 2
Figure 2
Construction, validation, and evaluation of an 11-lncRNA signature predictive of prognosis (11LNCPS) in HCC patients. (A) Venn diagram showing the overlapping lncRNAs (n = 336) between lncRNAs differentially expressed in HCC (n = 2752, red) and those associated with T cell exclusion (TCE, n = 702, blue). (B) Partial likelihood deviance of varying numbers of prognostic lncRNAs revealed by the LASSO regression model. The grey lines represent the partial likelihood deviance ± standard error (SE). The two vertical lines represent optimal values based on the minimum criteria and 1-SE criteria. The proper log (Lambda) value was chosen via the minimum criteria. (C) Identification of 11 lncRNAs by the LASSO logistic regression model with non-zero coefficients. (D) The Kaplan–Meier analysis of overall survival (OS) in the training cohort (left), validation cohort (center), and entire cohort (right) cohort of TCGA HCC patients with higher and lower 11LNCPS scores based on the median. The cutoff value of group dividing was the median RS score. (E) Receiver operating characteristic (ROC) curves of the 11LNCPS model for evaluating the predictability of OS in 1, 2, and 3 years in the training cohort (left), validation cohort (center), and entire cohort (right) cohort. (F) Comparison of ROC curves between the 11LNCPS model (red) and the previously established 8-gene model (blue) and 4-gene model (green) for 1, 2, and 3 years OS in the validation cohort.
Figure 3
Figure 3
The 11LNCPS scores predict immune responses in HCC. (A) Increased infiltrations of Th1, Th2, and pro B cells are associated with worse OS, while that of CD8+ Tcm, CD8+ T, and pDC cells with better OS in HCC, as determined by the Kaplan-Meier analysis. (B) The infiltration level is different (P < 0.05) between HCCs with higher 11LNCPS scores (red) and lower scores (blue) for 10 types of immune cells. (C, D) HCCs with higher 11LNCPS scores have higher TCE scores (C) and lower T cell dysfunction scores (D). (E) Higher 11LNCPS scores are associated with better therapeutic responses to immune checkpoint inhibitors (ICIs) in HCC patients. Nominal and Bonferroni corrected P values are shown for the correlation between 11LNCPS scores and ICI responses (CTAL4, PD1, and PD-L1). noR, non-responder; R, responder. Grid colors indicate the correlation P values.
Figure 4
Figure 4
Higher 11LNCPS scores are associated with several cancer hallmarks and immunological characteristics of HCC. (A, B) GO enrichment (A) and KEGG pathway (B) analysis of differentially expressed genes (DEGs) between HCCs with higher and lower 11LNCPS scores. The heights of bars and sizes of dots represent the count of genes, while the colors represent the adjusted P-value. (C) Significantly enriched cancer hallmarks in HCCs with higher 11LNCPS scores, as analyzed by the GSEA. Red and blue dots indicate a pathway’s activation and suppression, respectively. The x-axis shows normalized enrichment scores (NES). All pathways with P values smaller than 0.05 are shown.
Figure 5
Figure 5
LINC01134 and AC116025.2 are the most crucial lncRNAs of the 11LNSPS. (A) An association of higher expression level with worse OS in HCC patients was detected for 5 of the 11LNCPS lncRNAs, including LINC01134, AC104066.3, AC034229.4, AC116025.2, and LINC00632, as determined by the Kaplan-Meier survival analysis. (B) Coefficient values for each lncRNA in the 11LNCPS, as indicated in colored grids and determined by the Spearman analysis. Colored grids indicate those whole expression alterations were statistically significant. (C) Statistical evaluation of the correlation between the infiltration (indicated by an xCell score) of a prognosis-associated immune cell type and expression levels of prognosis-associated lncRNAs in HCC. HCCs were divided into higher and lower groups using its median expression level for each lncRNA, and xCell scores for each immune cell type were compared between the two groups by the Wilcoxon test. The 11LNCPS was used as a control. -P > 0.05; *P ≤ 0.05; **P ≤ 0.01; ***P ≤ 0.001. (D, E) Higher LINC01134 (D) and AC116025.2 (E) levels are associated with higher TCE scores and reduced T cell dysfunction levels in HCC, as analyzed by the TIDE algorithm.
Figure 6
Figure 6
Higher expression levels of LINC01134 and AC116025.2 are associated with several cancer hallmarks and immunological characteristics of HCC. (A, B) GO enrichment (A) and KEGG pathway (B) analyses between HCCs with higher- and lower-levels of LINC01134 (left in each panel) and AC116025.2 (right in each panel). The heights of bars and sizes of dots represent the count of genes, while the colors represent the adjusted P-value. (C) Significantly enriched cancer hallmarks in HCCs with higher expression levels of LINC01134 (left) and AC116025.2 (right), as analyzed by the GSEA. The red and blue colors of dots indicate a pathway’s activation and suppression, respectively. The x-axis shows normalized enrichment scores (NES). All pathways with P values smaller than 0.05 are shown.
Figure 7
Figure 7
Expression of LINC01134 and AC116025.2 is associated with the expression of some cytokines, chemokines, and immune checkpoint (ICP) ligands in HCC. (A) The chord diagram shows heterotypic signal transduction between HCC cells (purple) and CD8+ T cells (green), with purple arrows pointing from cytokines and chemokines (left) or ICP ligands (right) in HCC cells to their respective receptors in CD8+ T cells. (B, C) Expression of LINC01134 (B) and AC116025.2 (C) is associated with the expression of some cytokines and chemokines (left) or ICP ligands (right), as determined by the Spearman analysis. Grid colors and gradient color bars indicate Spearman coefficient values, with white color indicating a lack of statistical significance. Cytokines, chemokines, and ICP ligands with a positive association with LINC01134 or AC116025.2 expression are marked by red, while those with a negative correlation are marked by blue.
Figure 8
Figure 8
Expression and functional tests of key member lncRNAs of the 11LNCPS in HCC cell lines. (A) Expression of LINC01134 and AC116025.2 in normal liver cell lines QSG-7701 and LO2 and HCC cell lines HepG2 and Huh-7, as detected by qRT-PCR. Data were normalized by β-actin mRNA levels and standardized by the control group levels. (B) Knockdown of LINC01134 in HepG2 (left) and Huh-7 (right) HCC cells increased the expression of CXCL2 and CXCL3, as detected by qRT-PCR. (C) Knockdown of LINC01134 in HepG2 (left) and Huh-7 (right) HCC cells increased the migration of Jurkat T cells, as detected by the transwell assay. ns, P > 0.05; *P ≤ 0.05; **P ≤ 0.01; ***P ≤ 0.001.

References

    1. Zhang Y, Zhang L, Xu Y, Wu X, Zhou Y, Mo J. Immune-Related Long Noncoding RNA Signature for Predicting Survival and Immune Checkpoint Blockade in Hepatocellular Carcinoma. J Cell Physiol (2020) 235(12):9304–16. doi: 10.1002/jcp.29730 - DOI - PubMed
    1. Sung H, Ferlay J, Siegel RL, Laversanne M, Soerjomataram I, Jemal A, et al. Global Cancer Statistics 2020: GLOBOCAN Estimates of Incidence and Mortality Worldwide for 36 Cancers in 185 Countries. CA Cancer J Clin (2021) 71(3):209–49. doi: 10.3322/caac.21660 - DOI - PubMed
    1. Fu Y, Liu S, Zeng S, Shen H. From Bench to Bed: The Tumor Immune Microenvironment and Current Immunotherapeutic Strategies for Hepatocellular Carcinoma. J Exp Clin Cancer Res (2019) 38(1):396. doi: 10.1186/s13046-019-1396-4 - DOI - PMC - PubMed
    1. Yang JD, Heimbach JK. New Advances in the Diagnosis and Management of Hepatocellular Carcinoma. BMJ (2020) 371:m3544. doi: 10.1136/bmj.m3544 - DOI - PubMed
    1. Olson B, Li Y, Lin Y, Liu ET, Patnaik A. Mouse Models for Cancer Immunotherapy Research. Cancer Discov (2018) 8(11):1358–65. doi: 10.1158/2159-8290.CD-18-0044 - DOI - PMC - PubMed

Publication types