

Exposure to Antibacterial Chemicals Is Associated With Altered Composition of Oral Microbiome
- PMID: 35572708
- PMCID: PMC9096491
- DOI: 10.3389/fmicb.2022.790496
Exposure to Antibacterial Chemicals Is Associated With Altered Composition of Oral Microbiome
Abstract
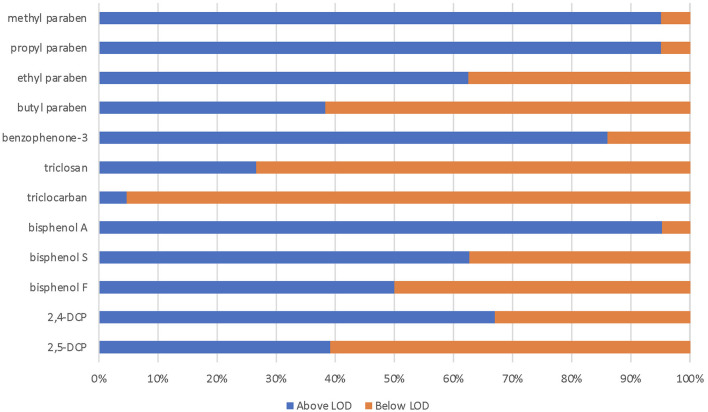
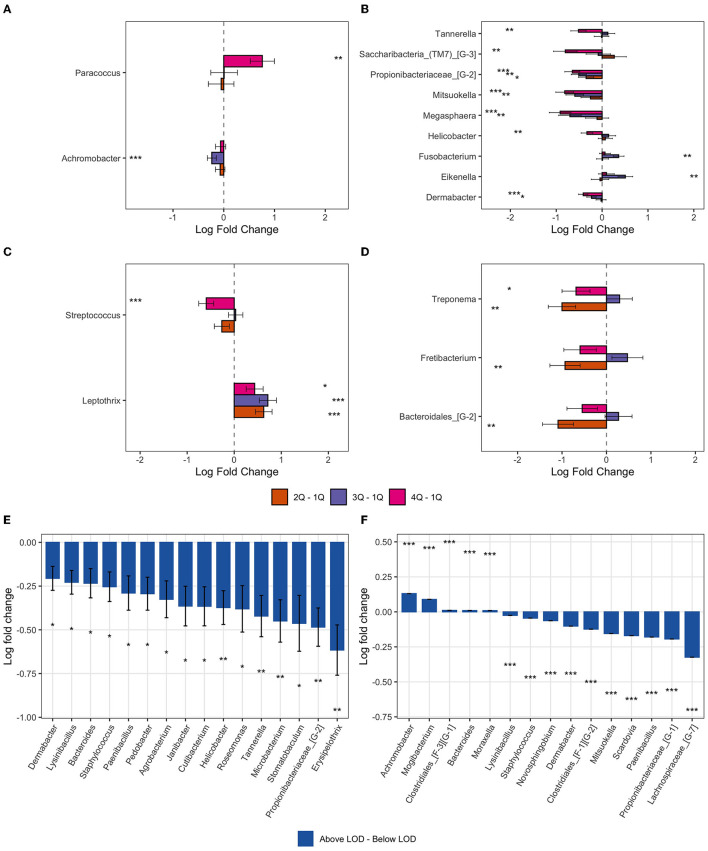
Antimicrobial chemicals are used as preservatives in cosmetics, pharmaceuticals, and food to prevent the growth of bacteria and fungi in the products. Unintentional exposure in humans to such chemicals is well documented, but whether they also interfere with human oral microbiome composition is largely unexplored. In this study, we explored whether the oral bacterial composition is affected by exposure to antibacterial and environmental chemicals. Gingival fluid, urine, and interview data were collected from 477 adults (18-47 years) from the RHINESSA study in Bergen, Norway. Urine biomarkers of triclosan, triclocarban, parabens, benzophenone-3, bisphenols, and 2,4- and 2,5-dichlorophenols (DCPs) were quantified (by mass spectrometry). Microbiome analysis was based on 16S amplicon sequencing. Diversity and differential abundance analyses were performed to identify how microbial communities may change when comparing groups of different chemical exposure. We identified that high urine levels (>75th percentile) of propyl parabens were associated with a lower abundance of bacteria genera TM7 [G-3], Helicobacter, Megasphaera, Mitsuokella, Tannerella, Propionibacteriaceae [G-2], and Dermabacter, as compared with low propylparaben levels (<25th percentile). High exposure to ethylparaben was associated with a higher abundance of Paracoccus. High urine levels of bisphenol A were associated with a lower abundance of Streptococcus and exposure to another environmental chemical, 2,4-DCP, was associated with a lower abundance of Treponema, Fretibacterium, and Bacteroidales [G-2]. High exposure to antibacterial and environmental chemicals was associated with an altered composition of gingiva bacteria; mostly commensal bacteria in the oral cavity. Our results highlight a need for a better understanding of how antimicrobial chemical exposure influences the human microbiome.
Keywords: ANCOM-BC; RHINESSA; chemicals; differential abundance; oral microbiome.
Copyright © 2022 Vindenes, Lin, Shigdel, Ringel-Kulka, Real, Svanes, Peddada and Bertelsen.
Conflict of interest statement
The authors declare that the research was conducted in the absence of any commercial or financial relationships that could be construed as a potential conflict of interest.
Figures
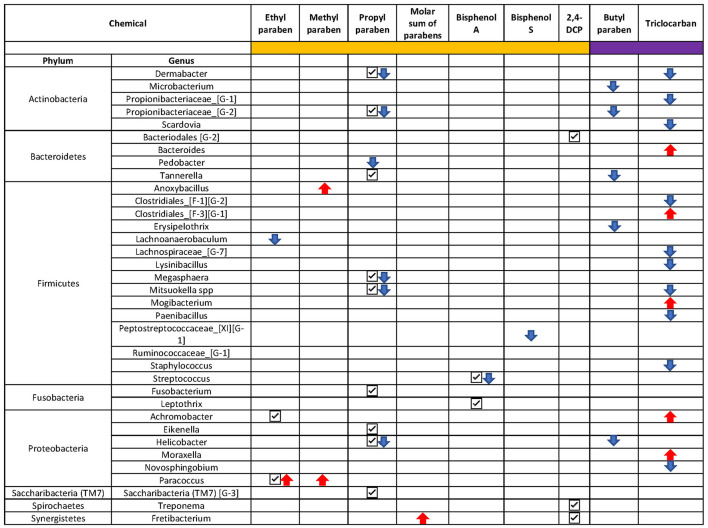
 ”: taxon was identified to be monotonically decreasing as the increase of the chemical concentration; upward arrow “
 ”: taxon was identified to be monotonically increasing as the chemical concentration increased.
References
-
- Ainamo J., Barmes D., Beagrie G., Cutress T., Martin J., Sardo-Infirri J. (1982). Development of the World Health Organization (WHO) community periodontal index of treatment needs (CPITN). Int Dent J. 32, 281–291. - PubMed
-
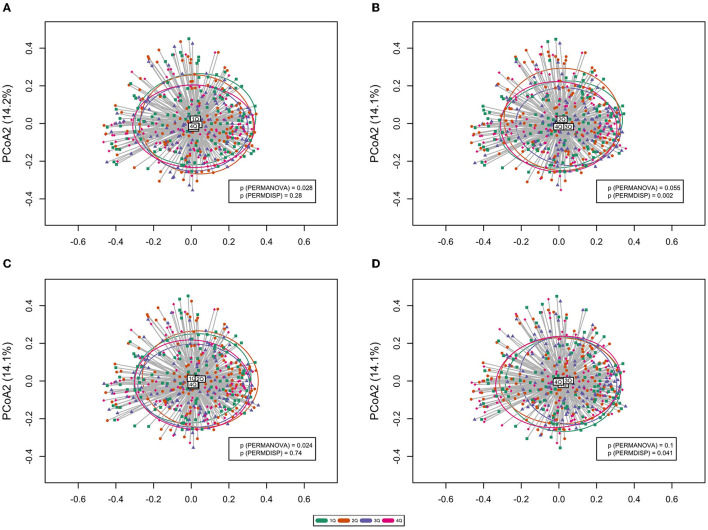
- Anderson M. J., Walsh D. C. I. (2013). PERMANOVA, ANOSIM, and the Mantel test in the face of heterogeneous dispersions: What null hypothesis are you testing? Ecol. Monographs. 83, 557–574. 10.1890/12-2010.1 - DOI
-
- Artacho-Cordon F., Arrebola J.P., Nielsen O., Hernandez P., Skakkebaek N.E., Fernandez M.F., et al. . (2017). Assumed non-persistent environmental chemicals in human adipose tissue; matrix stability and correlation with levels measured in urine and serum. Environ Res. 156, 120–127. 10.1016/j.envres.2017.03.030 - DOI - PubMed
-
- Barbour S.E., Nakashima K., Zhang J.B., Tangada S., Hahn C.L., Schenkein H.A., et al. . (1997). Tobacco and smoking: environmental factors that modify the host response (immune system) and have an impact on periodontal health. Crit. Rev. Oral Biol. Med. 8, 437–460. 10.1177/10454411970080040501 - DOI - PubMed
Associated data
LinkOut - more resources
Full Text Sources
Miscellaneous