. 2022 Apr 12:25:311-330.
doi: 10.1016/j.omtm.2022.03.018. eCollection 2022 Jun 9.

Pharmacological interventions enhance virus-free generation of TRAC-replaced CAR T cells

Affiliations

Pharmacological interventions enhance virus-free generation of TRAC-replaced CAR T cells

Jonas Kath et al. Mol Ther Methods Clin Dev. .

Abstract

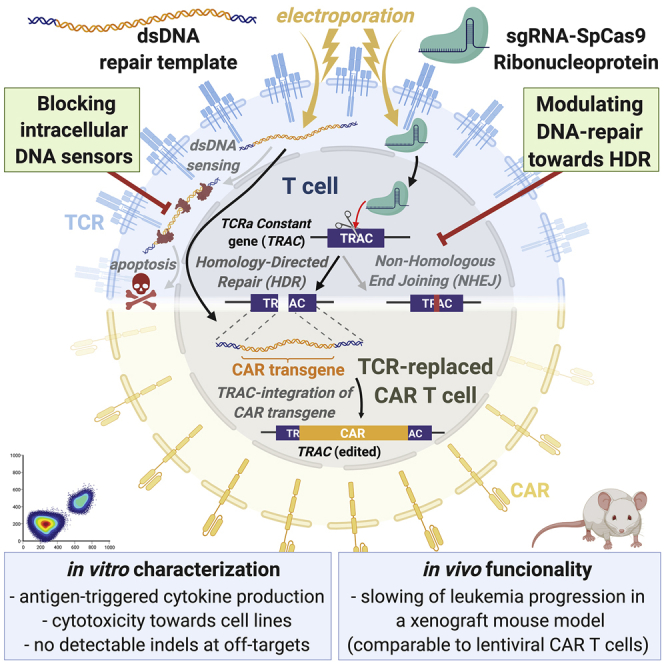
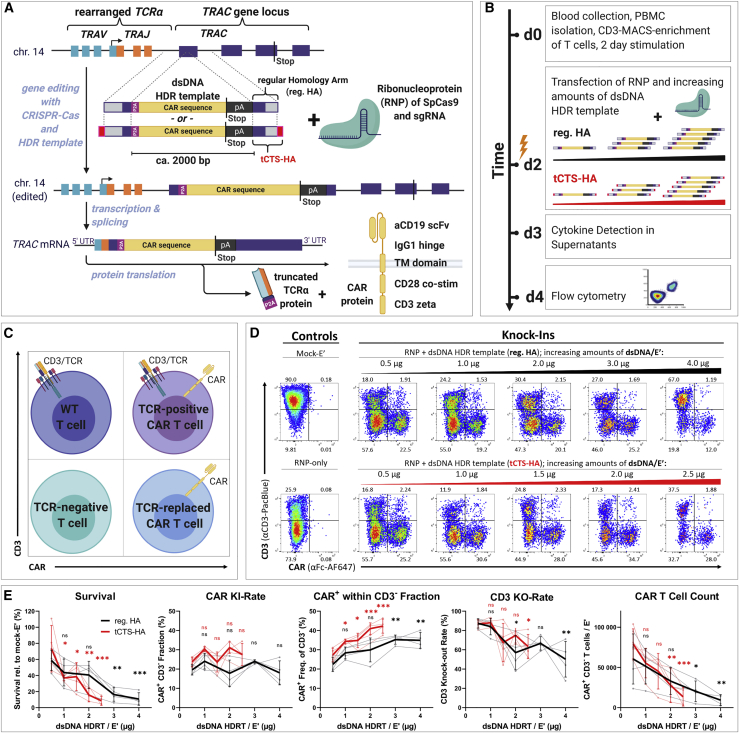
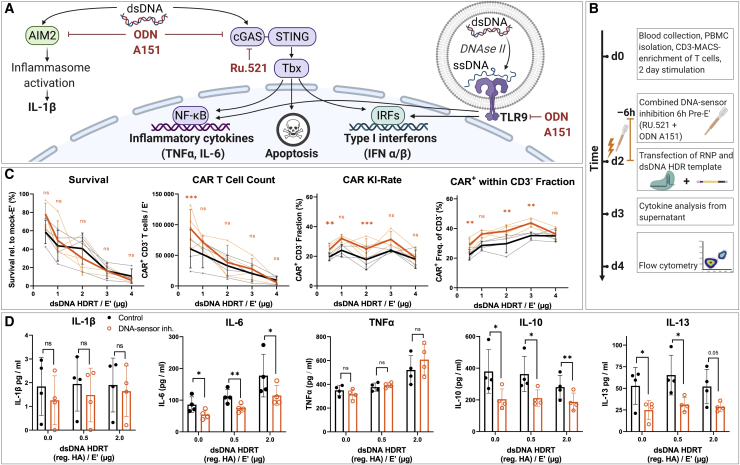
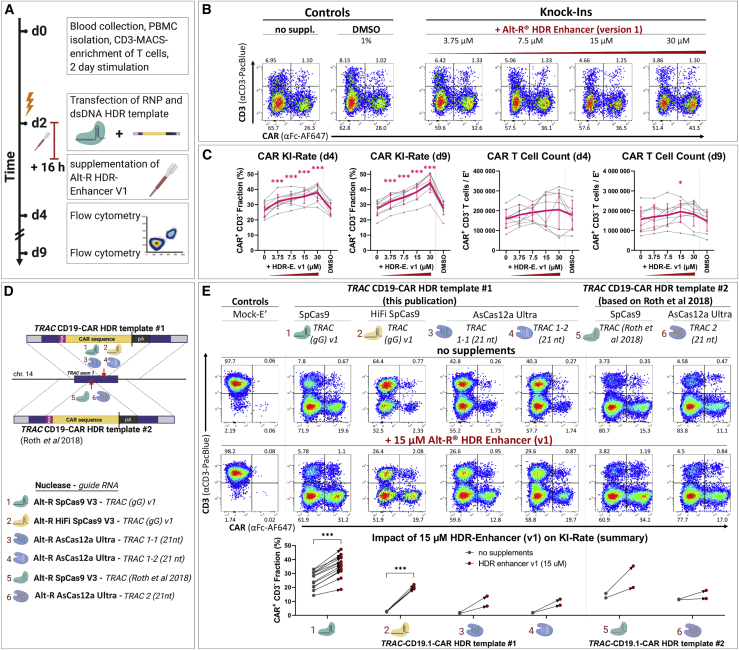
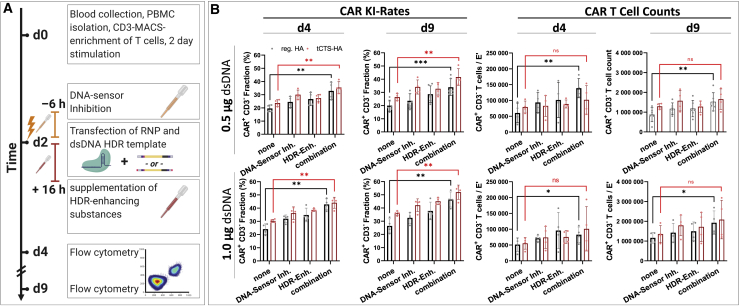
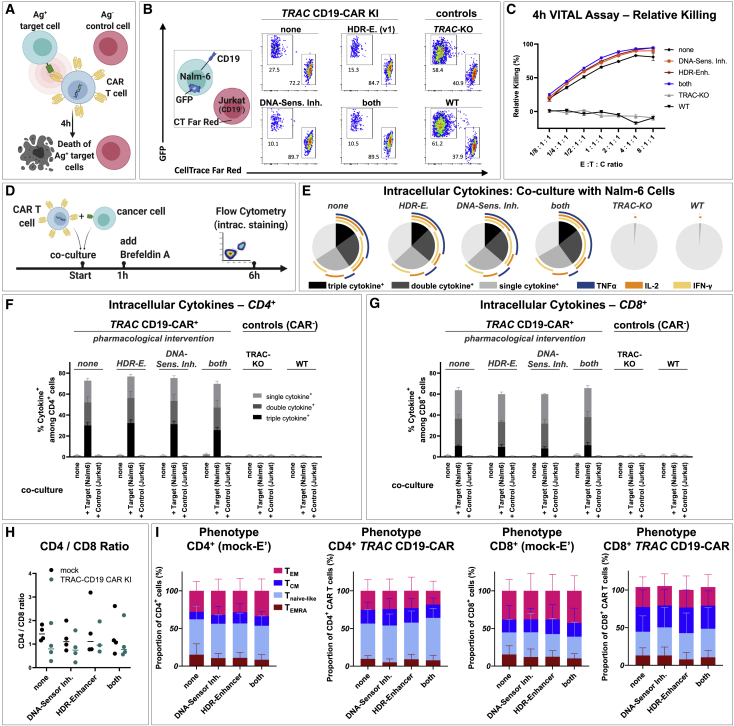
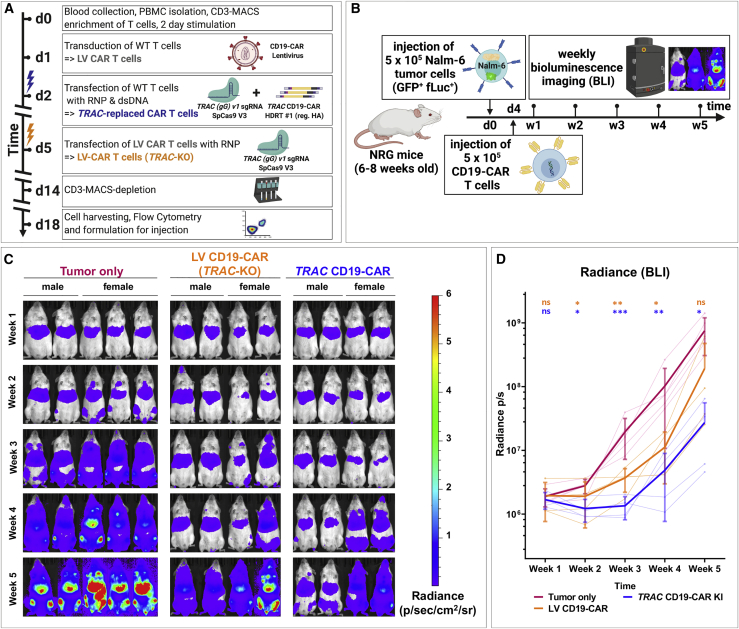
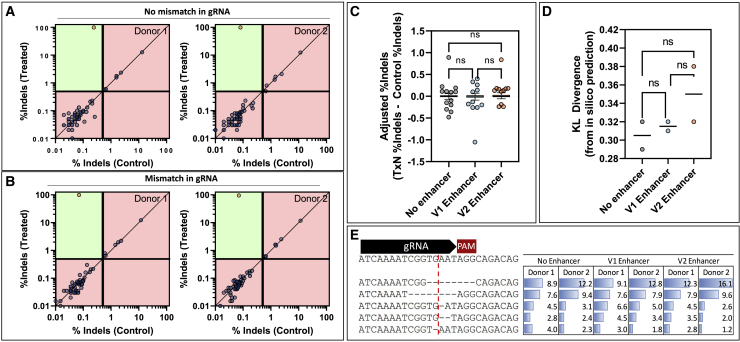
Chimeric antigen receptor (CAR) redirected T cells are potent therapeutic options against hematological malignancies. The current dominant manufacturing approach for CAR T cells depends on retroviral transduction. With the advent of gene editing, insertion of a CD19-CAR into the T cell receptor (TCR) alpha constant (TRAC) locus using adeno-associated viruses for gene transfer was demonstrated, and these CD19-CAR T cells showed improved functionality over their retrovirally transduced counterparts. However, clinical-grade production of viruses is complex and associated with extensive costs. Here, we optimized a virus-free genome-editing method for efficient CAR insertion into the TRAC locus of primary human T cells via nuclease-assisted homology-directed repair (HDR) using CRISPR-Cas and double-stranded template DNA (dsDNA). We evaluated DNA-sensor inhibition and HDR enhancement as two pharmacological interventions to improve cell viability and relative CAR knockin rates, respectively. While the toxicity of transfected dsDNA was not fully prevented, the combination of both interventions significantly increased CAR knockin rates and CAR T cell yield. Resulting TRAC-replaced CD19-CAR T cells showed antigen-specific cytotoxicity and cytokine production in vitro and slowed leukemia progression in a xenograft mouse model. Amplicon sequencing did not reveal significant indel formation at potential off-target sites with or without exposure to DNA-repair-modulating small molecules. With TRAC-integrated CAR+ T cell frequencies exceeding 50%, this study opens new perspectives to exploit pharmacological interventions to improve non-viral gene editing in T cells.

Keywords: CAR T cells; CRISPR-Cas9; HDR; TRAC; adoptive T cell therapy; chimeric antigen receptor; gene editing; knockin; non-viral cell manufacturing.


Conflict of interest statement

As part of a collaboration agreement between Charité Universitätsmedizin Berlin and Integrated DNA Technologies (IDT), IDT provided certain reagents (HDR enhancer v.2 and TRAC sgRNA used in some experiments) and performed GUIDE-seq analysis, HDR-enhancing small-molecule screen in Jurkat cells, and targeted sequencing of potential off-target sites. R.T., B.T., M.L.S., G.L.K., and A.M.J. are employees of IDT, which offers reagents for sale similar to some of the compounds described in the manuscript. Products and tools supplied by IDT are for research use only and not intended for diagnostic or therapeutic purposes. Purchaser and/or user are solely responsible for all decisions regarding the use of these products and any associated regulatory or legal obligations. Lonza GmbH provided 96-well 4D-Nucleofector unit and some nucleofection reagents. A.W. and L. Akyüz are part-time employees of CheckImmune GmbH. A.R. and U.E.H. filed a patent application WO 2017211900A1 “Chimeric antigen receptor and CAR T cells that bind BCMA” related to the work with the BCMA-CAR disclosed in this paper. A.R. and U.E.H. have received research funding from Fate Therapeutics for work unrelated to the data generated in the manuscript.

Figures

None
Graphical abstract
Figure 1
Figure 1
Low dosages of transfected dsDNA donor templates reduce toxicity during non-viral CAR T reprogramming Virus-free insertion of a 2-kb-sized CD19-CAR transgene into the human TRAC locus. (A) Design of dsDNA donor templates is shown. The transgene is composed of a P2A self-cleavage site, the CAR encoding sequence followed by a STOP codon, and a bGH-derived polyadenylation site (pA). Two template formats are used: the transgene flanked by regular homology arms (reg. HA, black) or homology arms with additional truncated Cas9 target sequences (tCTS-HA, red). (B) Experimental setup to evaluate co-electroporation of RNPs and escalating doses of dsDNA donor templates with modified (tCTS-HA) and reg. HA is shown. (C and D) Representative flow cytometry plots showing editing outcomes 2 days after co-electroporation of RNP and escalating amounts of dsDNA donor templates of both HA formats. (E) Summary of flow cytometric analysis 2 days after electroporation (n = 4 healthy donors in two independent experiments). Black and red indicate the use of dsDNA HDRTs of reg. HA or tCTS-HA format, respectively. Thick lines indicate mean values. Error bars indicate standard deviation. Thin lines connect single data points from one healthy donor over the different dsDNA amounts. Statistical analysis was performed using ordinary one-way ANOVA with subsequent Dunn’s correction (for multiple testing) comparing values for each HDRT amount with 0.5 μg HDRT as reference. Asterisks in this and all further figures represent different p values calculated in the respective statistical tests (not significant [ns]: p > 0.5; ∗p < 0.05; ∗∗p < 0.01; ∗∗∗p < 0.001).
Figure 2
Figure 2
DNA-sensor inhibition increases relative CAR insertion rate with minimal improvement of survival at optimized dsDNA donor dosage (A) Illustration of common DNA-sensing pathways (in immune cells) that induce downstream cytokine production and the presumed mode of action of different DNA sensor inhibitors used in subsequent experiments. (B) Experimental setup for the combined addition of TLR-9 inhibitor ODN A151 and the cGAS-inhibitor RU.521 with escalating amounts of dsDNA donor templates is shown (as in Figure 1B). DNA sensor inhibitors were supplemented together into the medium 6 h prior to co-electroporation of RNP and reg. HA dsDNA donor templates. (C) Summary of flow cytometric analysis 2 days after electroporation. Data were obtained in parallel to controls presented in Figures 1D–1G (n = 4 healthy donors in two independent experiments). Editing outcomes of T cells that received combined DNA-sensor inhibition prior to electroporation are shown in orange. Black indicates the control values from Figure 1E. Thick lines indicate mean values; error bars indicate standard deviation. Light dots represent individual values. Light lines connect these for each donor. Descriptive statistical analysis was performed using paired, two-tailed Student’s t tests comparing values for DNA-sensor inhibition with values for no intervention. (D) Summary of supernatant analysis 24 h post-electroporation for cytokines associated with DNA sensing: IL-1β (lower limit of detection [LOD]: 0.85 pg/mL), IL-6 (lower LOD: 0.13 pg/mL), and TNF-α (lower LOD: 0.05 pg/mL) as well as the Th2-associated cytokines IL-10 (lower LOD: 0.01 pg/mL) and IL-13 (lower LOD: 0.27 pg/mL). Descriptive statistical analysis was performed as for (C).
Figure 3
Figure 3
HDR-enhancing compound improves CAR integration rates in primary human T cells (A) Experimental setup. (B) Representative flow cytometry plots showing the effects of HDR enhancer (v.1), supplemented in different concentrations, on editing outcomes 2 days after electroporation are shown. (C) Data summary from experiments presented in (A) and (B), 2 and 7 days after electroporation (n = 9 biol. replicates in three independent experiments) are shown. Purple indicates mean ± SD. Light gray indicates individual data points. Statistical analysis was performed using repeated-measures one-way ANOVA with Geisser-Greenhouse correction followed by Dunnett’s multiple comparison test. (D) Scheme illustrating two dsDNA donor templates of regular HA format for integration of a CD19-CAR at two distinct sites of the TRAC locus is shown. CAR integration is assisted by three different Cas nucleases pre-complexed with different guide RNAs, summing up to six distinct RNPs. (E) Representative flow cytometry and summary plots from experiments outlined in (D) show the effect of HDR enhancer (v.1) on CAR integration rates 7 days after electroporation of six different HDRT/RNP combinations. For RNP/HDRT combinations 1 and 2, statistical analysis was performed using a paired, two-tailed Student’s t test comparing values for no intervention with values for HDR enhancer (v.1).
Figure 4
Figure 4
Synergy of DNA-sensor inhibition and HDR enhancer improves efficiency and yield of TRAC-replaced CAR T cell generation (A) Experimental setup adding the combination of DNA-sensor inhibition and HDR enhancement as an additional dimension to the setup originally presented in Figure 1, Figure 2E and 2C. DNA-sensor inhibition was performed with the compounds ODN A151 and RU.521 6 h prior to electroporation. After electroporation, cells were cultured in HDR enhancer v.1 supplemented medium (15 μM) for 16 h. (B) Summary of relative CAR integration rates and CAR T cell counts on day 4 and day 9 with 0.5 μg or 1.0 μg of dsDNA donor templates of both formats is shown (reg. HA, black; tCTS-HA, red). Data were obtained in parallel to controls presented in Figure 1E from four biological replicates. Furthermore, data from one additional experiment with two biological replicates only analyzed on day 9 were also included. Bars respresent mean ± SD. Statistical analysis was performed using paired, two-tailed Student's t test comparing values for no intervention (“none”) with values for a combined pharmacological interventino (“both”).
Figure 5
Figure 5
Functional in vitro characterization of TRAC-integrated CD19-CAR T cells after drug-assisted gene transfer CAR T cell generated with no drug assistance (none), with HDR enhancer (v.1) (“HDR-E.”), DNA-sensor inhibition (“HDR-Sens. Inh.”), or the combination of both approaches (both) were assessed for possible differences in cytotoxicity, cytokine production, and phenotype. (A) Experimental setup of a flow cytometric VITAL assay is shown. (B) Representative flow cytometry dot plots of viable target (T) and control (C) cells after 4 h co-culture with effecter (E) CD19-CAR T cells for the highest E:T:C ratio tested (8:1:1) are shown. Nalm-6 cells (CD19+, GFP+) served as target cells. Jurkat cells (CD19, CellTrace Far Red labeled) served as control cells. (C) Summary of VITAL assay results as shown in (B) (n = 3 techn. replicates) is shown. (D) Experimental setup for detection of intracellular cytokines after T cell stimulation is shown. (E) Summary of intracellular cytokine staining of bulk (CAR) T cells after co-culture with CD19+ Nalm-6 cells is shown. Boolean gating was used to identify cells that produce one, two, or three of the following cytokines: interferon (IFN)-γ, IL-2, and TNFα (n = 3 donors). (F and G) Summary of intracellular cytokine staining for CD4+ (F) and CD8+ (G) (CAR) T cells alone or after co-culture with target (Nalm6) or control (Jurkat) cells is shown. (H and I) CD4/CD8 ratio (H) and summary of CAR T cell phenotype (I) on day 9 after electroporation (n = 2 donors in techn. duplicates). TEMRA: CD45RA+, CCR7; Tnaive-like: CD45RA+ CCR7+; TCM: CD45RA, CCR7+; TEM: CD45RA, CCR7.
Figure 6
Figure 6
Virus-free generated TRAC-replaced CAR T cells slow leukemia progression in vivo Comparison of the therapeutic efficacies between TRAC-replaced and lentivirally transduced CD19-CAR T cells in a pre-B acute lymphoblastic leukemia xenograft mouse model. (A) Experimental setup for generation of TCR-negative CAR T cells by virus-free TRAC replacement with CD19-CAR or lentiviral transduction (LV CAR T cells) followed by TRAC-KO is shown. Prior to formulation, remaining TCR/CD3-positive T cells were depleted by MACS cell separation technology. (B) Experimental setup for Nalm-6 xenograft model. Eight-week-old Nod.Rag.Gamma (NRG) mice were challenged i.v. with 5 × 105 Nalm-6/GFP/fLuc cells. Mice not receiving leukemia (“no tumor”) were used as controls for analyses. Four days after leukemia challenge, mice were randomized among three cohorts: (1) injected i.v. with phosphate-buffered saline (PBS) (corresponding to the “tumor only” group), (2) injected i.v. with 5 × 105 CD19-CAR T cells generated via lentiviral transfer and consecutive TRAC KO (“LV-CD19CAR”), and (3) injected i.v. with 5 × 105 CD19-specific TCR-deficient CAR T cells generated by TRAC replacement (“TRAC CD19-CAR”). The residual CD3+ T cells were depleted from both types of CAR T cell types prior to infusion. Mice were monitored for disease severity every 2 to 3 days, and body weights were measured weekly. Leukemia engraftment, bio-distribution, and progression were assessed by weekly bioluminescence imaging (BLI) analyses. The experimental endpoint was 5 weeks after leukemia challenge. (C) BLI of all mice over a 5-week observation period is shown. BLI pictures were generated sequentially from weeks 1 to 5. Frontal pictures of mice are shown, with bioluminescence signal radiance (photons/s/cm2/sr) depicted by the color barcode on the right side. (D) Quantification of leukemia spread by BLI is shown. Radiance (photons/s) depicts each pixel summed over the regions of interest (ROIs) area containing the whole frontal side of the body. Statistical analysis comparing each cohort with the tumor only cohort at each time point was performed after log transformation using a repeated-measures two-way ANOVA with Geisser-Greenhouse correction followed by Dunnett’s multiple comparison test.
Figure 7
Figure 7
Characterization of off-target editing and effects of DNA-repair modulators Editing was quantified using CRISPAltRations at all nominated on- or off-target loci for two healthy donors with paired treatment or controls after being edited with the TRAC guide (A) without a mismatch in the gRNA or (B) with a mismatch in the gRNA. Sites were classified as edited (orange circle) or not edited (blue circle) using a thresholded Fisher’s exact test (p < 0.05) with classification limitations. Green areas indicate areas capable of classification, whereas red areas indicate areas outside classification limits (indels in treatment <0.5%; indels in control >0.4%; <5,000 reads). Using the gRNA with no mismatch, the effects of HDR enhancing small molecules on (C) off-target editing and (D) on-target indel profiles, measured as KL divergence from FORECasT predictions, were investigated (one-way ANOVA with post-hoc Tukey’s correction; p < 0.05). (E) The contributions of the top five indels for the no enhancer sample are shown for each donor and treatment (cut site shown as red line).

References

    1. Grupp S.A., Kalos M., Barrett D., Aplenc R., Porter D.L., Rheingold S.R., Teachey D.T., Chew A., Hauck B., Wright J.F., et al. Chimeric antigen receptor-modified T cells for acute lymphoid leukemia. N. Engl. J. Med. 2013;368:1509–1518. - PMC - PubMed
    1. Schuster S.J., Bishop M.R., Tam C.S., Waller E.K., Borchmann P., McGuirk J.P., Jäger U., Jaglowski S., Andreadis C., Westin J.R., et al. Tisagenlecleucel in adult relapsed or refractory diffuse large B-cell lymphoma. N. Engl. J. Med. 2019;380:45–56. - PubMed
    1. Raje N., Berdeja J., Lin Y., Siegel D., Jagannath S., Madduri D., Liedtke M., Rosenblatt J., Maus M.V., Turka A., et al. Anti-BCMA CAR T-cell therapy bb2121 in relapsed or refractory multiple myeloma. N. Engl. J. Med. 2019;380:1726–1737. - PMC - PubMed
    1. Brudno J.N., Maric I., Hartman S.D., Rose J.J., Wang M., Lam N., Stetler-Stevenson M., Salem D., Yuan C., Pavletic S., et al. T cells genetically modified to express an anti–B-cell maturation antigen chimeric antigen receptor cause remissions of poor-prognosis relapsed multiple myeloma. J. Clin. Oncol. 2018;36:2267–2280. - PMC - PubMed
    1. Ahmed N., Brawley V., Hegde M., Bielamowicz K., Kalra M., Landi D., Robertson C., Gray T.L., Diouf O., Wakefield A., et al. HER2-Specific chimeric antigen receptor–modified virus-specific T cells for progressive glioblastoma. JAMA Oncol. 2017;3:1094–1101. - PMC - PubMed