. 2022 Apr 13:25:344-359.
doi: 10.1016/j.omtm.2022.04.007. eCollection 2022 Jun 9.

Pre-clinical data supporting immunotherapy for HIV using CMV-HIV-specific CAR T cells with CMV vaccine

Affiliations

Pre-clinical data supporting immunotherapy for HIV using CMV-HIV-specific CAR T cells with CMV vaccine

Min Guan et al. Mol Ther Methods Clin Dev. .

Abstract

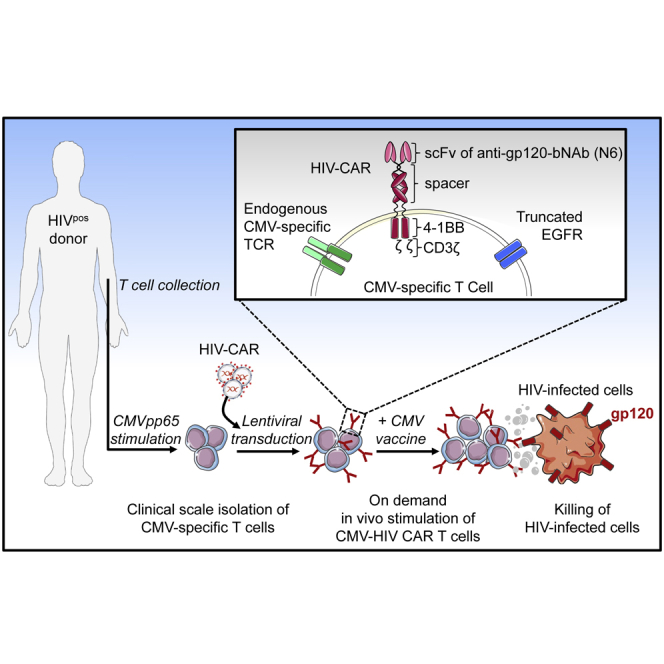
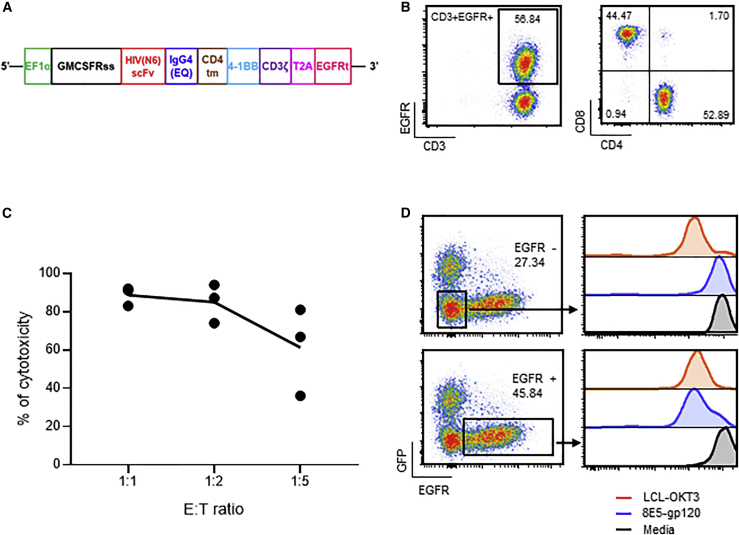
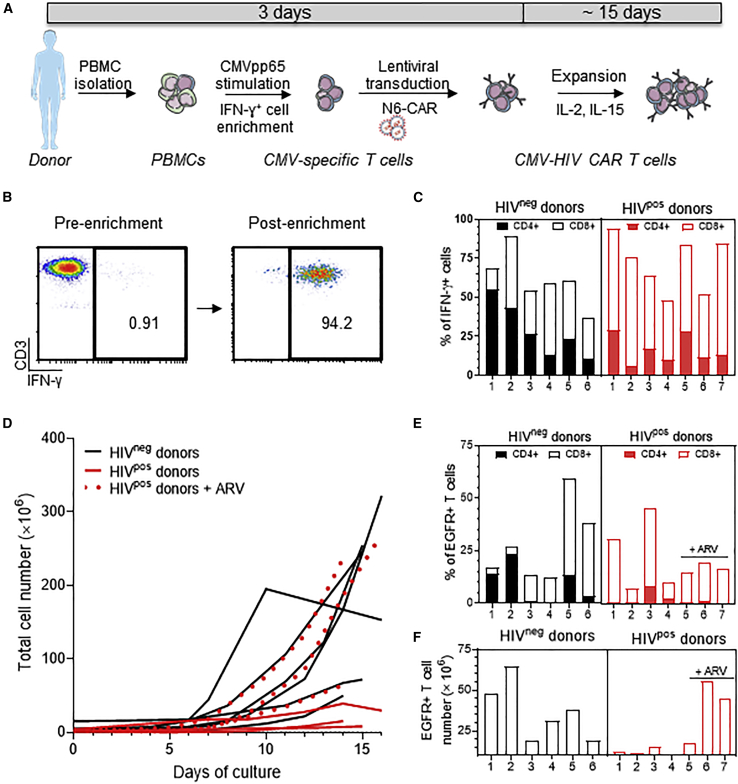
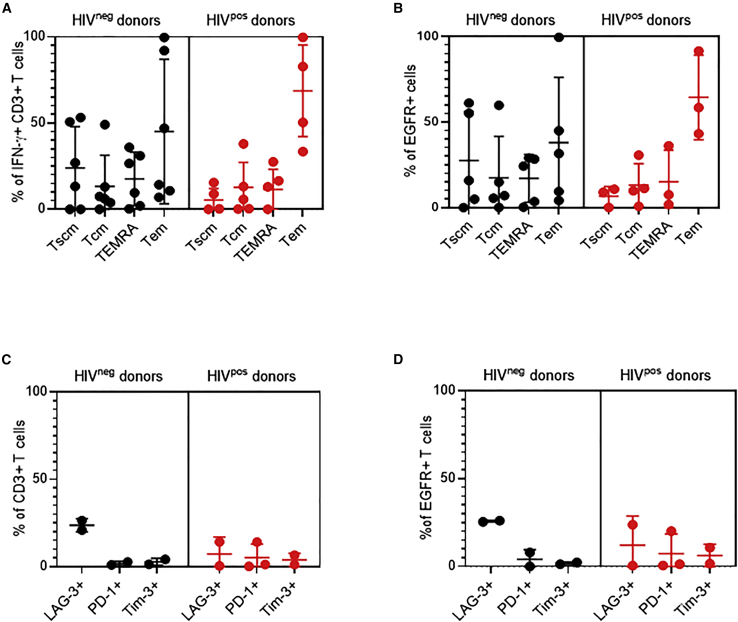
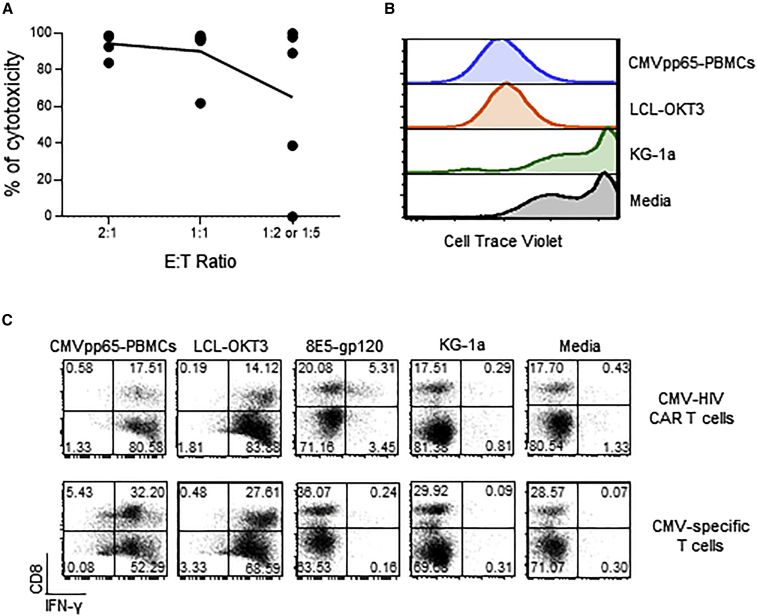
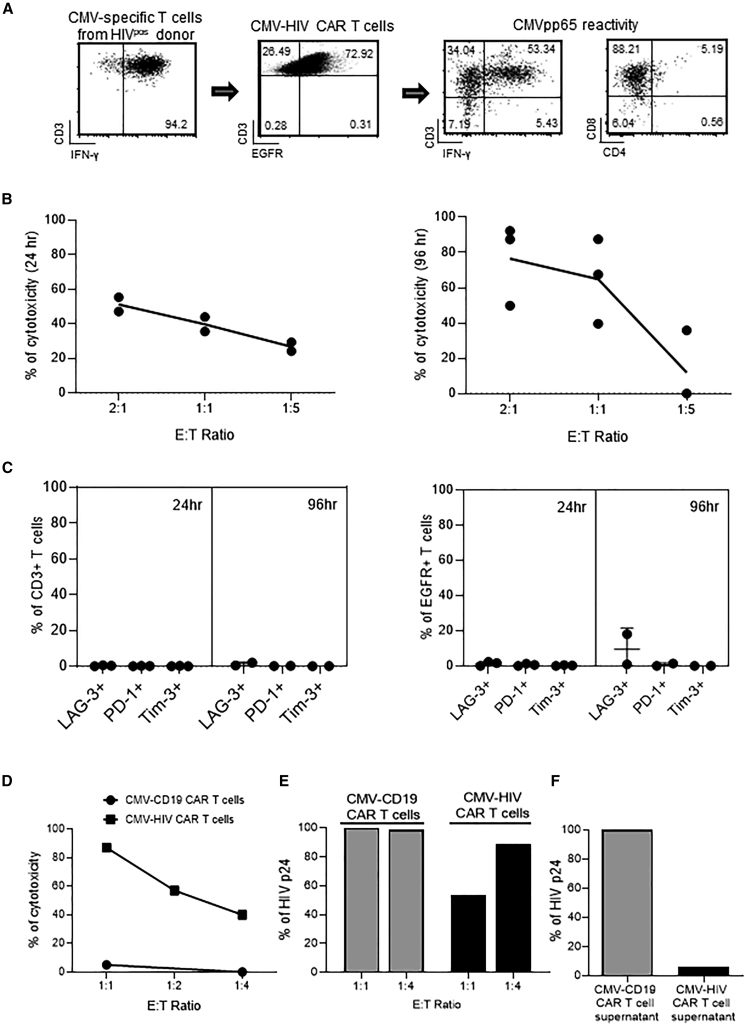
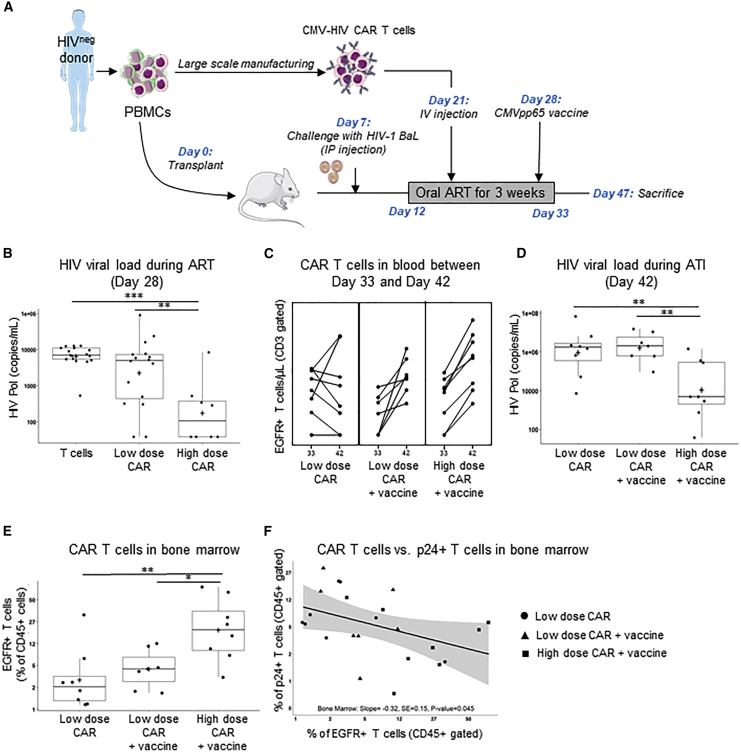
T cells engineered to express HIV-specific chimeric antigen receptors (CARs) represent a promising strategy to clear HIV-infected cells, but to date have not achieved clinical benefits. A likely hurdle is the limited T cell activation and persistence when HIV antigenemia is low, particularly during antiretroviral therapy (ART). To overcome this issue, we propose to use a cytomegalovirus (CMV) vaccine to stimulate CMV-specific T cells that express CARs directed against the HIV-1 envelope protein gp120. In this study, we use a GMP-compliant platform to engineer CMV-specific T cells to express a second-generation CAR derived from the N6 broadly neutralizing antibody, one of the broadest anti-gp120 neutralizing antibodies. These CMV-HIV CAR T cells exhibit dual effector functions upon in vitro stimulation through their endogenous CMV-specific T cell receptors or the introduced CARs. Using a humanized HIV mouse model, we show that CMV vaccination during ART accelerates CMV-HIV CAR T cell expansion in the peripheral blood and that higher numbers of CMV-HIV CAR T cells were associated with a better control of HIV viral load and fewer HIV antigen p24+ cells in the bone marrow upon ART interruption. Collectively, these data support the clinical development of CMV-HIV CAR T cells in combination with a CMV vaccine in HIV-infected individuals.

Keywords: HIV/AIDS; N6; broadly neutralizing antibody (bNAb); chimeric antigen receptor T cell (CAR T); cytomegalovirus (CMV) vaccine; immunotherapy.


Conflict of interest statement

Competing interests: A patent associated with this study covering the work has been held and submitted by City of Hope (US2016/024560) with X.W. and S.J.F. as inventors who could potentially receive licensing royalties in the future. The remaining authors declare no competing interests.

Figures

None
Graphical abstract
Figure 1
Figure 1
Functional characterization of N6-CAR T cells (A) Schematic diagram of the N6-CAR construct. The construct contains the GMCSFRss under the control of the EF1α promoter, the scFv of the anti-gp120 bNAb N6 linked to the CD4 transmembrane (tm) and 4-1BB costimulatory domains through an IgG4 (EQ) spacer, followed by CD3ζ and a T2A linked EGFRt. (B) Primary T cells were activated with CD3/CD28 microbeads and transduced with a lentiviral vector encoding N6-CAR. After approximately 15-day in vitro expansion, CAR expression and T cell subsets were analyzed by flow cytometry using antibodies against EGFR, CD3, CD4, and CD8. Representative FACS plots of four HIVneg donor-derived CAR T cell products are presented. (C) N6-CAR T cells or mock T cells derived from HIVneg donors were cocultured with eGFP-expressing 8E5-gp120 cells at various total T cells:target (E:T) ratios for 96 h followed by immunostaining for CD3 and eGFP. Cytotoxicity is calculated as follows: 100% – (% of remaining tumor cells in CAR T cell group/% of remaining tumor cells in mock T or negative target); n = 3 donors. (D) N6-CAR T cell products were labeled with CellTrace Violet dye (CTV) and stimulated at an E:T ratio of 1:1 with 8,000 rads irradiated 8E5-gp120 for 8 days before CTV analysis (blue line). The 8,000 rads irradiated lymphoblastoid cells that express the CD3 agonist OKT3 (LCL-OKT3) were used as a positive control (red line) and media as a negative control (black line). CTV dilutions from EGFR+ gated cells (bottom) and EGFR-gated cells (top) are depicted. Representative data of five HIVneg donor-derived CAR T cell products are presented.
Figure 2
Figure 2
Clinical scale manufacturing of CMV-HIV CAR T cells derived from HIVneg and HIVpos donors (A) Manufacturing workflow to generate CMV-HIV CAR T cells as described in the Methods. (B) Representative FACS plots of CMV-specific T cells isolated from an HIVpos donor before and after IFN-γ+ cell enrichment using the CliniMACS Prodigy platform. (C) Flow cytometric analysis of the percentage of enriched IFN-γ+ CMV-specific T cells and their relative CD4 and CD8 expression. n = 6–7 donors per group. (D) Growth curves of total cell number in final products derived from HIVneg (n = 6) and HIVpos (n = 7) donors over approximately 15-day expansion. The expansion curves in presence of ARVs (darunavir and enfuvirtide) are presented with red dotted lines. (E) Flow cytometric analysis of the percentage of CMV-HIV CAR T cell in the final cell products and their relative CD4 and CD8 expression. n = 6–7 donors per group. (F) Total number of CMV-HIV CAR T cells in each final cell product.
Figure 3
Figure 3
Phenotypic characterization of CMV-HIV CAR T cell products derived from HIVneg and HIVpos donors T cell memory markers: CD27+CD45RA+ Tscm, CD27+CD45RA central memory (Tcm), CD27CD45RA+ effector memory RA (TEMRA), and CD27CD45RA Tem were analyzed by flow cytometry after INF-r enrichment (A) and in the final CAR T cell products (B). Exhaustion markers (LAG-3, PD-1 and Tim-3) were analyzed by flow cytometry in the final cell products (C) or within the EGFR+ CAR T cell fractions (D). Lines indicate means ± SD; n = 2–6 donors per group.
Figure 4
Figure 4
Effector functions of CMV-HIV CAR T cells derived from HIVneg donors (A) Specific cytotoxicity against gp120-expressing target cells was determined by culturing CMV-HIV CAR T cell products with eGFP+ 8E5-gp120 or eGFP+ KG-1a cells at different E:T ratios 2:1, 1:1, 1:2 or 1:5) for 96 h followed by immunostaining for CD3 and eGFP. Percentages of remaining eGFP+ tumor cells were measured by flow cytometry and cytotoxicity was calculated. N = 5. (B) CMV-HIV CAR T cell products were labeled with CTV and cultured for 8 days with CMVpp65 peptide-pulsed and 3,500 rads irradiated PBMCs (CMVpp65-PBMC), 8,000 rads irradiated LCL-OKT3 or KG-1a cells or media. CMV-HIV CAR T cell proliferation was determined by CTV dilution. Representative data of four donors are shown. (C) CMV-HIV CAR T cell or CMV-specific T-cell products derived from the same donor were stimulated overnight with CMVpp65 peptide-pulsed autologous PBMC (CMVpp65-PBMC), LCL-OKT3, 8E5-gp120, KG-1a cells or media. Cocultures were stained for surface CD8 followed by intracellular IFN-γ. Representative data of three different donors are shown.
Figure 5
Figure 5
Effector functions of CMV-HIV CAR T cells derived from HIVpos donors (A) Representative FACS plots of CMV-specific T cells enriched from an HIVpos donor and transduced with a lentiviral vector expressing N6-CAR (n = 7). The transduction efficiency was assessed on day 7 by measuring EGFR expression in T cells. The CMV-HIV CAR T cell products were then stimulated overnight with CMVpp65 peptide-pulsed autologous PBMC and analyzed by flow cytometry for the expression of IFN-γ, CD3, CD4 and CD8. Representative data of three different donors (n = 3) are shown. (B, C) Specific cytotoxicity was determined by co-culturing CMV-HIV CAR T cells (n = 3) with eGFP+ 8E5-gp120 or eGFP+ KG-1a cells at different E:T ratios (2:1, 1:1, or 1:5) for 24 h (n = 2) and 96 h (n = 3) followed by immunostaining for CD3, EGFR as well as LAG-3, PD-1 and Tim-3 exhaustion markers. Percentages of remaining eGFP+ tumor cells were measured by flow cytometry and cytotoxicity was calculated as described in Methods. The graph presents the cytotoxicity of CAR T cells from two or three donors against 8E5-gp120 target cells at different E:T ratios. (D) CMV-HIV CAR T cells or CMV-CD19 CAR T cells were manufactured from the same HIVpos donor and cultured with HIVNL4-3-infected eGFP+ Jurkat cells at different E:T ratios (1:1, 1:2, and 1:4) for 7 days. The cytotoxicity of the CAR T cell products against HIVNL4-3-infected eGFP+ Jurkat cells was calculated and normalized to an untreated control well. The levels of HIV p24 in the cell supernatants on day 7 were measured by ELISA and normalized to the p24 levels in the control condition at an E:T ratio of 1:1 (E). (F) CMV-HIV CAR T cells and CMV-CD19 CAR T cells were manufactured from an HIVpos donor on ART. Levels of p24 were measured in the culture supernatant by ELISA after 20-day expansion and normalized to the p24 level in supernatant of CMV-CD19 CAR T cells. Data from one HIVpos donor are shown in (D), (E), and (F).
Figure 6
Figure 6
CMVpp65-driven expansion of CMV-HIV CAR T cells and dose-dependent control of HIV viremia in hu-PBMC-NSG mice on ART (A) NSG humanized PBMCs (hu-PBMC) mouse model of HIV on ART and experimental design. HIV-infected mice on oral ART were treated with a low dose CMV-HIV CAR T cells (0.1 × 106 EGFR+ T cells), with or without CMVpp65 vaccine, or a high dose of CMV-HIV CAR T cells (1 × 106 EGFR+ T cells) with CMVpp65 vaccine on day 28. Mice treated with CMV-negative T cells (1 × 106 cells) from the same HIVneg donor, with or without CMVpp65 vaccine, were used as controls. (B) HIV viral load in the peripheral blood on day 28. Additive models with the baseline HIV viral load (day 21), log10CD3, log10CD4 and treatment group were considered, and the best model was chosen based on Akaike information criteria. This model included treatment groups only so analysis of variance followed by the Tukey method for all possible one-sided comparisons (family-wise error rate = 0.05) was used to assess if there were treatment differences among the control (T cell-treated mice), low-dose and high-dose CMV-HIV CAR T cell-treated cohorts; ∗∗∗p < 0.001; ∗∗p = 0.002; n = 8–17/group. (C) Flow cytometric analysis of EGFR+ CAR T cell expansion in the peripheral blood between day 33 and day 42. n = 8/group. Note that one female mouse in the low-dose CAR T + vaccine group did not have a day 42 measure and was not included in this analysis. (D) HIV viral load in the peripheral blood on day 42, after vaccine stimulation and ART interruption. The best model was an analysis of covariance including log10CD3, log10CD4 and treatment group followed by the Tukey method for all possible one-sided comparisons. ∗∗p < 0.01, ∗p = 0.03; n = 6–8/group. (E) Flow cytometric analysis of the frequency of EGFR+ CAR T cells in the bone marrow at the time of sacrifice. The data was transformed using a logit transformation. ANOVA followed by the Tukey method for all possible one-sided comparisons (family-wise error rate = 0.05) was used to assess if there were treatment differences among the CAR T cell-treated cohorts; ∗∗p < 0.01; ∗p = 0.02; n = 7–8/group. (F) Percentage of EGFR+ CAR T cells in the bone marrow plotted against the percentage of p24+ T cells in the bone marrow. Staining for surface antibodies (CD45, CD3, and EGFR) were performed as in panel (C), while intracellular p24 HIV-1 antigen was stained with KC57-FITC antibody after fixation and permeabilization. The simple least squares model with only percent of EGFR+ CAR T cells was best, both percent of EGFR+ CAR T cells, and percent of p24+ T cells were transformed using a logit. Box and whisker plots were used to present the data in (B), (D), and (E). The black box represents the quartiles and black line represent the quartiles and median and the plus sign represents the mean, and values outside the whiskers are considered outliers.
Figure 7
Figure 7
Distribution and phenotype of HIVpos donor-derived CMV-HIV CAR T cells in a humanized PBMC-NSG mouse model Flow cytometric analyses of EGFR + CAR T cells 6 weeks post-CAR T cell infusion. (A) Frequency of CD4+ and CD8+ T cells, and (B) CD62L+ and (C) CD27+ within the EGFR+ CAR T cell fraction. Lines represent means ± SD; n = 5.

References

    1. Günthard H.F., Saag M.S., Benson C.A., del Rio C., Eron J.J., Gallant J.E., Hoy J.F., Mugavero M.J., Sax P.E., Thompson M.A., et al. Antiretroviral drugs for treatment and prevention of HIV infection in adults: 2016 recommendations of the international antiviral society-USA panel. JAMA. 2016;316:191–210. doi: 10.1001/jama.2016.8900. - DOI - PMC - PubMed
    1. Sadowski I., Hashemi F.B. Strategies to eradicate HIV from infected patients: elimination of latent provirus reservoirs. Cell Mol. Life Sci. 2019;76:3583–3600. doi: 10.1007/s00018-019-03156-8. - DOI - PMC - PubMed
    1. Hege K.M., Cooke K.S., Finer M.H., Zsebo K.M., Roberts M.R. Systemic T cell-independent tumor immunity after transplantation of universal receptor-modified bone marrow into SCID mice. J. Exp. Med. 1996;184:2261–2269. doi: 10.1084/jem.184.6.2261. - DOI - PMC - PubMed
    1. Wagner T.A. Quarter century of anti-HIV CAR T cells. Curr. HIV/AIDS Rep. 2018;15:147–154. doi: 10.1007/s11904-018-0388-x. - DOI - PMC - PubMed
    1. Patel S., Hanajiri R., Grant M., Saunders D., Van Pelt S., Keller M., Hanley P.J., Simon G., Nixon D.F., Hardy D., et al. HIV-specific T cells can Be generated against non-escaped T cell epitopes with a GMP-compliant manufacturing platform. Molecular therapy. Methods Clin. Dev. 2020;16:11–20. doi: 10.1016/j.omtm.2019.10.001. - DOI - PMC - PubMed