

Cross-comparison of microbiota in the oropharynx, hypopharyngeal squamous cell carcinoma and their adjacent tissues through quantitative microbiome profiling
- PMID: 35573640
- PMCID: PMC9103590
- DOI: 10.1080/20002297.2022.2073860
Cross-comparison of microbiota in the oropharynx, hypopharyngeal squamous cell carcinoma and their adjacent tissues through quantitative microbiome profiling
Abstract
Aims: To clarify the absolute abundance of microbial communities on hypopharyngeal squamous cell carcinoma and their correlation to those in the oropharynx.
Methods: Clinical data, swabs, and tissue samples from 27 HPSCC patients were collected in this study and divided into three sampling groups: 19 oropharyngeal mucosa (OPM), 27 hypopharyngeal carcinomas tissues (HC), and 26 corresponding adjacent tissues (AT). Relative microbiome profiling (RMP), and quantitative microbiome profiling (QMP) of 16S rRNA amplicon sequencing were used for analysis.
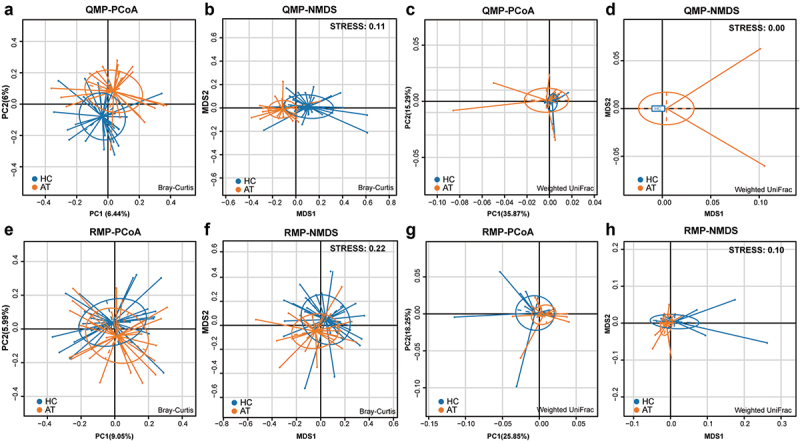
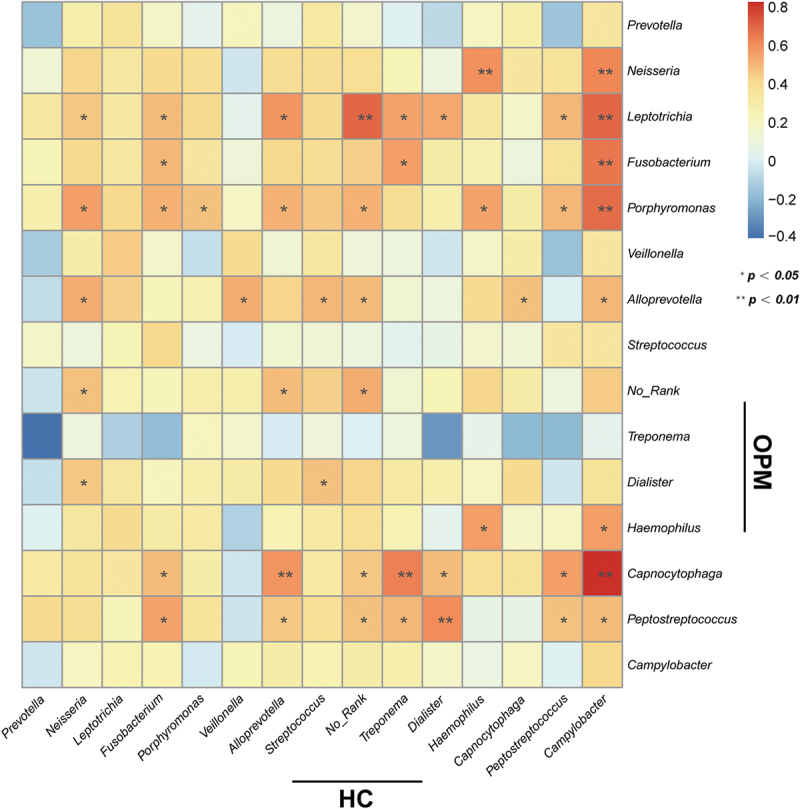
Results: Beta-diversity showed that abundance and phylogenetic tree in OPM group were less when compared to either HC and AT. Although HC and AT were found to have similar microbiota, Bray-Curtis based beta-diversity still highlighted differences. Fusobacterium, Porphyromonas, Haemophilus, and Peptostreptococcus at the genus level in OPM were positively correlated with HC. After categorizing HC through TNM staging, the abundance of genera Fusobacterium, Parvimonas, and Dialister were found to be enhanced in higher T classifications (T3-4) and advanced stages (Ⅳ).
Conclusions: QMP yielded more comprehensive results than RMP. Dysbiosis was found in OPM groups and could be used to narrow down differential microbiome for the HC group. Genera of Parvimonas, Fusobacterium, and Dialister were deemed asrisk factors of advanced HPSCC.
Keywords: ASV; HPSCC; QIIME2; Quantitative microbiome profiling; cross-sectional study.
© 2022 The Author(s). Published by Informa UK Limited, trading as Taylor & Francis Group.
Conflict of interest statement
No potential conflict of interest was reported by the author(s).
Figures


Similar articles
-
Oropharynx microbiota transitions in hypopharyngeal carcinoma treatment of induced chemotherapy followed by surgery.BMC Microbiol. 2021 Nov 9;21(1):310. doi: 10.1186/s12866-021-02362-4. BMC Microbiol. 2021. PMID: 34753420 Free PMC article.
-
Oral Microbiota Community Dynamics Associated With Oral Squamous Cell Carcinoma Staging.Front Microbiol. 2018 May 3;9:862. doi: 10.3389/fmicb.2018.00862. eCollection 2018. Front Microbiol. 2018. PMID: 29774014 Free PMC article.
-
Distinct microbial communities colonize tonsillar squamous cell carcinoma.Oncoimmunology. 2021 Jul 25;10(1):1945202. doi: 10.1080/2162402X.2021.1945202. eCollection 2021. Oncoimmunology. 2021. PMID: 34367729 Free PMC article.
-
Characteristics of mucosa-associated gut microbiota during treatment in Crohn's disease.World J Gastroenterol. 2019 May 14;25(18):2204-2216. doi: 10.3748/wjg.v25.i18.2204. World J Gastroenterol. 2019. PMID: 31143071 Free PMC article.
-
Dysbiosis of salivary microbiome and cytokines influence oral squamous cell carcinoma through inflammation.Arch Microbiol. 2021 Jan;203(1):137-152. doi: 10.1007/s00203-020-02011-w. Epub 2020 Aug 11. Arch Microbiol. 2021. PMID: 32783067
Cited by
-
Salivary microbiome is associated with the response to chemoradiotherapy in initially inoperable patients with esophageal squamous cell carcinoma.J Oral Microbiol. 2024 May 27;16(1):2359887. doi: 10.1080/20002297.2024.2359887. eCollection 2024. J Oral Microbiol. 2024. PMID: 38813524 Free PMC article.
-
Evaluating the prognostic value of microbial communities in predicting recurrence of laryngeal carcinoma: a multicenter case-control study.NPJ Biofilms Microbiomes. 2025 Aug 10;11(1):159. doi: 10.1038/s41522-025-00789-5. NPJ Biofilms Microbiomes. 2025. PMID: 40783569 Free PMC article.
-
Gegen Qinlian decoction alleviates depression-like behavior by modulating the gut microenvironment in CUMS rats.BMC Complement Med Ther. 2024 Sep 20;24(1):339. doi: 10.1186/s12906-024-04638-4. BMC Complement Med Ther. 2024. PMID: 39304871 Free PMC article.
-
Metagenomic shotgun sequencing reveals the enrichment of Salmonella and Mycobacterium in larynx due to prolonged ethanol exposure.Comput Struct Biotechnol J. 2023 Dec 24;23:396-405. doi: 10.1016/j.csbj.2023.12.022. eCollection 2024 Dec. Comput Struct Biotechnol J. 2023. PMID: 38235358 Free PMC article.
-
Who is in the driver's seat? Parvimonas micra: An understudied pathobiont at the crossroads of dysbiotic disease and cancer.Environ Microbiol Rep. 2023 Aug;15(4):254-264. doi: 10.1111/1758-2229.13153. Epub 2023 Mar 30. Environ Microbiol Rep. 2023. PMID: 36999244 Free PMC article. Review.
References
-
- Garneau JC, Bakst RL, Miles BA.. Hypopharyngeal cancer: a state of the art review. Oral Oncol. 2018;86:244–13. - PubMed
-
- de Martel C, Georges D, Bray F, et al. Global burden of cancer attributable to infections in 2018: a worldwide incidence analysis. Lancet Glob Health. 2020;8(2):e180–e190. - PubMed
LinkOut - more resources
Full Text Sources