Review
. 2022 Apr 27:9:882487.
doi: 10.3389/fmolb.2022.882487. eCollection 2022.

Studying Metabolism by NMR-Based Metabolomics

Affiliations
Review

Studying Metabolism by NMR-Based Metabolomics

Sofia Moco. Front Mol Biosci. .

Abstract

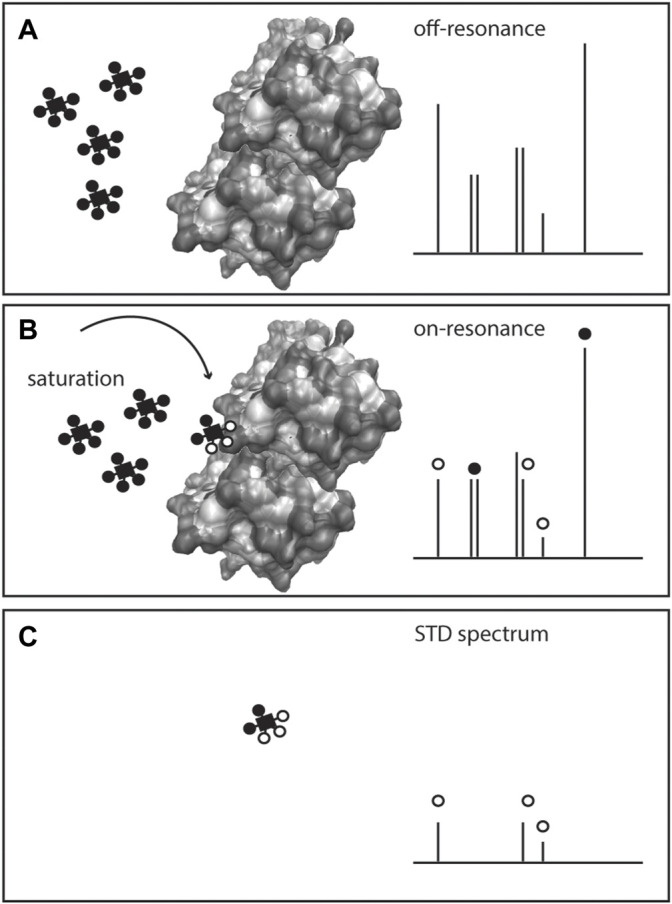
During the past few decades, the direct analysis of metabolic intermediates in biological samples has greatly improved the understanding of metabolic processes. The most used technologies for these advances have been mass spectrometry (MS) and nuclear magnetic resonance (NMR) spectroscopy. NMR is traditionally used to elucidate molecular structures and has now been extended to the analysis of complex mixtures, as biological samples: NMR-based metabolomics. There are however other areas of small molecule biochemistry for which NMR is equally powerful. These include the quantification of metabolites (qNMR); the use of stable isotope tracers to determine the metabolic fate of drugs or nutrients, unravelling of new metabolic pathways, and flux through pathways; and metabolite-protein interactions for understanding metabolic regulation and pharmacological effects. Computational tools and resources for automating analysis of spectra and extracting meaningful biochemical information has developed in tandem and contributes to a more detailed understanding of systems biochemistry. In this review, we highlight the contribution of NMR in small molecule biochemistry, specifically in metabolic studies by reviewing the state-of-the-art methodologies of NMR spectroscopy and future directions.

Keywords: NMR; metabolism; metabolite-protein interactions; metabolomics; qNMR; stable isotopes.


Conflict of interest statement

The author declares that the research was conducted in the absence of any commercial or financial relationships that could be construed as a potential conflict of interest.

Figures

FIGURE 1
FIGURE 1
NMR spectroscopy: a toolset in metabolism studies. Pictorial representation of the various ways NMR spectroscopy can be used in metabolic studies, such as (A) structure elucidation, (B) quantitative NMR (qNMR), (C) metabolomics, (D) metabolite-protein interactions, and (E) isotope-tracing metabolomics or stable isotope resolved metabolomics (SIRM).
FIGURE 2
FIGURE 2
Examples of 1H NMR spectra of metabolomics analyses of (A) human biofluids (prepared in phosphate buffer saline in D2O pH 7.4): plasma, cerebral spinal fluid (CSF), urine, and extract of faecal water (stool) and, (B) a human liver cell model (HepG2) after 24 h of culture: intracellular content (cell extract prepared by methanolic extraction) and extracellular content (cellular medium), indicating some of the detected metabolites.
FIGURE 3
FIGURE 3
Structure elucidation strategies using NMR. Acquisition of a 1H NMR spectrum on an isolated compound provides essential information about the molecule’s structure such as the chemical shift (electronegativity of neighbouring protons and possible functional groups), coupling constants (multiplicity of signals reflects the influence of neighbouring protons), signal integral (assessment of equivalent protons). Atom connectivity can be assessed by homonuclear and heteronuclear 2D NMR spectra, usually 1H–1H or 1H-13C. In certain cases, other 2D or 3D NMR experiments are useful to obtain more detailed information. Identification and spectral deconvolution in NMR benefits from available computational approaches, including databases, multivariate statistical approaches (MVS) and quantum-mechanic-based algorithms. And the availability of complementary information, such as the use of authentic standards or mass spectrometry is generally helpful. In the case of complex mixtures, as in metabolomics, scale-up and metabolite isolation are often unavoidable, in particular in the case of unknown metabolites.
FIGURE 4
FIGURE 4
Examples of label incorporation schemes in central metabolism by NMR. Certain tracers are better suited to study specific pathways. In this scheme, the colour of the tracer is indicated next to the pathway name it is used for. 13C-tracers are represented, however alternative tracers with other labelled (2H, 15N) nuclei might be used, as well as other available labelled precursors.
FIGURE 5
FIGURE 5
Scheme of Saturation Transfer Difference (STD)-NMR for studying protein-metabolite interactions. The protein is exposed to an excess of ligand(s) or metabolite(s) and a 1H NMR spectrum is recorded (off-resonance spectrum), (A) Given the low amount of protein in solution, only the metabolite(s) signals are visible. On a second acquisition, selected saturation is applied to the protein that is transferred to the bound metabolite through the nuclear Overhauser effect, inducing the bound ligand resonances to broaden or disappear (on-resonance spectrum), (B) The difference spectrum (off-resonance on-resonance), STD spectrum, (C) exhibits the resonances of the metabolite bound to the protein, and confirms the presence of the protein-metabolite interaction.

References

    1. Achanta P. S., Jaki B. U., McAlpine J. B., Friesen J. B., Niemitz M., Chen S.-N., et al. (2021). Quantum Mechanical NMR Full Spin Analysis in Pharmaceutical Identity Testing and Quality Control. J. Pharm. Biomed. Anal. 192, 113601. 10.1016/j.jpba.2020.113601 - DOI - PMC - PubMed
    1. Anklin C. (2016). “Chapter 3. Small-Volume NMR: Microprobes and Cryoprobes,” in Modern NMR Approaches to the Structure Elucidation of Natural Products, Instrumentation and Software. Editors Martin G. E., Williams A. J., Rovnyak D. (Cambridge, United Kingdom: Royal Society of Chemistry; ), 38–57. 10.1039/9781849735186-00038 - DOI
    1. Ardenkjær-Larsen J. H., Fridlund B., Gram A., Hansson G., Hansson L., Lerche M. H., et al. (2003). Increase in Signal-To-Noise Ratio of > 10,000 Times in Liquid-State NMR. Proc. Natl. Acad. Sci. U.S.A. 100, 10158–10163. 10.1073/pnas.1733835100 - DOI - PMC - PubMed
    1. Arita M. (2003). In Silico atomic Tracing by Substrate-Product Relationships in Escherichia coli Intermediary Metabolism. Genome Res. 13, 2455–2466. 10.1101/gr.1212003 - DOI - PMC - PubMed
    1. Barding G. A., Salditos R., Larive C. K. (2012). Quantitative NMR for Bioanalysis and Metabolomics. Anal. Bioanal. Chem. 404, 1165–1179. 10.1007/s00216-012-6188-z - DOI - PubMed