. 2022 Apr 29:13:867600.
doi: 10.3389/fendo.2022.867600. eCollection 2022.

Identification and Validation of Autophagy-Related Genes in Diabetic Retinopathy

Affiliations

Identification and Validation of Autophagy-Related Genes in Diabetic Retinopathy

Nan Wang et al. Front Endocrinol (Lausanne). .

Abstract

Background: Diabetic retinopathy (DR) is one of the most common microvascular complications of diabetes, which is associated with damage of blood-retinal barrier and ischemia of retinal vasculature. It devastates visual acuity due to leakage of retinal vessels and aberrant pathological angiogenesis in diabetic patients. The etiology of DR is complex, accumulated studies have shown that autophagy plays an important role in the pathogenesis of DR, but its specific mechanism needs to be further studied.

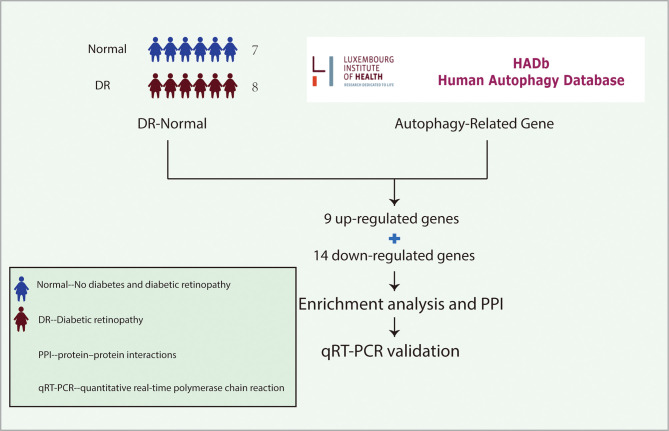
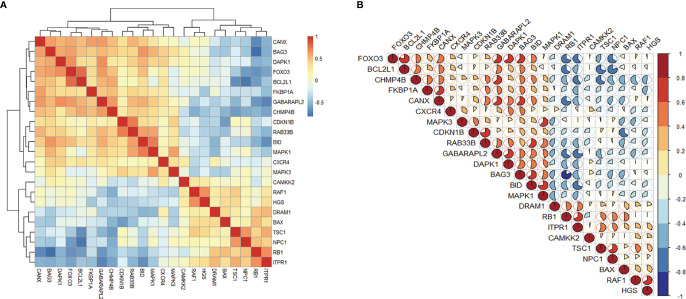
Methods: This study chose the online Gene Expression Omnibus (GEO) microarray expression profiling dataset GSE146615 to carry on the research. Autophagy-related genes that were potentially differentially expressed in DR were screened by R software. Then, the differentially expressed autophagy-related genes were analyzed by correlation analysis, tissue-specific gene expression, gene-ontology (GO) enrichment analysis, Kyoto Encyclopedia of Genes and Genomes (KEGG) pathway enrichment analysis and protein-protein interaction (PPI) network analysis. Finally, retinal pigment epithelial cell line (ARPE-19) incubated with high glucose (HG) was used to mimic the DR model, and the mRNA level of key genes was verified by quantitative real-time polymerase chain reaction (qRT-PCR) in vitro.

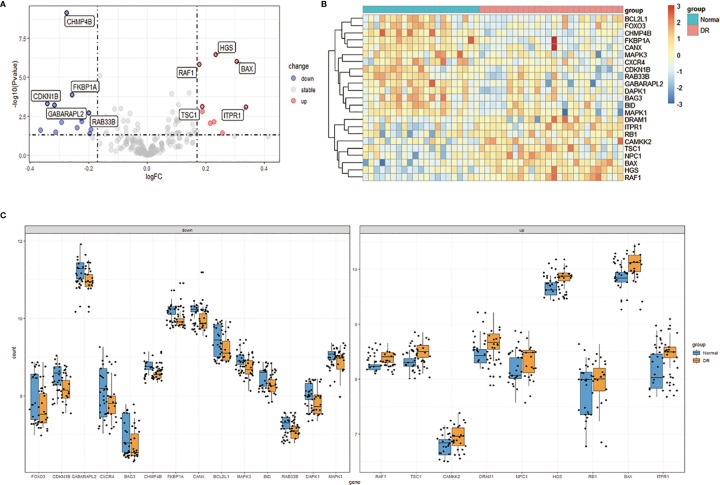
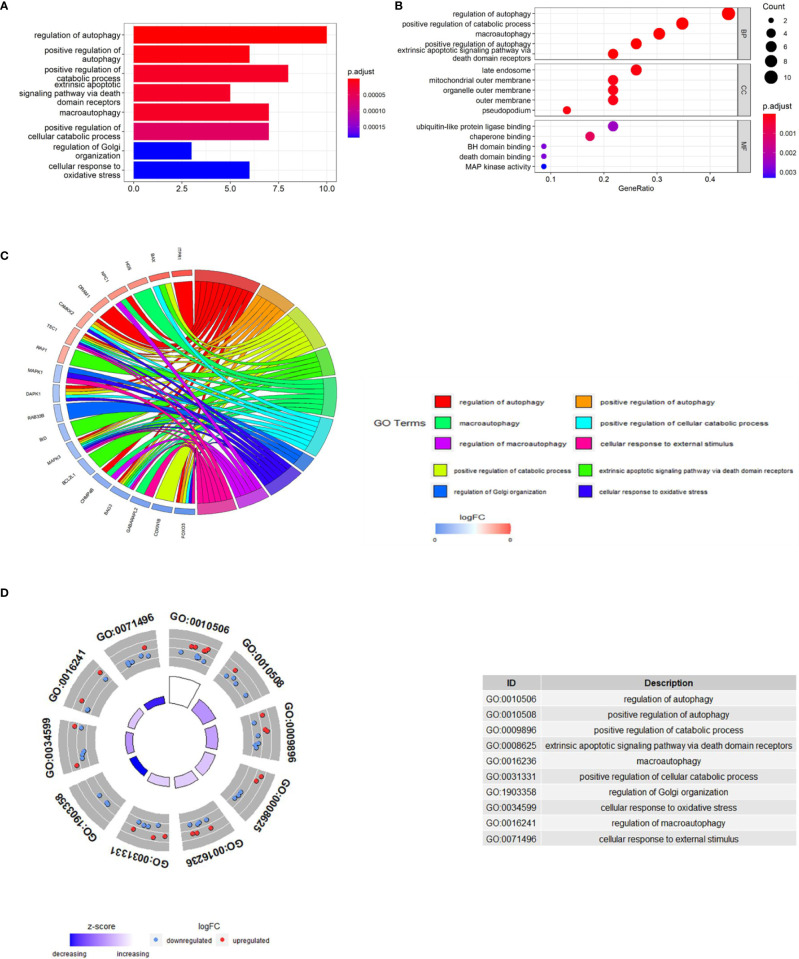
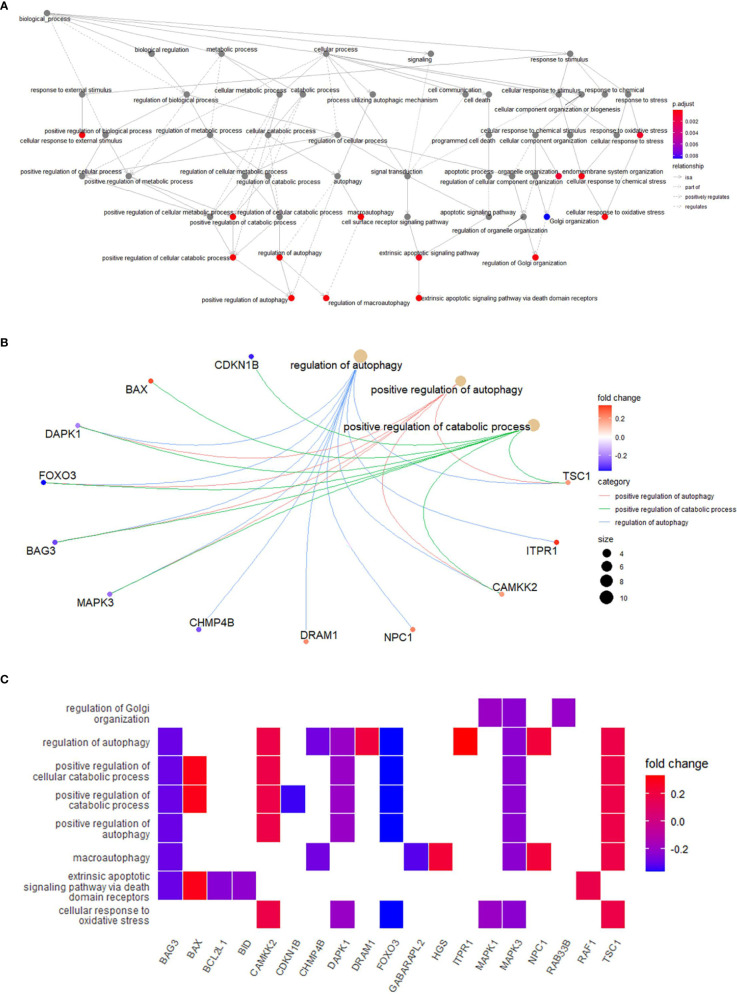
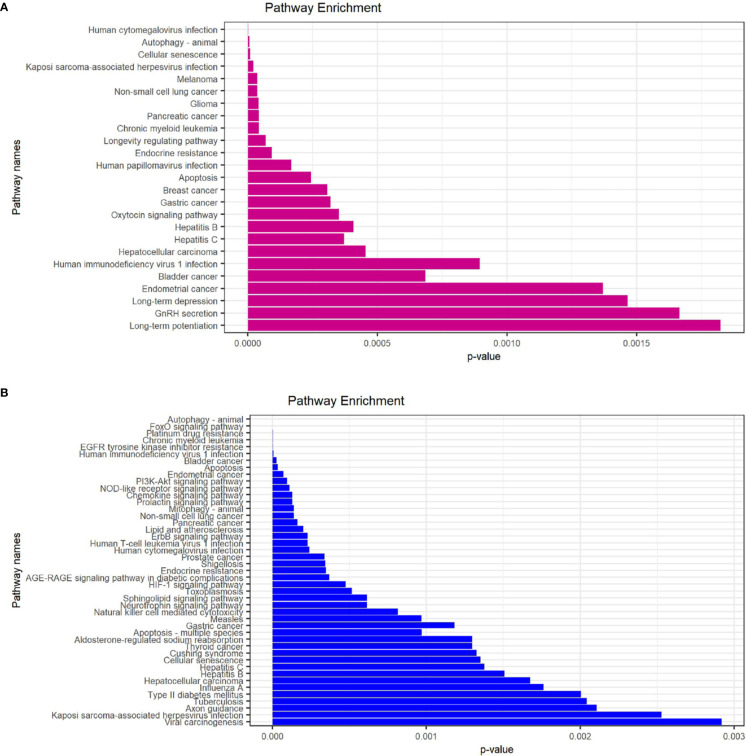
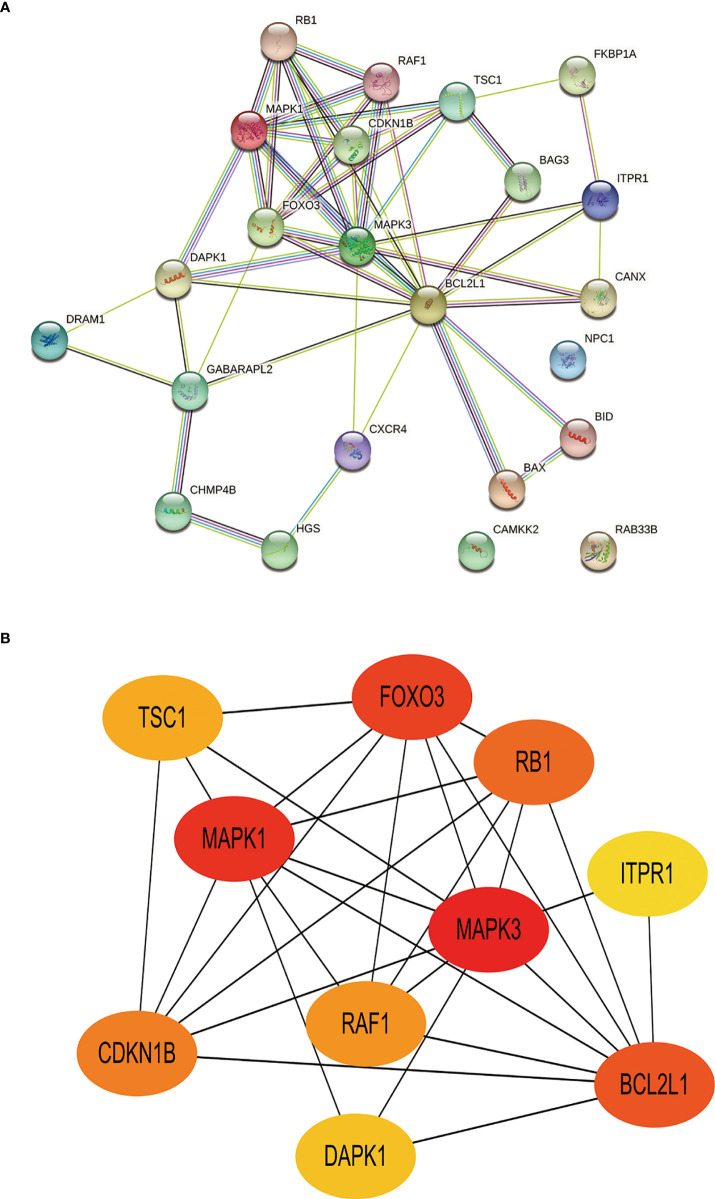
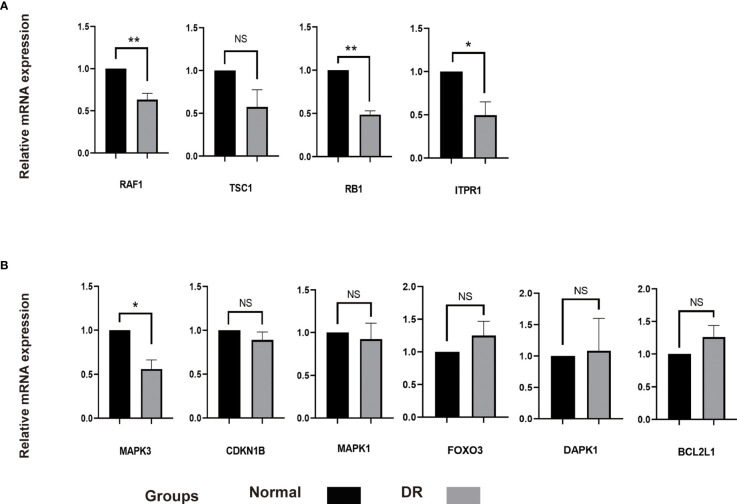
Results: A total of 23 differentially expressed autophagy-related genes (9 up-regulated genes and 14 down-regulated genes) were identified by differential expression analysis. The analysis of tissue-specific gene expression showed that these differentially expressed autophagy-related genes were enriched in the retina. GO and KEGG enrichment analysis showed that differentially expressed autophagy-related genes were significantly enriched in autophagy-related pathways such as regulation of autophagy and macroautophagy. Then 10 hub genes were identified by PPI network analysis and construction of key modules. Finally, qRT-PCR confirmed that the expression of MAPK3 in the DR model was consistent with the results of bioinformatics analysis of mRNA chip.

Conclusion: Through bioinformatics analysis, we identified 23 potential DR autophagy-related genes, among which the down-regulated expression of MAPK3 may affect the occurrence and development of DR by regulating autophagy. It provides a novel insight into the pathogenesis of DR.

Keywords: MAPK3; autophagy; diabetic retinopathy; differentially expressed genes; protein-protein interaction network.


Conflict of interest statement

The authors declare that the research was conducted in the absence of any commercial or financial relationships that could be construed as a potential conflict of interest.

Figures

Figure 1
Figure 1
The idea of experimental design. The gene expression profiles of LCLs extracted from the peripheral blood of 7 non-diabetic individuals and 8 patients with DR were cultured under SG and HG conditions respectively in the GSE146615 dataset. 232 autophagy-related genes were collected from The Human Autophagy Database. Then, 9 up-regulated genes and 14 down-regulated genes were screened by differential analysis. After enrichment analysis and PPI network construction, 10 hub genes were identified. Finally, qRT-PCR was used to verify in vitro DR model. LCLs, lymphoblastoid cell lines; DR, diabetic retinopathy; SG, standard glucose; HG, high glucose; PPI, protein-protein interaction; qRT-PCR, quantitative real-time polymerase chain reaction.
Figure 2
Figure 2
Differentially expressed autophagy-related genes in DR patients (DR group) and non-diabetic individuals (Normal group). (A), Volcano plot of 232 differentially expressed autophagy-related genes. The red dots in the picture represent significantly up-regulated genes, blue dots represent significantly down-regulated genes, black dots represent genes that are not differentially expressed, and the five genes that are most significantly up-regulated or down-regulated are marked. (B), The heatmap of 232 differentially expressed autophagy-related genes. Red represents up-regulated genes and blue represents downregulated genes. (C), The boxplot of 23 differentially expressed autophagy-related genes in DR and normal samples. It includes 9 up-regulated genes and 14 down-regulated genes. DR, diabetic retinopathy.
Figure 3
Figure 3
Correlation analysis of 23 differentially expressed autophagy-related genes. (A, B), Correlation heatmap.
Figure 4
Figure 4
GO enrichment analysis of 23 differentially expressed autophagy-related genes, including BPs, CCs and MFs. (A), Bar plot of enriched GO terms. (B), Bubble plot of enriched GO terms. (C), Chordal graph of enriched GO terms. It shows the relationship between DEGs and the first 10 enriched GO pathways. (D), Eight Diagrams of enriched GO terms. GO, Gene Ontology; BPs, biological processes; CCs, cellular components; MFs, molecular functions; DEGs, differentially expressed genes.
Figure 5
Figure 5
(A), Relationships between enriched pathways. (B), Common genes in the most top pathways. (C), Heatmap-like functional classification.
Figure 6
Figure 6
KEGG enrichment analysis of 23 differentially expressed autophagy-related genes. (A), KEGG analysis of 9 up-regulated expressed autophagy-related genes. (B), KEGG analysis of 14 down-regulated expressed autophagy-related genes. KEGG, Kyoto Encyclopedia of Genes and Genomes.
Figure 7
Figure 7
Construction of PPI network and identification of hub genes. (A), The PPI between 23 differentially expressed autophagy-related genes was constructed by using the STRING database. The node represents the gene, and the edge represents the relationship between the genes. (B), The top 10 key genes were screened through the PPI network map. Different colors in the image only represent different genes and have no other substantive meaning. PPI, protein-protein interaction.
Figure 8
Figure 8
The mRNA level of 10 hub genes were measured in ARPE-19 cells. (A), The mRNA level of RAF1, TSC1, RB1 and ITPR1 were evaluated in cell samples by qRT-PCR. (B), The mRNA level of MAPK3, CDKN1B, MAPK1, FOXO3, DAPK1 and BCL2L1 were measured in cell samples by qRT-PCR. P-values were calculated using a two-sided unpaired Student’s t-test. *P < 0.05; **P < 0.01; ns, non-significant. ARPE-19, retinal pigment epithelial cell line; qRT-PCR, quantitative real-time polymerase chain reaction.

References

    1. Antonetti DA, Klein R, Gardner TW. Diabetic Retinopathy. N Engl J Med (2012) 366(13):1227–39. doi: 10.1056/NEJMra1005073 - DOI - PubMed
    1. Altmann C, Schmidt MHH. The Role of Microglia in Diabetic Retinopathy: Inflammation, Microvasculature Defects and Neurodegeneration. Int J Mol Sci (2018) 19(1):110–31. doi: 10.3390/ijms19010110 - DOI - PMC - PubMed
    1. Rossino MG, Dal Monte M, Casini G. Relationships Between Neurodegeneration and Vascular Damage in Diabetic Retinopathy. Front Neurosci (2019) 13:1172. doi: 10.3389/fnins.2019.01172 - DOI - PMC - PubMed
    1. Ferris FL, 3rd. Results of 20 Years of Research on the Treatment of Diabetic Retinopathy. Prev Med (1994) 23(5):740–2. doi: 10.1006/pmed.1994.1127 - DOI - PubMed
    1. Santos JM, Mohammad G, Zhong Q, Kowluru RA. Diabetic Retinopathy, Superoxide Damage and Antioxidants. Curr Pharm Biotechnol (2011) 12(3):352–61. doi: 10.2174/138920111794480507 - DOI - PMC - PubMed

Publication types