. 2022 Apr 28:13:870974.
doi: 10.3389/fpls.2022.870974. eCollection 2022.

Phytochrome-Mediated Light Perception Affects Fruit Development and Ripening Through Epigenetic Mechanisms

Affiliations

Phytochrome-Mediated Light Perception Affects Fruit Development and Ripening Through Epigenetic Mechanisms

Ricardo Bianchetti et al. Front Plant Sci. .

Abstract

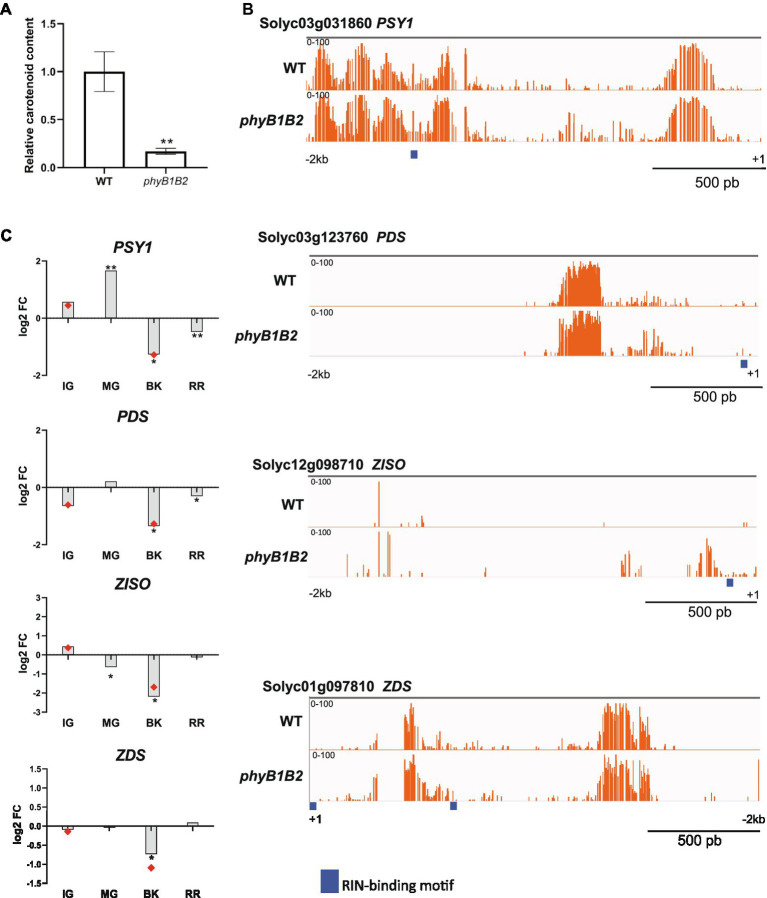
Phytochrome (PHY)-mediated light and temperature perception has been increasingly implicated as important regulator of fruit development, ripening, and nutritional quality. Fruit ripening is also critically regulated by chromatin remodeling via DNA demethylation, though the molecular basis connecting epigenetic modifications in fruits and environmental cues remains largely unknown. Here, to unravel whether the PHY-dependent regulation of fruit development involves epigenetic mechanisms, an integrative analysis of the methylome, transcriptome and sRNAome of tomato fruits from phyA single and phyB1B2 double mutants was performed in immature green (IG) and breaker (BK) stages. The transcriptome analysis showed that PHY-mediated light perception regulates more genes in BK than in the early stages of fruit development (IG) and that PHYB1B2 has a more substantial impact than PHYA in the fruit transcriptome, in both analyzed stages. The global profile of methylated cytosines revealed that both PHYA and PHYB1B2 affect the global methylome, but PHYB1B2 has a greater impact on ripening-associated methylation reprogramming across gene-rich genomic regions in tomato fruits. Remarkably, promoters of master ripening-associated transcription factors (TF) (RIN, NOR, CNR, and AP2a) and key carotenoid biosynthetic genes (PSY1, PDS, ZISO, and ZDS) remained highly methylated in phyB1B2 from the IG to BK stage. The positional distribution and enrichment of TF binding sites were analyzed over the promoter region of the phyB1B2 DEGs, exposing an overrepresentation of binding sites for RIN as well as the PHY-downstream effectors PIFs and HY5/HYH. Moreover, phyA and phyB1B2 mutants showed a positive correlation between the methylation level of sRNA cluster-targeted genome regions in gene bodies and mRNA levels. The experimental evidence indicates that PHYB1B2 signal transduction is mediated by a gene expression network involving chromatin organization factors (DNA methylases/demethylases, histone-modifying enzymes, and remodeling factors) and transcriptional regulators leading to altered mRNA profile of ripening-associated genes. This new level of understanding provides insights into the orchestration of epigenetic mechanisms in response to environmental cues affecting agronomical traits.

Keywords: DNA methylation; RdDM; carotenoid; chlorophyll; epigenetics; fleshy fruit; tomato.


Conflict of interest statement

The authors declare that the research was conducted in the absence of any commercial or financial relationships that could be construed as a potential conflict of interest.

Figures

Figure 1
Figure 1
PHYA and PHYB1B2 modify the global transcriptomic profile of tomato fruit. (A) Number of differentially expressed genes (DEGs) in phyA and phyB1B2 mutant fruits at immature green (IG) and breaker (BK) stages. (B) Venn diagram showing exclusive and common DEGs in phyA and phyB1B2 mutants in both developmental stages. (C) Functional categorization of all DEGs and those DEGs with differentially methylated promoters (DMPs) in both analyzed genotypes and stages. Only categories containing at least 2% of the DEGs or DMPs in each comparison are shown (asterisks). Up- and downregulated genes are indicated in red and blue, respectively. Loci with hyper- and hypomethylated promoters are indicated in light red and light blue, respectively. DEGs and DMPs show statistically significant differences (FDR < 0.05) relative to WT.
Figure 2
Figure 2
Disturbed PHYA- and PHYB1B2-dependent signaling differentially alters tomato fruit methylome. (A) Density plot of genes, transposable elements (TEs) and mC in all contexts (mCG, mCHG, and mCHH) for the wild type (WT) genotype. Global methylation changes for phyA and phyB1B2 in comparison with the WT at the immature green (IG) and breaker (BK) stages are shown (bin size, 1 Mb). Gene and TE densities were estimated according to the number of nucleotides covered per million. The methylation levels in the CG, CHG and CHH contexts are 40%–90%, 25%–80%, and 10%–30%, respectively. The mC difference is relative to the corresponding WT fruit stage within a −5% (hypomethylated) ≤ range ≤ +5% (hypermethylated). Chromosome scale (Mb) is shown. (B) Number of genes with differentially methylated promoters (DMPs, 2 kb upstream transcription start site) in phyA, phyB1B2 and common in both mutants, compared to WT. Hyper- and hypomethylation are indicated by grey and darker-colored bars, respectively. DMPs show statistically significant differences (FDR < 0.05) relative to WT.
Figure 3
Figure 3
Phytochrome deficiency impacts the sRNAome profile. (A) Total number of differentially methylated sRNA cluster-targeted genome regions (sCTGRs). (B) Scatter plots show the relationship between the differential accumulation of cluster sRNAs and a minimum of 5% differential methylation of their sCTGRs. The result of Fischer’s test for the association of the two datasets is shown (p ≤ 2.07e−5). (C) Boxplots show changes in the accumulation of cluster sRNAs in promoter (P, 2 Kb upstream of the 5′ UTR end) and gene body (GB) regions for up- and downregulated DEGs. Asterisks indicate statistically significant differences by the Wilcoxon–Mann–Whitney test (**p < 0.0001). All results represent the comparison of phyA and phyB1B2 to the wild type in immature green (IG) and breaker (BK) fruit stages.
Figure 4
Figure 4
PHYB1/B2 influence on fruit ripening is associated to the promoter demethylation of master ripening-associated transcription factors. (A) Differentially methylated promoters of the RIPENING INHIBITOR (RIN), NON-RIPENING (NOR), COLORLESS NON-RIPENING (CNR) and APETALA 2a (AP2a) loci between the phyB1B2 and WT genotypes. Green and orange indicate cytosine methylation levels in immature green (IG) and breaker (BK) fruits, respectively. Thick blue lines indicate RIN peak binding sites according to ChIP-seq data (Zhong et al., 2013). (B) Relative expression from the RT-qPCR assay of genes encoding master ripening transcription factors in BK and red ripe (RR) fruits from phyB1B2. Expression levels represent the mean of at least three biological replicates and are relative to WT. Asterisks indicate statistically significant differences by two-tailed Student’s t-test compared to WT (*p < 0.05). Red dots indicate data from RNA-seq in the same fruit developmental stage validated by RT-qPCR.
Figure 5
Figure 5
PHYB1/B2-dependent regulation of fruit carotenogenesis relies on the promoter demethylation of key carotenoid biosynthetic genes. (A) Relative contents of total carotenoids in red ripe (RR) fruits from phyB1B2 and WT genotypes. Values represent the mean of at least three biological replicates. Asterisks indicate statistically significant differences by the two-tailed Student’s t-test between genotypes (**p < 0.01). (B) Differentially methylated promoter sites of the PHYTOENE SYNTHASE 1 (PSY1), PHYTOENE DESATURASE (PDS), 15-CIS- ζ-CAROTENE (ZISO) and ZETA-CAROTENE DESATURASE (ZDS) loci between the phyB1B2 and WT genotypes. Orange bars indicate cytosine methylation levels in breaker (BK) fruits. Thick blue lines indicate RIN binding sites according to ChIP-seq data (Zhong et al., 2013). (C) Relative expression of carotenoid biosynthetic enzyme-encoding genes in immature green (IG), mature green (MG), BK and RR fruits from phyB1B2 determined by RT-qPCR. Red dots indicate data from RNA-seq in the same stage. The expression levels represent the mean of at least three biological replicates and are relative to WT. Asterisks indicate statistically significant differences by the two-tailed Student’s t-test compared to WT (*p < 0.05 and **p < 0.01).
Figure 6
Figure 6
Positional distribution and enrichment of TF binding sites on PHYB1B2 regulated genes. The three gene dataset analyzed were: upregulated (red), downregulated (blue) and chromatin-remodeling (black) DEGs in phyB1B2 at breaker stage. (A) Additive gene fraction harboring the indicated element in comparison with randomly chosen gene set (grey). (B) Over-representation of elements in the regulated genes in comparison to the randomly chosen gene set by subtracting the curves shown in (A). The enrichment score, z-score and p-value for each class of TF are shown from left to right as inset. PIF includes PHYTOCHROME INTERACTING FACTOR 1,3,4,5 and 7 sites; HYx includes ELONGATED HYPOCOTYL 5 (HY5) and HY5 HOMOLOG (HYH) from Jaspar Database; RIN sites are based in the peak calling of ChIP-seq data (Zhong et al., 2013). X axis indicates upstream distance from the transcription start site (TSS).
Figure 7
Figure 7
Conceptual model linking PHYB1B2 receptors, epigenetic mechanisms of gene expression regulation and fruit ripening. Active PHYB1B2, through the inactivation of PIFs and stabilization of HYx, regulates the expression of chromatin organization associated genes such as METL1, PRMT, HDT3, and DDM1, resulting in DNA demethylation and the induction of RIN ripening master TF expression. RIN targets include chromatin organization genes resulting in a positive feedback loop. Moreover, RIN enhances its own transcription, as well as other TFs (such as NOR, CNR, and AP2a) that finally induce a myriad of effectors triggering ripening.

Similar articles

Cited by

References

    1. Akalin A., Kormaksson M., Li S., Garrett-Bakelman F. E., Figueroa M. E., Melnick A., et al. . (2012). MethylKit: a comprehensive R package for the analysis of genome-wide DNA methylation profiles. Genome Biol. 13:R87. doi: 10.1186/gb-2012-13-10-R87, PMID: - DOI - PMC - PubMed
    1. Alba R., Cordonnier-Pratt M. M., Pratt L. H. (2000a). Fruit-localized phytochromes regulate lycopene accumulation independently of ethylene production in tomato. Plant Physiol. 123, 363–370. doi: 10.1104/pp.123.1.363, PMID: - DOI - PMC - PubMed
    1. Alba R., Kelmenson P. M., Cordonnier-Pratt M.-M., Pratt L. H. (2000b). The phytochrome gene family in tomato and the rapid differential evolution of this family in angiosperms. Mol. Biol. Evol. 17, 362–373. doi: 10.1093/oxfordjournals.molbev.a026316, PMID: - DOI - PubMed
    1. Alves F. R. R., Lira B. S., Pikart F. C., Monteiro S. S., Furlan C. M., Purgatto E., et al. . (2020). Beyond the limits of photoperception: constitutively active PHYTOCHROME B2 overexpression as a means of improving fruit nutritional quality in tomato. Plant Biotechnol. J. 18, 2027–2041. doi: 10.1111/pbi.13362, PMID: - DOI - PMC - PubMed
    1. Axtell M. J. (2013). ShortStack: comprehensive annotation and quantification of small RNA genes. RNA 19, 740–751. doi: 10.1261/rna.035279.112, PMID: - DOI - PMC - PubMed