. 2022 Apr 27:13:857535.
doi: 10.3389/fpls.2022.857535. eCollection 2022.

Understanding Willow Transcriptional Response in the Context of Oil Sands Tailings Reclamation

Affiliations

Understanding Willow Transcriptional Response in the Context of Oil Sands Tailings Reclamation

Abdul Samad et al. Front Plant Sci. .

Abstract

One of the reclamation objectives for treated oil sands tailings (OST) is to establish boreal forest communities that can integrate with the surrounding area. Hence, selection of appropriate soil reclamation cover designs and plant species for revegetation are important aspects of tailings landform reclamation and closure. Research and monitoring of the long term and immediate impacts of capped OST on the growth and survival of native boreal plant species are currently underway. However, plant responses to OST-associated toxicity are not well known at the molecular level. Using RNA sequencing, we examined the effects of three types of OST on the willow transcriptome under different capping strategies. The transcriptomic data showed that some genes respond universally and others in a specific manner to different types of OST. Among the dominant and shared upregulated genes, we found some encoding protein detoxification (PD), Cytochrome P450 (CYPs), glutathione S-transferase regulatory process (GST), UDP-glycosyltransferase (UGT), and ABC transporter and regulatory process associated proteins. Moreover, genes encoding several stress-responsive transcription factors (bZIP, BHLH, ERF, MYB, NAC, WRKY) were upregulated with OST-exposure, while high numbers of transcripts related to photosynthetic activity and chloroplast structure and function were downregulated. Overall, the expression of 40 genes was found consistent across all tailings types and capping strategies. The qPCR analysis of a subset of these shared genes suggested that they could reliably distinguish plants exposed to different OST associated stress. Our results indicated that it is possible to develop OST stress exposure biosensors merely based on changes in the level of expression of a relatively small set of genes. The outcomes of this study will further guide optimization of OST capping and revegetation technology by using knowledge based plant stress adaptation strategies.

Keywords: oil sands tailings; polycyclic aromatic hydrocarbon; reclamation; transcriptome; willow.


Conflict of interest statement

The authors declare that the research was conducted in the absence of any commercial or financial relationships that could be construed as a potential conflict of interest.

Figures

FIGURE 1
FIGURE 1
Diagram of experimental design in which willow (Salix bebbiana) was grown in different types of oil sand tailings (with or without capping of different depths) along with various plant communities. Gray plants represent the signs of OST-related stress (i.e., columns covered with no reclamation cap or 5 cm of reclamation cap) and green plants represent no sign of stress (i.e., columns with ≥30 cm of reclamation cap). Four columns were assembled for each treatment (n = 4). T, treatment; C, control; CF, centrifuge tailings; CM, co-mix tailings; TT, thickened tailings; PMM, peat mineral mix; Till, mineral substrate (classified as sandy clay loam soil with low organic carbon).
FIGURE 2
FIGURE 2
Gene expression of willow exposed to different types of oil sands tailings (OST) stress. Willow grown on CF (with or without capping) along with graminoid (A) or shrubby (B) plant community. Willow grown along with graminoid fen community on CM with 5 cm capping compared to 90 cm capping (C) or 40 cm capping (D). Willow grown on TT tailings (with or without capping) along with wetland plant community (E). Volcano plots show the log transformed adjusted p-values of genes plotted on the y-axis and log2 fold change values on the x-axis. Dotted line indicates cut-off of p-values and log2 fold change. Top 10 (5 upregulated and 5 downregulated) genes are labeled and functions of theses genes are shown in Figure 3. FC, fold change; Padj, BH-adjusted p-values; CF, centrifuge tailings; CM, co-mix tailings; TT, thickened tailings.
FIGURE 3
FIGURE 3
Gene expression and annotation of top 10 highly impacted genes (i.e., with highest log2 fold change in treatments compared to control in each group) of willow grown in different types of oil sands tailings with no reclamation cap or 5 cm of reclamation cap (treatments) compared with ≥30 cm of reclamation cap (controls). CF, centrifuge tailings; CM, co-mix tailings; TT, thickened tailings.
FIGURE 4
FIGURE 4
Significantly enriched gene ontology (GO) terms annotated to differentially expressed genes (DEGs) of willow grown in different types of oil sands tailings with no reclamation cap or 5 cm of reclamation cap (treatments) compared with ≥30 cm of reclamation cap (controls). The top 10 highly enriched GO terms (biological process) in each group (A) and GO terms (biological process) shared among all groups (B) for CF, CM, and TT are shown. Significant enriched genes (p-value < 0.05) are colored according to −log10 p-value and the dot size indicates the number of sequences annotated with GO term (Seq_Counts). CF, centrifuge tailings; CM, co-mix tailings; TT, thickened tailings.
FIGURE 5
FIGURE 5
Shared and group specific differentially expressed genes (DEGs) in willow grown in different types of oil sands tailings with no reclamation cap or 5 cm of reclamation cap (treatments) compared with ≥30 cm of reclamation cap (controls). Functions and locus tags of genes which are shared among all groups are shown in dot plot (A). Numbers of significantly upregulated genes that are shared and unique in each group (B) and numbers of significantly downregulated genes that are shared and unique in each group (C) are shown in Venn diagrams. Only genes with BH-adjusted p-values < 0.05 and log2 fold change >2 in each group were considered significantly deregulated and the dot size corresponds to the −log10 p-value. Genes validated with qPCR are highlighted by filled dots. CF, centrifuge tailings; CM, co-mix tailings; TT, thickened tailings.
FIGURE 6
FIGURE 6
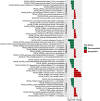
Differentially expressed genes (DEGs) in willow in response to oil sands tailings induced stress. DEGs involved in xenobiotic detoxification pathways (A) and in stress-responsive transcription factors (B) (known from other studies, Yoon et al., 2020). Red indicates upregulated genes and blue indicates downregulated genes (only significantly deregulated genes LFC > 2, padj < 0.05 are shown in the figure). Cytochrome P450 (CYPs), glutathione S-transferase regulatory process (GST), protein detoxification (PD), ABC transporters (Transporters), UDP-glycosyltransferase (UGT), Basic helix-loop-helix (bHLH), Basic leucine zipper (bZIP), Ethylene-responsive factor (ERF), NAC [derived from no apical meristem (NAM), Arabidopsis transcription activator factor 1/2 (ATAF1/2), and cup-shaped cotyledon 2 (CUC2)], MYB [MYB (myeloblastosis) family of transcription factors]. CF, centrifuge tailings; CM, co-mix tailings; TT, Thickened tailings.

References

    1. Abhilash P. C., Jamil S., Singh N. (2009). Transgenic plants for enhanced biodegradation and phytoremediation of organic xenobiotics. Biotechnol. Adv. 27 474–488. 10.1016/j.biotechadv.2009.04.002 - DOI - PubMed
    1. Ahmed M., Kim D. R. (2018). Pcr: an R package for quality assessment, analysis and testing of qPCR data. PeerJ 6:e4473. 10.7717/peerj.4473 - DOI - PMC - PubMed
    1. Argus G. W. (2007). Salix (Salicaceae) distribution maps and a synopsis of their classification in North America, North of Mexico. Harv. Pap. Bot. 12 335–368. 10.3100/1043-4534(2007)12[335:ssdmaa]2.0.co;2 - DOI
    1. Azam S., Rima U. S. (2014). Oil sand tailings characterisation for centrifuge dewatering. Environ. Geotech. 1 189–196. 10.1680/envgeo.13.00044 - DOI
    1. Badiozamani M. M., Askari-Nasab H. (2014). Integration of reclamation and tailings management in oil sands surface mine planning. Environ. Model. Softw. 51 45–58. 10.1016/j.envsoft.2013.09.026 - DOI