Review
. 2022;218(4):28.
doi: 10.1007/s11214-022-00895-2. Epub 2022 May 9.

In Situ Observations of Interstellar Pickup Ions from 1 au to the Outer Heliosphere

Affiliations
Review

In Situ Observations of Interstellar Pickup Ions from 1 au to the Outer Heliosphere

E J Zirnstein et al. Space Sci Rev. 2022.

Abstract

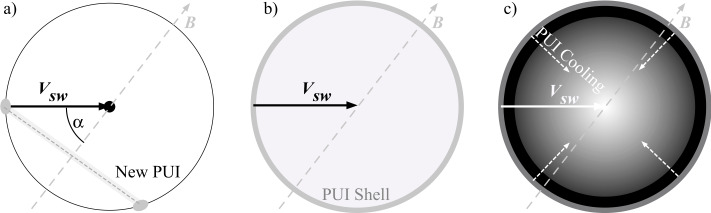
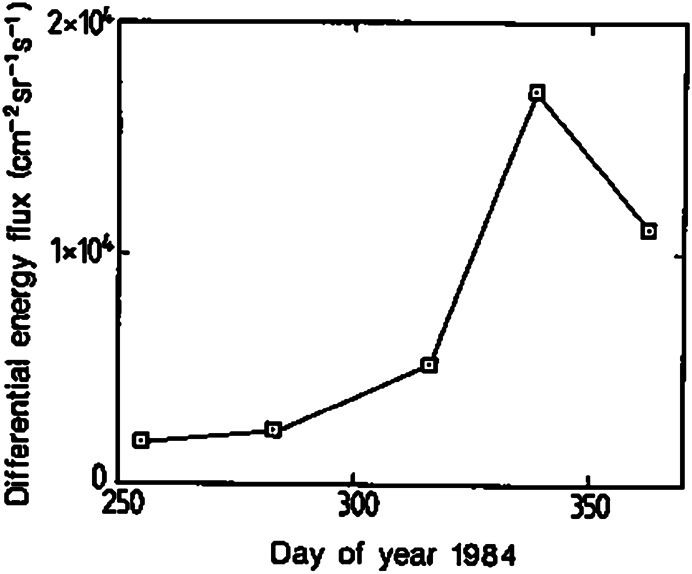
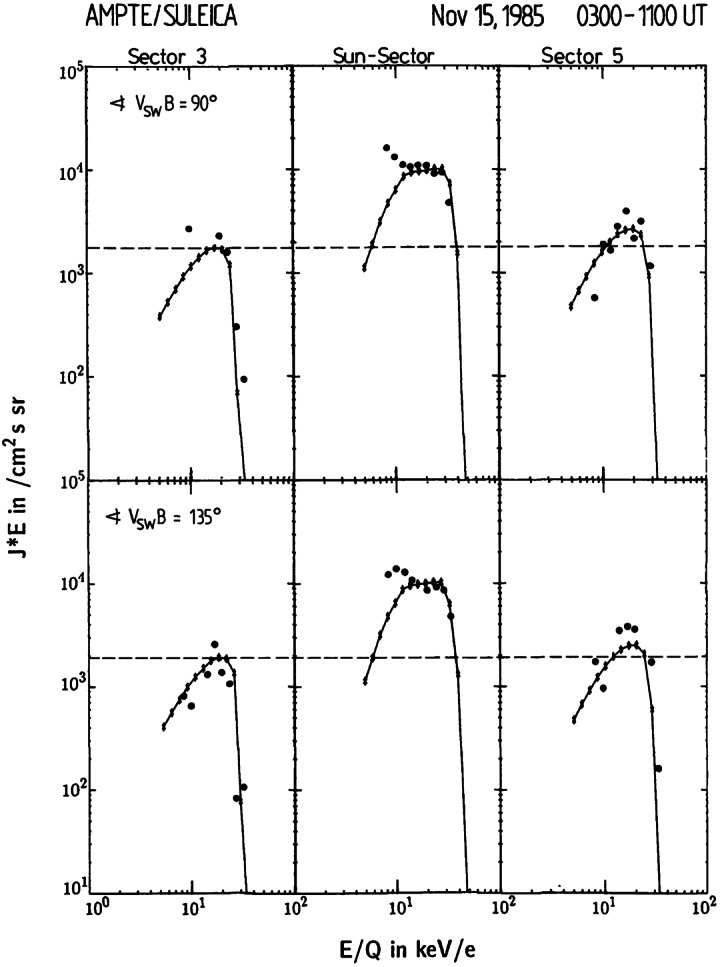
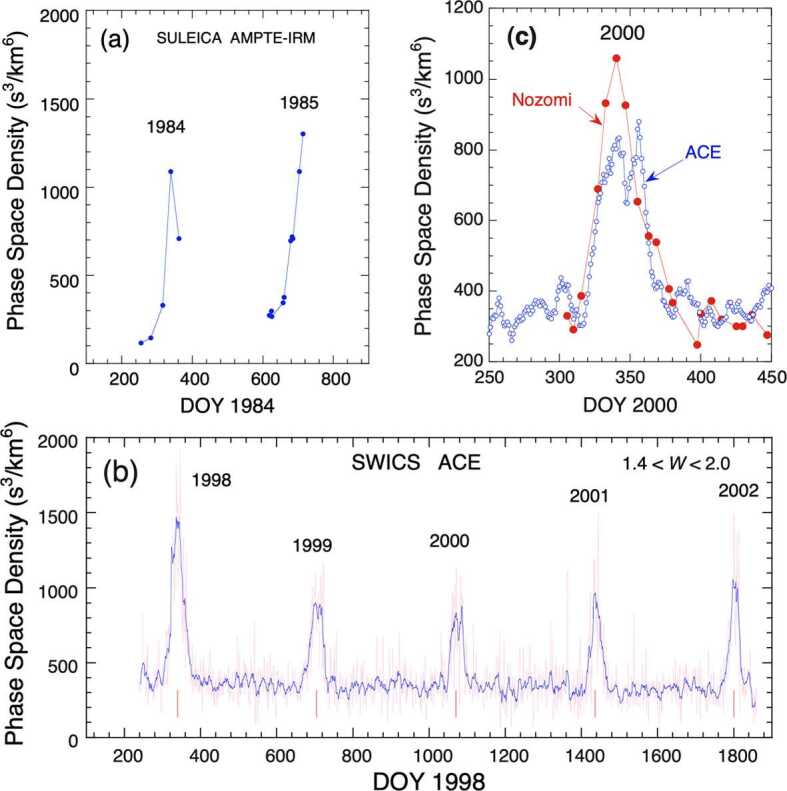
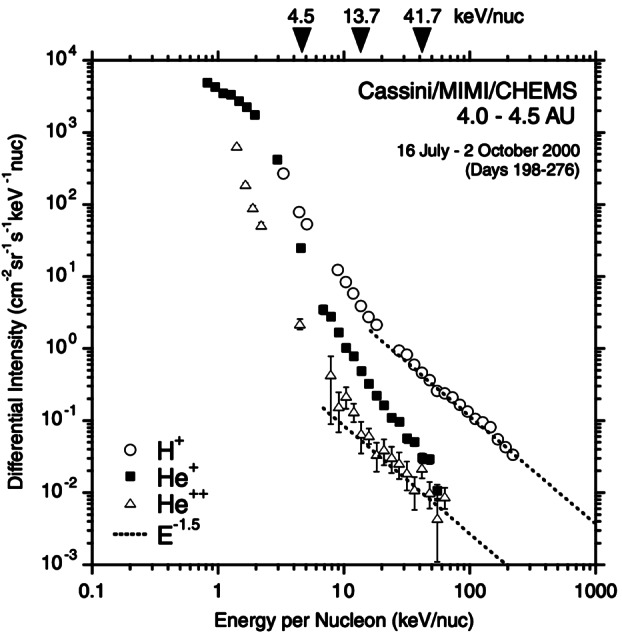
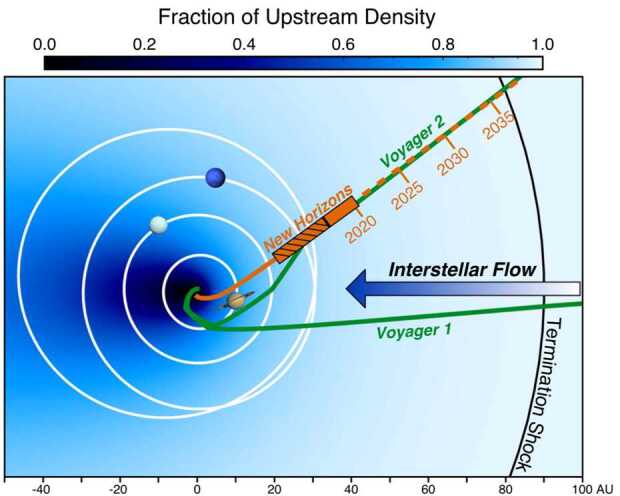
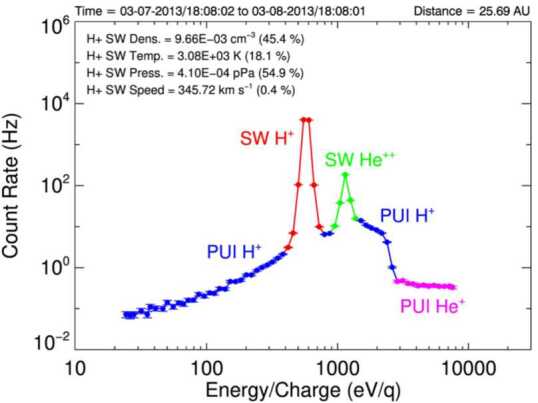
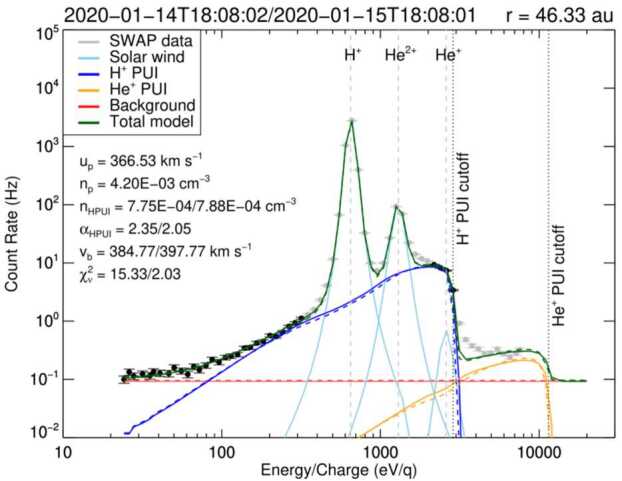
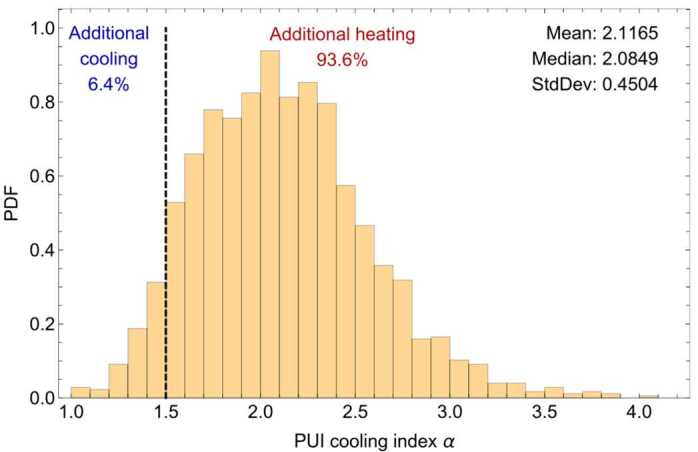
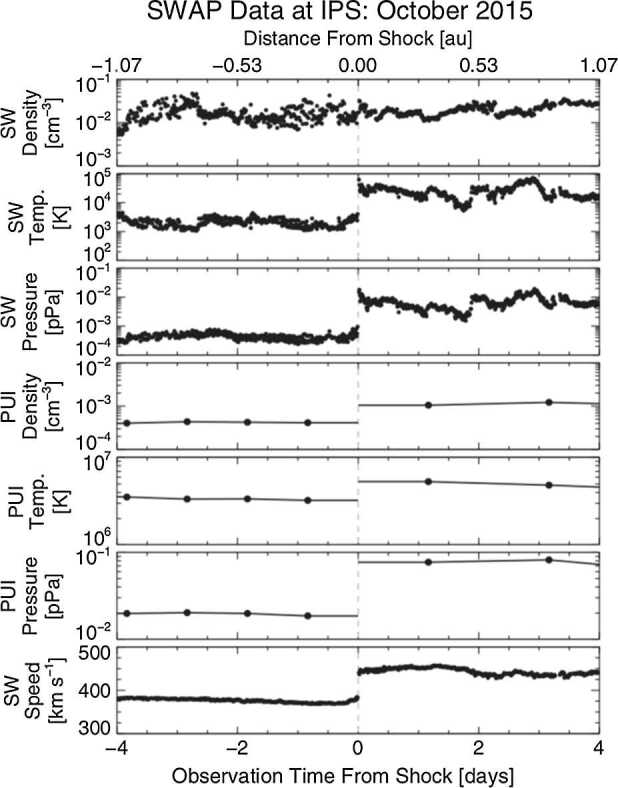
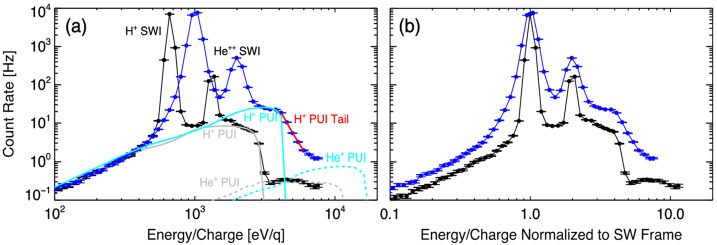
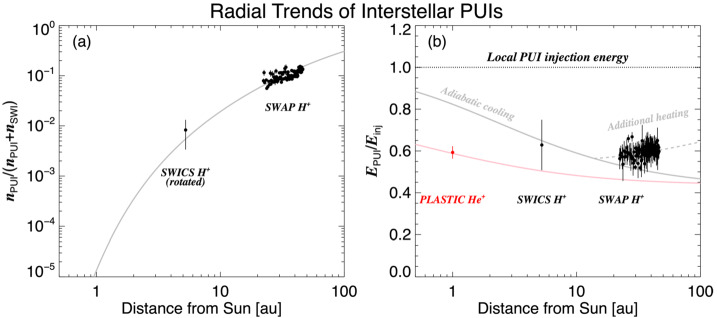
Interstellar pickup ions are an ubiquitous and thermodynamically important component of the solar wind plasma in the heliosphere. These PUIs are born from the ionization of the interstellar neutral gas, consisting of hydrogen, helium, and trace amounts of heavier elements, in the solar wind as the heliosphere moves through the local interstellar medium. As cold interstellar neutral atoms become ionized, they form an energetic ring beam distribution comoving with the solar wind. Subsequent scattering in pitch angle by intrinsic and self-generated turbulence and their advection with the radially expanding solar wind leads to the formation of a filled-shell PUI distribution, whose density and pressure relative to the thermal solar wind ions grows with distance from the Sun. This paper reviews the history of in situ measurements of interstellar PUIs in the heliosphere. Starting with the first detection in the 1980s, interstellar PUIs were identified by their highly nonthermal distribution with a cutoff at twice the solar wind speed. Measurements of the PUI distribution shell cutoff and the He focusing cone, a downwind region of increased density formed by the solar gravity, have helped characterize the properties of the interstellar gas from near-Earth vantage points. The preferential heating of interstellar PUIs compared to the core solar wind has become evident in the existence of suprathermal PUI tails, the nonadiabatic cooling index of the PUI distribution, and PUIs' mediation of interplanetary shocks. Unlike the Voyager and Pioneer spacecraft, New Horizon's Solar Wind Around Pluto (SWAP) instrument is taking the only direct measurements of interstellar PUIs in the outer heliosphere, currently out to 47 au from the Sun or halfway to the heliospheric termination shock.

Keywords: Acceleration; Heating; Heliosphere; Interstellar medium; Interstellar neutrals; Pickup ion.


Figures

Fig. 1
Fig. 1
Cut through the PUI velocity distribution in the VswB plane. (a) New PUIs form a ring around B on a spherical shell with radius Vsw at the pitch-angle α. (b) Rapid pitch-angle scattering distributes the PUIs isotropically over this outermost velocity shell. (c) On a slower timescale, the radial expansion of the solar wind leads to adiabatic cooling of the PUIs, thus shrinking the shell, while newly injected PUIs continually fill the outermost shell at larger distances r from the Sun. The final PUI velocity distribution fills a sphere around the core solar wind
Fig. 2
Fig. 2
Differential energy flux of He+ PUIs as measured by the SULEICA instrument onboard AMPTE-IRM at 20 keV as a function of time between September and December 1984. From Möbius et al. (1985b). Reproduced with permission from Springer Nature
Fig. 3
Fig. 3
AMPTE-IRM SULEICA observations of interstellar He+ PUIs (filled circles) from sectors pointed near the Sun. Measurements correspond to times when the solar wind speed VSW=680kms1 and the angle between the solar wind flow velocity and IMF was 90 and 135. Models for the PUI distribution functions following Vasyliunas and Siscoe (1976) are also shown (stars with solid curve). From Möbius et al. (1988). Reproduced with permission from Springer Nature
Fig. 4
Fig. 4
Observations of the He-focusing cone, as seen in the He+ PUI phase space density observed near 1 au in 1984, 1985, and 1998–2002. (a) AMPTE-IRM SULEICA and (b) ACE SWICS made observations near Earth and L1, respectively. (c) ACE and Nozomi observations are also compared for observations in 2000. The peak location of the He focusing cone is found on DOY 339.75, corresponding to Earth’s crossing of the cone center at longitude λ=74.6. From Gloeckler et al. (2004). © ESO. Reproduced with permission
Fig. 5
Fig. 5
Cassini CAPS measurements of He+ (left) and H+ (right) PUI fluxes divided by their 17-month average as Cassini traveled between 6.4 and 8.2 au downstream of the Sun. As demonstrated by the model results (solid curves), the He+ PUI density decreased over long-term as Cassini traveled away from the interstellar He-focusing cone, and the H+ PUI density increased over long-term as it traveled outside of the interstellar H shadow. From McComas et al. (2004)
Fig. 6
Fig. 6
(Left) wCut-off in the solar wind frame obtained from a fit to each daily PUI distribution with the statistical fit errors. The model curve shows a constant offset, likely due to the simplifications that do not consider the exact cut-off shape nor an integration over the sensor FOV and energy bands. (Right) Pearson correlation coefficient between the cut-off values on the left and the same values mirror-imaged about a mirror line shown as a function of λM. Also shown is a fit with a cosine function. The maximum correlation is associated with the upwind direction of the ISN flow. From Möbius et al. (2015, 2016b). © AAS. Reproduced with permission
Fig. 7
Fig. 7
Velocity distribution functions as a function of w=v/VSW for H+ and He+ observed by Ulysses SWICS during a time when Ulysses was in the high latitude, fast solar wind. Multiple populations of ions were observed, including the core SWIs, interstellar PUIs, and the inner source PUIs. Fits to the interstellar PUI distributions assuming strong pitch angle scattering (“isotropic”, dashed) and weak pitch angle scattering (solid) are also shown, indicating better agreement under the assumption of weaker scattering allowing anisotropic distributions to form. From Gloeckler and Geiss (2001b). © Springer. Reproduced with permission
Fig. 8
Fig. 8
H+ PUI distribution function as measured by Ulysses SWICS. Measurements were taken from 1996–2000 at 4.8au from the Sun. Model fits to the PUI core (dotted curve) and suprathermal tail with slope w5 yield a total distribution fit (solid curve). From Fisk and Gloeckler (2006). © AAS. Reproduced with permission
Fig. 9
Fig. 9
Observations of H+ and He+ PUIs and solar wind He2+ from Cassini CHEMS measured during quiet times in the solar wind. The E1.5 common spectrum proposed by Fisk and Gloeckler is also shown. From Hill et al. (2009). © AAS. Reproduced with permission
Fig. 10
Fig. 10
Temporal evolution of solar wind speed and density (top), magnetic field strength (center), and suprathermal tail count rate, normalized to the PUI count rate (bottom) across a solar wind compression region in a superposed epoch analysis. Adapted from Möbius et al. (2019)
Fig. 11
Fig. 11
(a) Spectra of H+, He2+, and He+ ions measured by Ulysses SWICS as a function of particle speed in the spacecraft reference frame. (b) Spectra in the solar wind plasma reference frame assuming that the phase density is only a function of particle speed in the plasma reference frame in each channel of the instrument. In some speed ranges, particles with the same speed are measured by sunward and anti-sunward facing channels separately, which results in two tracks of the distribution function. The low-speed parts of the H+ and He2+ spectra are dominated by the solar wind ions, which can be fit with a kappa distribution as shown by the red and green dashed curves. The low-speed part of the He+ spectrum is fit with a spectrum for inner source PUIs (Schwadron et al. 2000). (c) Interstellar PUI spectra after subtraction of fitted spectra of the solar wind H+ and He2+ ions and inner source He+ PUIs. It shows that the interstellar PUIs are not isotropic in the plasma reference frame. (d) Radial dependence of interstellar neutral H and He density derived using the PUI distribution formula from Vasyliunas and Siscoe (1976). We note that the radial dependence of He density derived here likely needs a modification because the anisotropy of freshly produced He+ PUIs causes a significant underestimation of the PUI flux
Fig. 12
Fig. 12
Illustration of New Horizons’ trajectory through the heliosphere (orange). The latest SWAP data release includes measurements taken over the time covered by the orange boxes. Trajectories of Voyagers 1 and 2 are also shown. From McComas et al. (2021)
Fig. 13
Fig. 13
SWAP observations at 25.7 au from the Sun. The spectrum is color-coded to show the primary source of the counts. The blue spectra identify the H+ PUI observations that are fit with a generalized filled-shell distribution. From McComas et al. (2017b). © AAS. Reproduced with permission
Fig. 14
Fig. 14
SWAP observations at 46.33 au from the Sun. Solar wind H+ and He2+ are fit with kappa functions, H+ PUIs are fit with a generalized filled shell (Eq. (5)). From McComas et al. (2021)
Fig. 15
Fig. 15
Histogram of PUI distribution cooling index from SWAP observations between 22 and 47 au. From McComas et al. (2021)
Fig. 16
Fig. 16
SWAP observations at an interplanetary shock 34au from the Sun. SWI measurements are made at a higher cadence (10 min) than PUI measurements (1 day). From Zirnstein et al. (2018). © APS. Reproduced with permission
Fig. 17
Fig. 17
SWAP count rates before (black) and after (blue) the shock binned over 24 hrs. Fits to the PUI filled shell upstream and downstream are shown as gray and cyan, and a fit to the downstream PUI tail is shown in red. From Zirnstein et al. (2018). © APS. Reproduced with permission
Fig. 18
Fig. 18
(left) SWAP PUI measurements between 22 and 47 au (gray data points). Power-law functions are fit to solar rotation-averaged values (black data with uncertainties), whose uncertainties represent the time variability within each time-averaged sample. The power law fits are shown in black and nominal values of PUI parameters at 45 au in red. (right) Ratios of daily-averaged parameters (gray) and ratios binned over solar rotation (black). Power-law fits to the ratios are shown in black. From McComas et al. (2021)
Fig. 19
Fig. 19
Density of interstellar neutral H as a function of distance from the Sun derived from SWAP observations. Extrapolation of H density to the upwind HTS reveals a density value that is 40% larger than previous estimates. From Swaczyna et al. (2020). © AAS. Reproduced with permission
Fig. 20
Fig. 20
Interstellar H+ (black) and He+ (red) PUI observations made by STEREO PLASTIC at 1 au, Ulysses SWICS at 5 au, and New Horizons’ SWAP at 22–47 au. (a) Ratio of interstellar H+ PUI density to total proton density (SWI + PUI). (b) Ratio of interstellar PUI thermal energy to local injection energy. Models of the density and energy ratios are also shown. New Horizons and Ulysses observations are made at different ecliptic longitudes and reflect different ionization cavity sizes; therefore, we rotate SWICS H+ PUI densities towards the longitude of New Horizons’ trajectory

References

    1. Adams T.F., Frisch P.C. Astrophys. J. 1977;212:300.
    1. Allegrini F., Schwadron N.A., McComas D.J., Gloeckler G., Geiss J. J. Geophys. Res. Space Phys. 2005;110:A05105.
    1. Ariad D., Gedalin M. J. Geophys. Res. Space Phys. 2013;118:2854.
    1. Axford W.I. NASA Spec. Publ. 1972;308:609.
    1. Bagenal F., Delamere P.A., Elliott H.A., Hill M.E., Lisse C.M., McComas D.J., McNutt R.L., Jr., Richardson J.D., Smith C.W., Strobel D.F. J. Geophys. Res., Planets. 2015;120:1497.

LinkOut - more resources