

Prognostic Nomogram Based on the Metastatic Lymph Node Ratio for T1-4N0-1M0 Pancreatic Neuroendocrine Tumors After Surgery
- PMID: 35574346
- PMCID: PMC9092648
- DOI: 10.3389/fonc.2022.899759
Prognostic Nomogram Based on the Metastatic Lymph Node Ratio for T1-4N0-1M0 Pancreatic Neuroendocrine Tumors After Surgery
Abstract
Purpose: This study aimed to investigate the prognostic significance of the metastatic lymph node ratio (LNR) in patients with pancreatic neuroendocrine tumors (pNETs) and to develop and validate nomograms to predict 5-, 7-, and 10-year overall survival (OS) and cancer-specific survival (CSS) rates for pNETs after surgical resection.
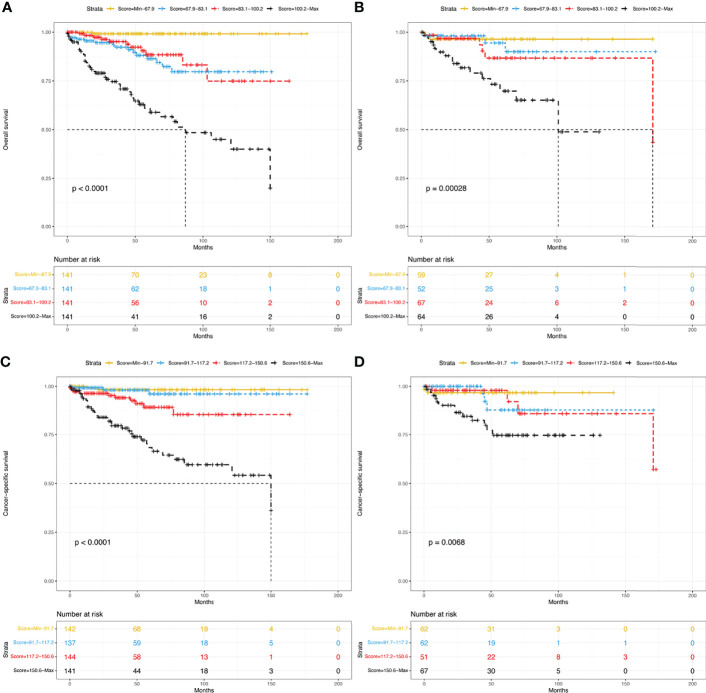
Methods: The demographics and clinicopathological information of T1-4N0-1M0 pNET patients between 2004 and 2018 were extracted from the Surveillance, Epidemiology and End Results database. X-tile software was used to determine the best cutoff value for the LNR. Patients were randomly divided into the training and the validation groups. A Cox regression model was used in the training group to obtain independent prognostic factors to develop nomograms for predicting OS and CSS. The concordance index (C-index), calibration curves, area under the receiver operating characteristic curve (AUC) and decision curve analysis (DCA) were used to assess the nomograms. Patients were divided into four groups according to the model scores, and their survival curves were generated by the Kaplan-Meier method.
Results: A total of 806 patients were included in this study. The best cutoff value for the LNR was 0.16. The LNR was negatively correlated with both OS and CSS. Age, sex, marital status, primary site, grade, the LNR and radiotherapy were used to construct OS and CSS nomograms. In the training group, the C-index was 0.771 for OS and 0.778 for CSS. In the validation group, the C-index was 0.737 for OS and 0.727 for CSS. The calibration curves and AUC also indicated their good predictability. DCA demonstrated that the nomograms displayed better performance than the American Joint Committee on Cancer (AJCC) TNM staging system (8th edition). Risk stratification indicated that patients with higher risk had a worse prognosis.
Conclusions: The LNR is an independent negative prognostic factor for pNETs. The nomograms we built can accurately predict long-term survival for pNETs after surgery.
Keywords: cancer-specific survival; lymph node ratio; nomogram; overall survival; pancreatic neuroendocrine tumors.
Copyright © 2022 Shi, Liu, Cao, Shan, Ren, Zhang and Wang.
Conflict of interest statement
The authors declare that the research was conducted in the absence of any commercial or financial relationships that could be construed as a potential conflict of interest.
Figures


Similar articles
-
Development and validation of lymph node ratio-based nomograms for primary duodenal adenocarcinoma after surgery.Front Oncol. 2022 Oct 4;12:962381. doi: 10.3389/fonc.2022.962381. eCollection 2022. Front Oncol. 2022. PMID: 36276093 Free PMC article.
-
Developing and validating a prognostic nomogram for ovarian clear cell carcinoma patients: A retrospective comparison of lymph node staging schemes with competing risk analysis.Front Oncol. 2022 Nov 9;12:940601. doi: 10.3389/fonc.2022.940601. eCollection 2022. Front Oncol. 2022. PMID: 36439411 Free PMC article.
-
Development of a Nomogram-Based Online Calculator for Predicting Cancer-Specific Survival in Patients With Digestive Tract Mixed Neuroendocrine-Non-Neuroendocrine Neoplasms (MiNENs): An Analysis of the SEER Database.Cancer Rep (Hoboken). 2025 Feb;8(2):e70156. doi: 10.1002/cnr2.70156. Cancer Rep (Hoboken). 2025. PMID: 39972644 Free PMC article.
-
Establishment of nomogram to predict overall survival and cancer-specific survival of local tumor resection in patients with colorectal cancer liver metastasis with unresectable metastases: a large population-based analysis.Discov Oncol. 2024 Jul 29;15(1):315. doi: 10.1007/s12672-024-01182-y. Discov Oncol. 2024. PMID: 39073708 Free PMC article.
-
Dynamic nomograms combining N classification with ratio-based nodal classifications to predict long-term survival for patients with lung adenocarcinoma after surgery: a SEER population-based study.BMC Cancer. 2021 Aug 4;21(1):653. doi: 10.1186/s12885-021-08410-6. BMC Cancer. 2021. PMID: 34344326 Free PMC article.
Cited by
-
A Lymph Node Ratio Model for Prognosis of Patients with Pancreatic Neuroendocrine Tumors.Biomedicines. 2023 Jan 30;11(2):407. doi: 10.3390/biomedicines11020407. Biomedicines. 2023. PMID: 36830943 Free PMC article.
-
Nomogram-Based Prediction of Overall and Disease-Specific Survival in Patients With Postoperative Major Salivary Gland Squamous Cell Carcinoma.Technol Cancer Res Treat. 2022 Jan-Dec;21:15330338221117405. doi: 10.1177/15330338221117405. Technol Cancer Res Treat. 2022. PMID: 35950233 Free PMC article.
-
Development and validation of lymph node ratio-based nomograms for primary duodenal adenocarcinoma after surgery.Front Oncol. 2022 Oct 4;12:962381. doi: 10.3389/fonc.2022.962381. eCollection 2022. Front Oncol. 2022. PMID: 36276093 Free PMC article.
-
Combining lymph node ratio to develop prognostic models for postoperative gastric neuroendocrine neoplasm patients.World J Gastrointest Oncol. 2024 Aug 15;16(8):3507-3520. doi: 10.4251/wjgo.v16.i8.3507. World J Gastrointest Oncol. 2024. PMID: 39171165 Free PMC article.
References
-
- Fathi AH, Romanyshyn J, Barati M, Choudhury U, Chen A, Sosa JA. Predicting Aggressive Behavior in Nonfunctional Pancreatic Neuroendocrine Tumors With Emphasis on Tumor Size Significance and Survival Trends: A Population-Based Analysis of 1787 Patients. Am Surg (2020) 86:458–66. doi: 10.1177/0003134820919730 - DOI - PubMed
LinkOut - more resources
Full Text Sources