. 2022 Apr 27:12:835642.
doi: 10.3389/fonc.2022.835642. eCollection 2022.

MET Inhibition Sensitizes Rhabdomyosarcoma Cells to NOTCH Signaling Suppression

Affiliations

MET Inhibition Sensitizes Rhabdomyosarcoma Cells to NOTCH Signaling Suppression

Clara Perrone et al. Front Oncol. .

Abstract

Rhabdomyosarcoma (RMS) is a pediatric myogenic soft tissue sarcoma. The Fusion-Positive (FP) subtype expresses the chimeric protein PAX3-FOXO1 (P3F) while the Fusion-Negative (FN) is devoid of any gene translocation. FP-RMS and metastatic FN-RMS are often unresponsive to conventional therapy. Therefore, novel therapeutic approaches are needed to halt tumor progression. NOTCH signaling has oncogenic functions in RMS and its pharmacologic inhibition through γ-secretase inhibitors blocks tumor growth in vitro and in vivo. Here, we show that NOTCH signaling blockade resulted in the up-regulation and phosphorylation of the MET oncogene in both RH30 (FP-RMS) and RD (FN-RMS) cell lines. Pharmacologic inhibition of either NOTCH or MET signaling slowed proliferation and restrained cell survival compared to control cells partly by increasing Annexin V and CASP3/7 activation. Co-treatment with NOTCH and MET inhibitors significantly amplified these effects and enhanced PARP1 cleavage in both cell lines. Moreover, it severely hampered cell migration, colony formation, and anchorage-independent growth compared to single-agent treatments in both cell lines and significantly prevented the growth of FN-RMS cells grown as spheroids. Collectively, our results unveil the overexpression of the MET oncogene by NOTCH signaling targeting in RMS cells and show that MET pathway blockade sensitizes them to NOTCH inhibition.

Keywords: MET; NOTCH signaling; combination therapy; drug resistance; rhabdomyosarcoma; soft tissue sarcoma; targeted therapy; γ-secretase.


Conflict of interest statement

The authors declare that the research was conducted in the absence of any commercial or financial relationships that could be construed as a potential conflict of interest.

Figures

Figure 1
Figure 1
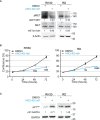
NOTCH signaling inhibition drives MET up-regulation and activation in RMS cells. (A) Representative (n=3 independent biological replicates) Western Blot depicting the effect of NOTCH1 and NOTCH3 silencing on MET protein levels in FP-RMS (RH30, RH4) and FN-RMS (RD, JR1) cells. Cells were harvested 48h post-transfection and the protein levels of the intracellular cleaved domain (ICD) of NOTCH1 and NOTCH3 (N1CD and N3ICD) were assessed (siCTR indicates the control siRNA sample). Migration of molecular weight markers is indicated on the right (kDa). Tubulin levels were used as loading control. (B) Dose-response curves of RH30, RH4, RD and JR1 cells treated with the NOTCH inhibitor PF-03084014 (PF-0308). Graph represents the mean of three independent experiment ± SEM. (C) Representative (n = 3 independent biological replicates) Western Blot of RH30 and RH4 cells treated with PF-03084014 (20 μM) for 48h and of RD and JR1 cells treated with PF-03084014 (10 μM) for 72h. The radiographs show total (MET) and activated/phosphorylated (pMET Y1234/1235) MET protein levels. N1ICDVal1744 levels have been used as treatment control and β-Actin as loading control. Migration of molecular weight markers is indicated on the right (kDa).
Figure 2
Figure 2
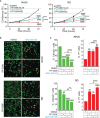
Pharmacologic inhibition of NOTCH signaling hampers RMS cells growth. (A) Growth-curve analysis of RH30 (left) and RD (right) cells treated with PF-03084014 (20 μM and 10 μM, respectively) for 24h, 48h and 72h. Graph represents the mean of three independent experiments ± SD, Student two-tailed T-Test. $$ P-value ≤ 0.01, $$$ P-value ≤ 0.001, $$$$ P-value ≤ 0.0001 for drug-treated vs vehicle-treated (DMSO) cells. (B) Representative radiographs showing p21Cip1 protein levels in RH30 and RD cells treated with PF-03084014 (20 μM for 48h and 10 μM for 72h, respectively). Migration of molecular weight markers is indicated on the right (kDa). GAPDH was used as loading control.
Figure 3
Figure 3
Pharmacologic inhibition of MET signaling causes RMS cells growth arrest. (A) Representative radiographs showing the effect of ARQ197 (ARQ 400 nM) on RH30 cells (48h) and RD cells (72h) on total and phosphorylated (pMETY1234/1235) MET protein levels. Migration of molecular weight markers is indicated on the right (kDa). β-Actin was the loading control. (B) Growth-curves of RH30 (left) and RD (right) cells treated with ARQ197 (ARQ 400 nM) for 24h, 48h and 72h. Graphs represent the mean of three independent experiments ± SD, Student two-tailed T-Test. $$ P-value ≤ 0.01, $$$ P-value ≤ 0.001, $$$$ P-value ≤ 0.0001 for drug-treated cells vs vehicle-treated (DMSO) cells. (C) Representative radiographs showing p21Cip1 protein levels in RH30 and RD cells treated with 400 nM of ARQ197 for 48h and 72h, respectively. Migration of molecular weight markers is indicated on the right (kDa). GAPDH was used as loading control.
Figure 4
Figure 4
NOTCH and MET signaling co-inhibition hampers RMS cells growth and induces cell death. (A) Growth-curves of RH30 and RD cells treated for 24h, 48h and 72h with either 20 µM or 10 µM of PF-03084014, respectively, or 400 nM of ARQ197 or with the drug combination. Graphs represent the mean of three independent experiments ± SD, 2-way ANOVA test. $$$$ P-value ≤ 0.0001 for drug-treated vs vehicle-treated (DMSO) cells, and ****P-value ≤ 0.0001 for drug combination-treated cells vs single agents. (B) Representative images of Calcein AM (green: alive cells) and Propidium Iodide (PI; red: dead cells) staining of RH30 and RD cells treated for 72h with either 20 μM and 10 μM PF-03084014, respectively, or 400 nM of ARQ197 (ARQ 400 nM) or with the drug combination. Scale bars = 50 μm. (C) Histograms represent quantitative analysis of Calcein AM (green: alive cells) and Propidium Iodide (PI; red: dead cells) positive cells for RH30 and RD treated as in (B). Graphs represent the mean of three independent experiments ± SD, 2-way ANOVA test. $ P-value ≤ 0.05, $$ P-value ≤ 0.01, $$$$ P-value ≤ 0.0001 for drug-treated cells vs vehicle-treated (DMSO) cells, and *P-value ≤ 0.05, **P-value ≤ 0.01, ***P-value ≤ 0.001, ****P-value ≤ 0.0001 for drug combination-treated cells vs single agents.
Figure 5
Figure 5
NOTCH and MET signaling co-inhibition induces caspase-dependent apoptosis. (A) Histograms depict Caspase-3/7 activity in RH30 and RD cells treated for 24h with either PF-03084014 (20 μM and 10 μM, respectively) or ARQ197 (400 nM) or with the drug combination. Graphs represent the mean of three independent experiments ± SD, 2-way ANOVA test. $ P-value ≤ 0.05, $$ P-value ≤ 0.01, $$$$ P-value ≤ 0.0001 for drug-treated cells vs vehicle-treated (DMSO) cells, and *P-value ≤ 0.05, ****P-value ≤ 0.001 for drug combination-treated cells vs single agents. (B) Graphs represent the mean of three independent experiments ± SD of Annexin V/7-AAD staining of RD and RH30 cells treated as in (A). $ P-value ≤ 0.05, $$ P-value ≤ 0.01 drug-treated cells vs vehicle-treated (DMSO) cells, and *P-value ≤ 0.05, **P-value ≤ 0.01 for drug combination-treated cells vs single agents, 2-way ANOVA test. (C) Representative cytofluorimetric plots showing Annexin V/7-AAD staining of RH30 and RD cells treated as in (A). Dot plots depict the percentage of Annexin-V/7-AAD single- and double-positive cells. (D) Representative radiographs of RH30 and RD cells treated with either PF-03084014 (20 μM for 48h and 10 μM for 72h, respectively) or ARQ197 (400 nM) or with the drug combination. Radiographs show total and phosphorylated (pMETY1234/1235) MET protein levels. Migration of molecular weight markers is indicated on the right (kDa). GAPDH was used as loading control. (E) Representative radiographs of RH30 and RD cells treated with either PF-03084014 (20 μM for 48h and 10 μM for 72h, respectively) or ARQ197 (400 nM) or with the drug combination. Radiographs show PARP1 and p21Cip1 protein levels were also showed. Migration of molecular weight markers is indicated on the right (kDa). VINCULIN was used as loading control.
Figure 6
Figure 6
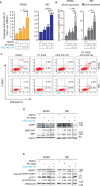
NOTCH and MET signaling co-inhibition affects MET expression and localization.0 (A) (left) Representative immunofluorescence images of pMETY1234/1235 (green) in RH30 and RD cells treated for 8h with either PF-03084014 (20 μM and 10 μM, respectively), or ARQ197 400 nM, or with the drug combination. DAPI (blue) was used for nuclear staining. (right) Histograms depicting % of pMET mean fluorescence intensity of RH30 and RD cells treated for 8h with either PF-03084014 (20 μM and 10 μM, respectively), or ARQ197 400 nM, or with the drug combination ± SD, 2-way ANOVA test. $$ P-value ≤ 0.01 drug-treated cells vs vehicle-treated (DMSO) cells, and **P-value ≤ 0.01, ****P-value ≤ 0.0001 for drug combination-treated cells vs single agents. (B) (left) Representative immunofluorescence images of total MET (green) in RH30 and RD cells treated as in (A) for 24h. DAPI (blue) was used for nuclear staining. 60X magnification; scale bar 50 μM. (right) Histograms depicting % of total MET mean fluorescence intensity of RH30 and RD cells treated for as in (A) ± SD, 2-way ANOVA test. $ P-value ≤ 0.05, $$$ P-value ≤ 0.001, $$$$ P-value ≤ 0.0001 drug-treated cells vs vehicle-treated (DMSO) cells, and ****P-value ≤ 0.001 for drug combination-treated cells vs single agents.
Figure 7
Figure 7
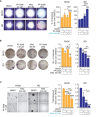
NOTCH and MET signaling co-inhibition reduces migration and tumorigenicity in vitro. (A) (left) Representative images of a migration assay of RH30 and RD cells treated for 24h with either PF-03084014 (20 μM and 10 μM, respectively) or ARQ197 400 nM or with the drug combination. (right) Histograms depict the percentage of the opening area in RH30 and RD cells. Graphs represent the mean of three independent experiments ± SD, 2-way ANOVA test. $ P-value ≤ 0.05, $$ P-value ≤ 0.01, $$$ P-value ≤ 0.001, $$$$ P-value ≤ 0.0001 for drug-treated cells vs vehicle-treated (DMSO) cells, and *P-value ≤ 0.05, **P-value ≤ 0.01, ****P-value ≤ 0.0001 for drug combination-treated vs single agent-treated cells. (B) (left) Representative images of a colony formation assay of RH30 and RD cells treated with either PF-03084014 1.25 μM or ARQ197 100 nM or with the drug combination. (right) Histogram of quantitation values of colony forming units. Graphs represent the mean of three independent experiments ± SD, 2-way ANOVA test. $$ P-value ≤ 0.01, $$$ P-value ≤ 0.001, $$$$ P-value ≤ 0.0001 for drug-treated cells vs vehicle-treated (DMSO) cells, and *P-value ≤ 0.05, **P-value ≤ 0.01, ***P-value ≤ 0.001 for drug combination-treated cells vs single agents. (C) (left) Representative images of a soft agar colony formation assay of RH30 and RD cells treated with either PF-03084014 (20 μM and 10 μM, respectively) or ARQ197 400 nM or with the drug combination. (right) Histograms of colony numbers/wells quantitation. Graphs represent the mean of three independent experiments ± SD, 2-way ANOVA test. $ P-value ≤ 0.05, $$$ P-value ≤ 0.001, $$$$ P-value ≤ 0.0001 for drug-treated cells vs vehicle-treated (DMSO) cells, and *P-value ≤ 0.05, **P-value ≤ 0.01, ***P-value ≤ 0.001 for drug combination-treated cells vs single agents.
Figure 8
Figure 8
NOTCH and MET signaling co-inhibition induces growth arrest and cell death in RMS tumor spheroids. (A) (left) Representative images of RH30 tumor spheroids treated for 72h with PF-03084014 (20 μM) and ARQ197 (400 nM), alone or in combination. Scale bars = 500 μm. (right) Histogram of spheroids’ diameters quantification in RH30 cells. Graphs represent the mean of three independent experiments ± SD, 2-way ANOVA test. $$ P-value ≤ 0.01 for drug-treated cells vs vehicle-treated (DMSO) cells and **P-value ≤ 0.01 for drug combination-treated cells vs single agents. (B) (left) Representative images of RD tumor spheroids treated for 72h with PF-03084014 (10 μM) and ARQ197 (400 nM), alone or in combination. Scale bars = 500 μm. (right) Histogram of spheroids’ diameters quantification in RD cells. Graphs represent the mean of three independent experiments ± SD, 2-way ANOVA test. $ P-value ≤ 0.05, $$$ P-value ≤ 0.001 for drug-treated cells vs vehicle-treated (DMSO) cells, and ***P-value ≤ 0.001 for drug combination-treated cells vs single agents.

References

    1. Skapek SX, Ferrari A, Gupta AA, Lupo PJ, Butler E, Shipley J, et al. . Rhabdomyosarcoma. Nat Rev Dis Prim (2019) 5:1. doi: 10.1038/s41572-018-0051-2 - DOI - PMC - PubMed
    1. Xia SJ, Pressey JG, Barr FG. Molecular Pathogenesis of Rhabdomyosarcoma. Cancer Biol Ther (2002) 1:97–104. doi: 10.4161/cbt.51 - DOI - PubMed
    1. Williamson D, Missiaglia E, De Reyniès A, Pierron G, Thuille B, Palenzuela G, et al. . Fusion Gene-Negative Alveolar Rhabdomyosarcoma is Clinically and Molecularly Indistinguishable From Embryonal Rhabdomyosarcoma. J Clin Oncol (2010) 28:2151–8. doi: 10.1200/JCO.2009.26.3814 - DOI - PubMed
    1. Shern JF, Chen L, Chmielecki J, Wei JS, Patidar R, Rosenberg M, et al. . Comprehensive Genomic Analysis of Rhabdomyosarcoma Reveals a Landscape of Alterations Affecting a Common Genetic Axis in Fusion-Positive and Fusion-Negative Tumors. Cancer Discov (2014) 4:216–31. doi: 10.1158/2159-8290.CD-13-0639 - DOI - PMC - PubMed
    1. Shern JF, Selfe J, Izquierdo E, Patidar R, Chou H-C, Song YK, et al. . Genomic Classification and Clinical Outcome in Rhabdomyosarcoma: A Report From an International Consortium. J Clin Oncol (2021) 39:2859–71. doi: 10.1200/JCO.20.03060 - DOI - PMC - PubMed