. 2022 Apr 27:13:884690.
doi: 10.3389/fphys.2022.884690. eCollection 2022.

Erysense, a Lab-on-a-Chip-Based Point-of-Care Device to Evaluate Red Blood Cell Flow Properties With Multiple Clinical Applications

Affiliations

Erysense, a Lab-on-a-Chip-Based Point-of-Care Device to Evaluate Red Blood Cell Flow Properties With Multiple Clinical Applications

Steffen M Recktenwald et al. Front Physiol. .

Abstract

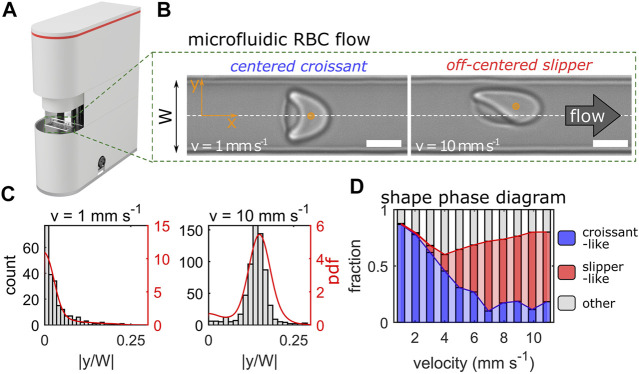
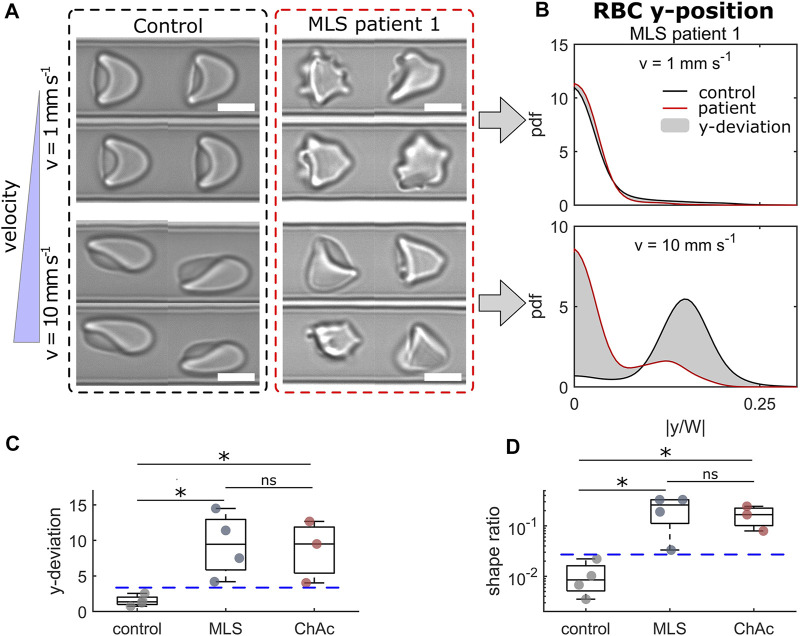
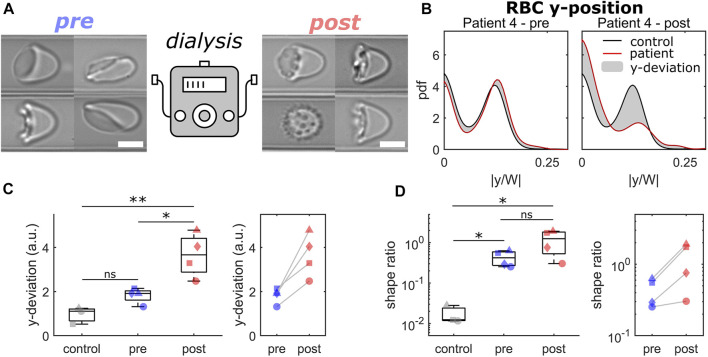
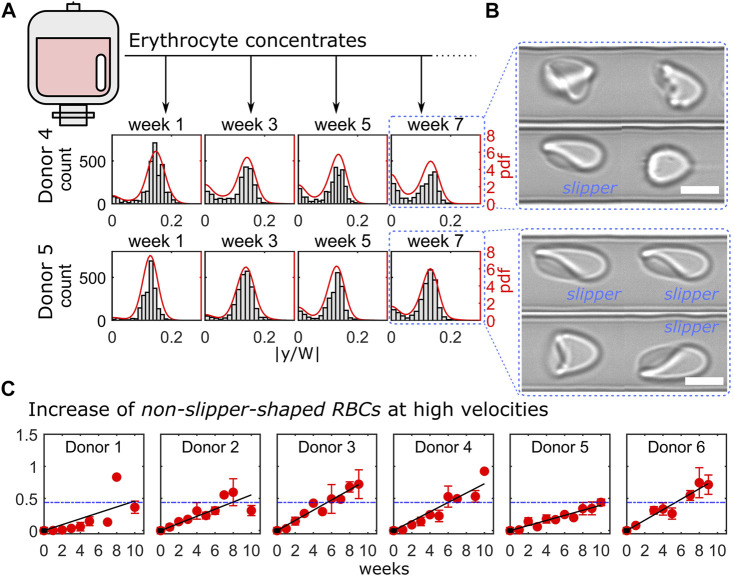
In many medical disciplines, red blood cells are discovered to be biomarkers since they "experience" various conditions in basically all organs of the body. Classical examples are diabetes and hypercholesterolemia. However, recently the red blood cell distribution width (RDW), is often referred to, as an unspecific parameter/marker (e.g., for cardiac events or in oncological studies). The measurement of RDW requires venous blood samples to perform the complete blood cell count (CBC). Here, we introduce Erysense, a lab-on-a-chip-based point-of-care device, to evaluate red blood cell flow properties. The capillary chip technology in combination with algorithms based on artificial neural networks allows the detection of very subtle changes in the red blood cell morphology. This flow-based method closely resembles in vivo conditions and blood sample volumes in the sub-microliter range are sufficient. We provide clinical examples for potential applications of Erysense as a diagnostic tool [here: neuroacanthocytosis syndromes (NAS)] and as cellular quality control for red blood cells [here: hemodiafiltration (HDF) and erythrocyte concentrate (EC) storage]. Due to the wide range of the applicable flow velocities (0.1-10 mm/s) different mechanical properties of the red blood cells can be addressed with Erysense providing the opportunity for differential diagnosis/judgments. Due to these versatile properties, we anticipate the value of Erysense for further diagnostic, prognostic, and theragnostic applications including but not limited to diabetes, iron deficiency, COVID-19, rheumatism, various red blood cell disorders and anemia, as well as inflammation-based diseases including sepsis.

Keywords: artificial capillary; erythrocyte; hemodiafiltration; microfluidics; neuroacanthocytosis syndrome; phase diagram; red cell storage; shape classification.


Conflict of interest statement

SQ is the CEO of and ML is employed by the start-up Cysmic GmbH. SMR, GS, and LK are shareholders of Cysmic GmbH. Erysense is a product of the Cysmic GmbH. The remaining authors declare that the research was conducted in the absence of any commercial or financial relationships that could be construed as a potential conflict of interest.

Figures

FIGURE 1
FIGURE 1
Erysense® device and principle of measurement. (A) Image of the Erysense® device. (B) Representative images of a croissant-shaped and a slipper-shaped RBC at low (1 mm/s) and high (10 mm/s) velocity, respectively. Scale bars represent 5 µm. Flow is from left to right and the dashed white line indicates the channel centerline in the y-direction with a channel width W. (C) Representative histograms and probability density functions (pdf) of the normalized cell’s center-of-mass in y-direction at a low (1 mm/s) and high (10 mm/s) velocity. (D) Representative shape phase diagram of a healthy control showing croissant-like, slipper-like, and other RBC shapes as a function of the cell velocity.
FIGURE 2
FIGURE 2
Results of RBCs from neuroacanthocytosis syndrome (NAS) patients. (A) Representative RBC shapes for a healthy control (left) and an MLS patient (right) at low (top) and high velocity (bottom). Scale bars represent 5 µm. (B) Probability density functions (pdfs) of the cell’s y-position distribution for the control and an MLS patient at the velocities shown in (A). The gray area indicates the difference between both distributions. (C) Deviation between the y-position distributions based on the average distribution for healthy controls in the entire velocity range of 1–10 mm/s. (D) Shape ratio between non-normal RBCs (acanthocytes and other pathological shapes) and normocytes. * refers to a significance level of p < 0.05 and ns stands for not significant. Blue dashed horizontal lines represent thresholds between controls and NAS patients. The analysis presented was performed on an average of 4519 cells per patient/donor (between 2422 and 5484 cells).
FIGURE 3
FIGURE 3
Comparison of RBCs from patients before and after dialysis by hemodiafiltration. (A) Representative RBC shapes pre (left) and post (right) hemodiafiltration. Scale bars represent 5 µm. (B) Probability density functions (pdfs) of the normalized cell’s center-of-mass position at v = 5 mm/s. Black and red lines represent the pdfs for a healthy control and for patient 4 pre (left) and (post) hemodiafiltration. The gray area indicates the difference between both pdfs. (C) Deviation between the y-position distributions based on the average distribution for healthy controls for a velocity range of 1–10 mm/s. (D) Shape ratio between pathological and healthy RBC shapes in the velocity range of 1–3 mm/s. Data shown with the same symbols in (C) and (D) correspond to the same patient pre and post hemodiafiltration. * refers to a significance level of p < 0.05, ** to p < 0.01, and ns stands for not significant. The analysis presented was performed on an average of 4006 cells per patient/donor (between 2895 and 5496 cells).
FIGURE 4
FIGURE 4
Cell shape characterization within 10 weeks of erythrocyte concentrate storage. (A) Representative histograms and probability density functions (pdfs) of the RBC y-positions for donor 4 (top) and donor 5 (bottom) at a velocity of 10 mm/s for four consecutive weeks. (B) Representative RBC shapes for both donors at week 7. Scale bars represent 5 µm. (C) Ratio between centered cell shapes and slipper-shaped RBCs for all donors as a function of time. Red symbols correspond to measurements’ average over a velocity range of 8–10 mm/s and black lines represent linear fits. Blue dashed horizontal lines indicate the mean value of the linear fits for all donors at week 6. The analysis presented was performed on in average 4847 cells per donor and time point (between 2213 and 9958 cells).

References

    1. Alapan Y., Kim C., Adhikari A., Gray K. E., Gurkan-Cavusoglu E., Little J. A., et al. (2016). Sickle Cell Disease Biochip: a Functional Red Blood Cell Adhesion Assay for Monitoring Sickle Cell Disease. Translational Res. 173, 74–91. e8. 10.1016/j.trsl.2016.03.008 - DOI - PMC - PubMed
    1. Barshtein G., Arbell D., Livshits L., Gural A. (2018). Is it Possible to Reverse the Storage-Induced Lesion of Red Blood Cells? Front. Physiol. 9, 914. 10.3389/fphys.2018.00914 - DOI - PMC - PubMed
    1. Barshtein G., Manny N., Yedgar S. (2011). Circulatory Risk in the Transfusion of Red Blood Cells with Impaired Flow Properties Induced by Storage. Transfus. Med. Rev. 25, 24–35. 10.1016/j.tmrv.2010.08.004 - DOI - PubMed
    1. Barshtein G., Pries A. R., Goldschmidt N., Zukerman A., Orbach A., Zelig O., et al. (2016). Deformability of Transfused Red Blood Cells Is a Potent Determinant of Transfusion-Induced Change in Recipient's Blood Flow. Microcirculation 23, 479–486. 10.1111/micc.12296 - DOI - PubMed
    1. Bateman R., Sharpe M., Singer M., Ellis C. (2017). The Effect of Sepsis on the Erythrocyte. Ijms 18, 1932. 10.3390/ijms18091932 - DOI - PMC - PubMed