. 2022 May;13(5):12127-12140.
doi: 10.1080/21655979.2022.2073126.

Noise exposure and its relationship with postinfarction cardiac remodeling: implications for NLRP3 inflammasome activation

Affiliations

Noise exposure and its relationship with postinfarction cardiac remodeling: implications for NLRP3 inflammasome activation

Yanzhao Wei et al. Bioengineered. 2022 May.

Abstract

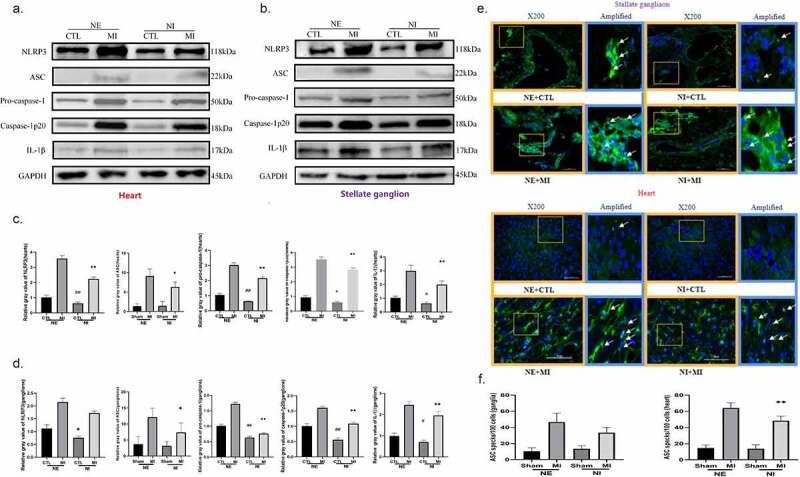
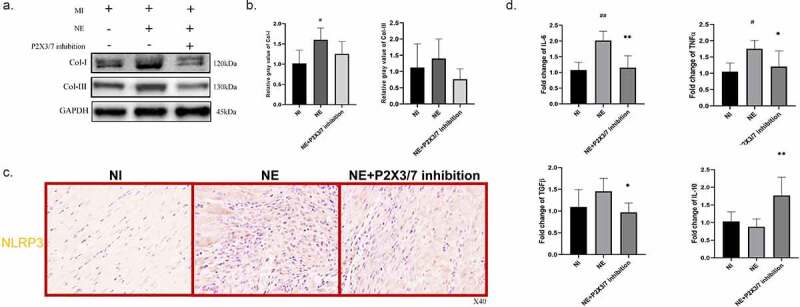
In recent years, high-decibel noise has emerged as a causative risk factor for ischemic heart disease. Massive noise overdose is associated with increased endocrine, neural, and immune stress responses. The NLRP3 (nucleotide-binding oligomerization domain, leucine-rich repeat, and pyrin domain containing 3) inflammasome, the most characterized supramolecular complex and a potent mediator of inflammatory signaling, has been reported to be a marker of increased ischemic heart disease vulnerability. Our study evaluated the association of noise exposure with postinfarction cardiac remodeling and its effect on NLRP3 inflammasome activation. Rats were exposed to a noisy environment (14 days, 24 h/per day, 70 ± 5 dB), and speck formation by the NLRP3 inflammasome scaffold protein ASC (apoptosis-associated speck-like protein) was assessed by confocal immunofluorescence. Echocardiography, pathological analysis, and in vivo electrophysiology were performed. Our results revealed the improved postinfarction cardiac function, mitigated fibrosis, and decreased arrhythmia vulnerability and sympathetic sprouting in low-environment noise groups. Moreover, western blotting of NLRP3, caspase-1, ASC, IL-1β, and IL-18 and confocal microscopy of ASC speck showed that the priming and activation of NLRP3 inflammasome were higher in the NE group than in the NI group. In conclusion, our findings reveal a previously unidentified association between NLRP3 inflammasome activation and noise exposure, underscoring the significance of effective noise prevention in improving postinfarction prognosis.

Keywords: Myocardial infarction; NLRP3 inflammasome; inflammation; noise exposure; purinergic signaling.


Conflict of interest statement

All authors disclosed no relevant relationships.

Figures

None
Graphical abstract
Figure 1.
Figure 1.
Effects of noise on cardiac function and cardiac fibrosis (n = 6 –8 in each group). The data are presented as the mean ±SEM. (a) Representative echocardiographic images. (b) Quantitative analysis of LVEF (%), LVFS (%), LVIDd (mm) and LVIDs (mm). (c) HE staining, Masson’s staining and Sirius red staining were used to evaluate cardiac injury and cardiac fibrosis. (d) Representative images of immunofluorescence staining for the myofibroblast activation biomarker αSMA. *p < 0.05 vs. the MI+NE group.
Figure 2.
Figure 2.
Effects of noise on VA vulnerability (n = 10 in each group). The data are presented as the mean ±SEM. (a) Representative images of ordinary ECGs and programmed electric bursts for each group captured with Labchart 8.0 software. (b) Quantification of ECG baseline parameters. QT interval, QTc (calculated QT interval based on Mitchell’s formula), PR interval, and QRS interval. (c) VA duration and the onset time to the first VA event after PES. 0s in the figure means there were no VA events after an electric burst. *p < 0.05 vs. the MI+NE group, #p < 0.05 vs. the CTL+NE group, **p < 0.01 vs. the MI+NE group, ##p < 0.01 vs. the CTL+NE group.
Figure 3.
Figure 3.
Effects of noise on postinfarction cardiac nervous remodeling (n = 6 –8). The data are presented as the mean ± SEM. (a) Quantification of the local and systemic concentrations of the sympathetic drive biomarker NE (pg/ml). (b) Immunofluorescence staining of the sympathetic nervous system biomarkers TH and GAP43. (c) Western blotting of the anti-remodeling neutrophin NGF and quantification. *p < 0.05 vs. the MI+NE group.
Figure 4.
Figure 4.
Effects of noise on postinfarction activation of purinergic signaling, cardiac apoptosis and pyroptosis (n = 6 –8). (a) Representative western blotting bands of pyroptosis protein gasdermin D. (b)Quantitative analysis of GSDMD precursor and cleaved form expression level. (c) The illustration of caspase-3 activity assay and its quantitative analysis of caspase-3 activity by optical density. (d) Representative images of TUNEL staining. (e) Representative western blotting bands of P2X3, P2X7, P2X4, P2X6. (f) Quantitative analysis of the percentage of TUNEL positive cells/100 cells. (g) Quantitative analysis of P2X3, P2X7, P2X4, P2X6 expression levels. *p < 0.05 vs. the MI+NE group, **p < 0.01 vs. the MI+NE group.
Figure 5.
Figure 5.
Effects of noise on postinfarction NLRP3 inflammasome activation in heart tissues and cardiac sympathetic ganglia, stellate ganglia (n = 5 –7). (a) Representative western blot bands of NLRP3, ASC, pro-caspase-1, caspase-1p20, and IL-1β in heart tissues. (b) Representative western blot bands of NLRP3, ASC, pro-caspase-1, caspase-1p20, and IL-1β in stellate ganglia. (c) Quantification of the expression levels of NLRP3, ASC, pro-caspase-1, caspase-1p20, and IL-1β in heart tissues. (d) Quantification of the expression levels of NLRP3, ASC, pro-caspase-1, caspase-1p20, and IL-1β in stellate ganglia. (e) Representative images of ASC speck formation; the arrows indicate ASC specks. (f) Quantitative analysis of the percentage of ASC speck positive cell/100 cells. *p < 0.05 vs. the MI+NE group, #p < 0.05 vs. the CTL+NE group, **p < 0.01 vs. the MI+NE group, ##p < 0.01 vs. the CTL+NE group.
Figure 6.
Figure 6.
Effects of P2X3/7 inhibition on postinfarction cardiac injuries (n = 5 –7). (a) Representative western blot bands of collagen and collagen III. (b) Quantification of the expression levels of col-I and col-III. (c) Immunohistochemistry staining of NLRP3 protein. (d) qPCR measurement of IL-6, TNFα, TGFβ and IL-10. *p < 0.05 vs. the MI+NE group, #p < 0.05 vs. The MI+NI group, **p < 0.01 vs. the MI+NE group, ##p < 0.01 vs. the MI+NI group.

Similar articles

Cited by

References

    1. Chiu CH, Lung SC, Chen N, et al. Effects of low-frequency noise from wind turbines on heart rate variability in healthy individuals. Sci Rep. 2021;11(1):17817. - PMC - PubMed
    1. Rompel S, Schneider A, Peters A, et al., On Behalf Of The Inger Study Group . Sex/Gender-Differences in the health effects of environmental noise exposure on hypertension and ischemic heart disease-A systematic review. Int J Environ Res Public Health. 2021;18(18):9856. - PMC - PubMed
    1. Seidler A, Wagner M, Schubert M, et al. Myocardial infarction risk due to aircraft, road, and rail traffic noise. Dtsch Arztebl Int. 2016;113(24):407–414. - PMC - PubMed
    1. Peterson EA, Augenstein JS, Tanis DC, et al. Noise raises blood pressure without impairing auditory sensitivity. Science. 1981;211(4489):1450–1452. - PubMed
    1. Alves-Pereira M, Castelo Branco NAA.. Vibroacoustic disease: biological effects of infrasound and low-frequency noise explained by mechanotransduction cellular signaling. Prog Biophys Mol Biol. 2007;93:256–279. - PubMed

MeSH terms

Substances

LinkOut - more resources