. 2022 May 16:11:e74322.
doi: 10.7554/eLife.74322.

Drosophila nicotinic acetylcholine receptor subunits and their native interactions with insecticidal peptide toxins

Affiliations

Drosophila nicotinic acetylcholine receptor subunits and their native interactions with insecticidal peptide toxins

Dagmara Korona et al. Elife. .

Abstract

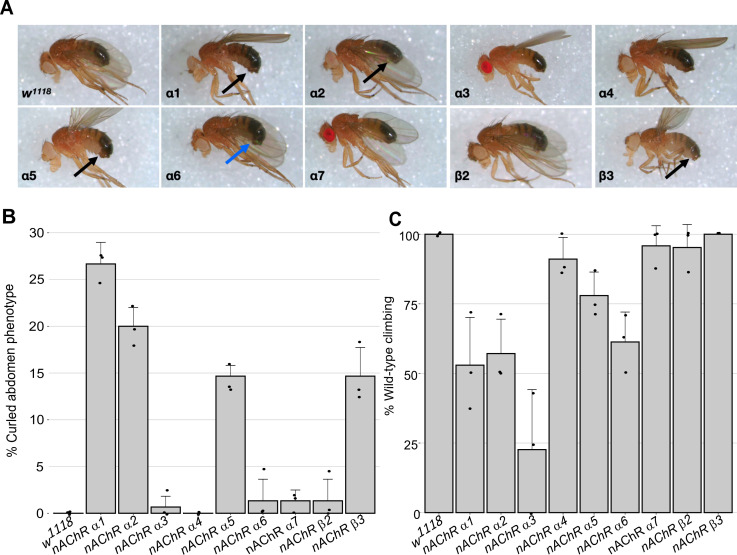
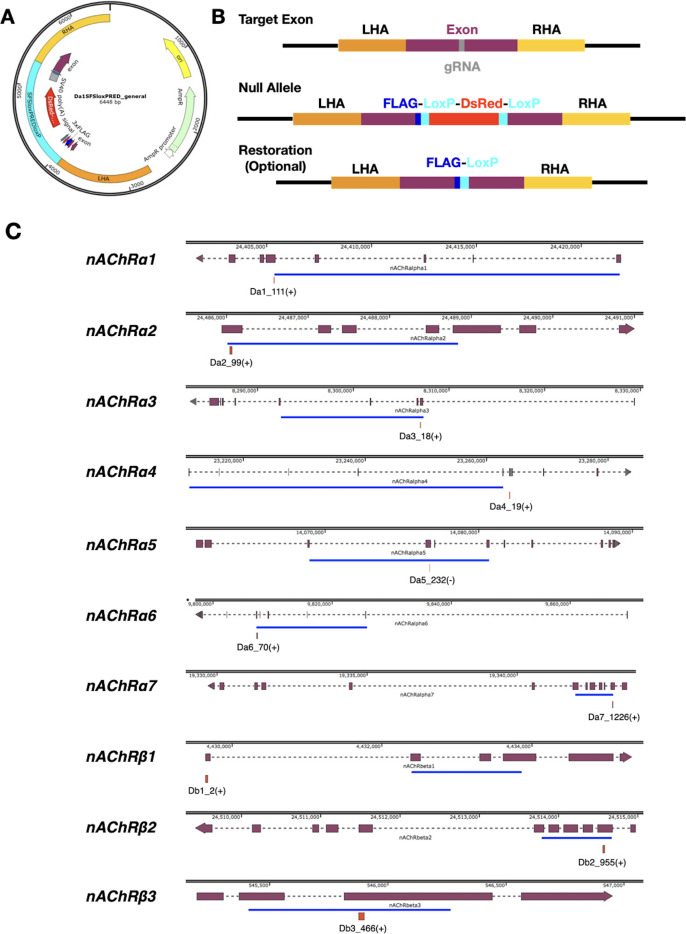
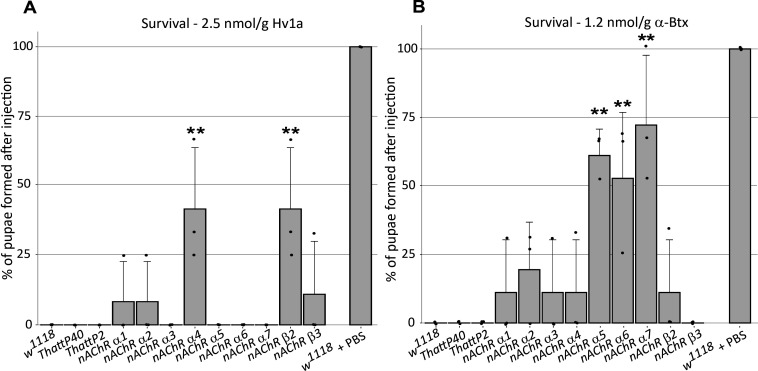
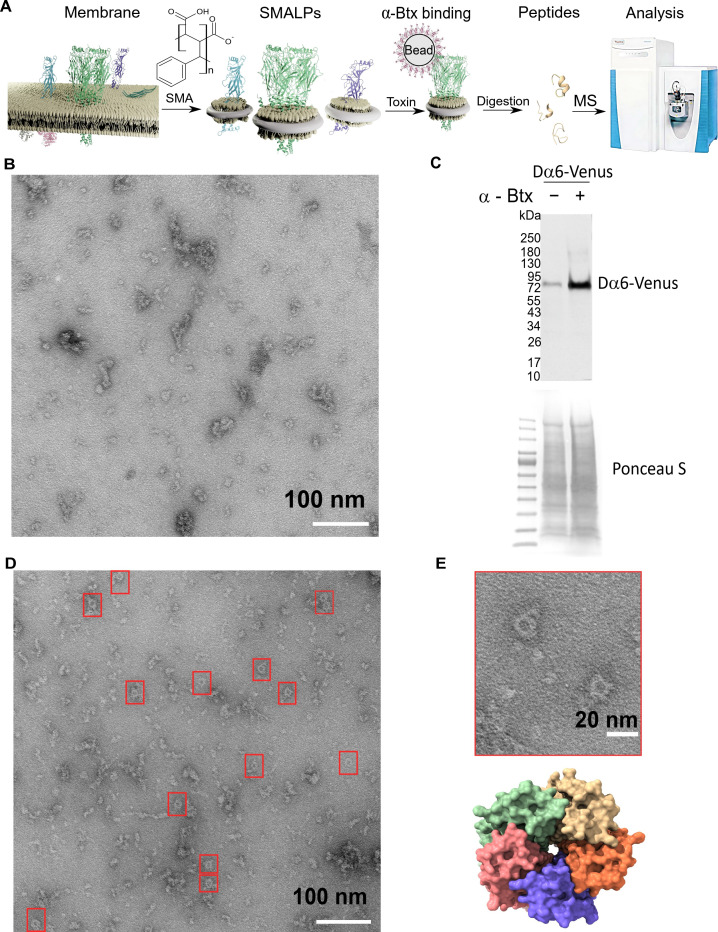
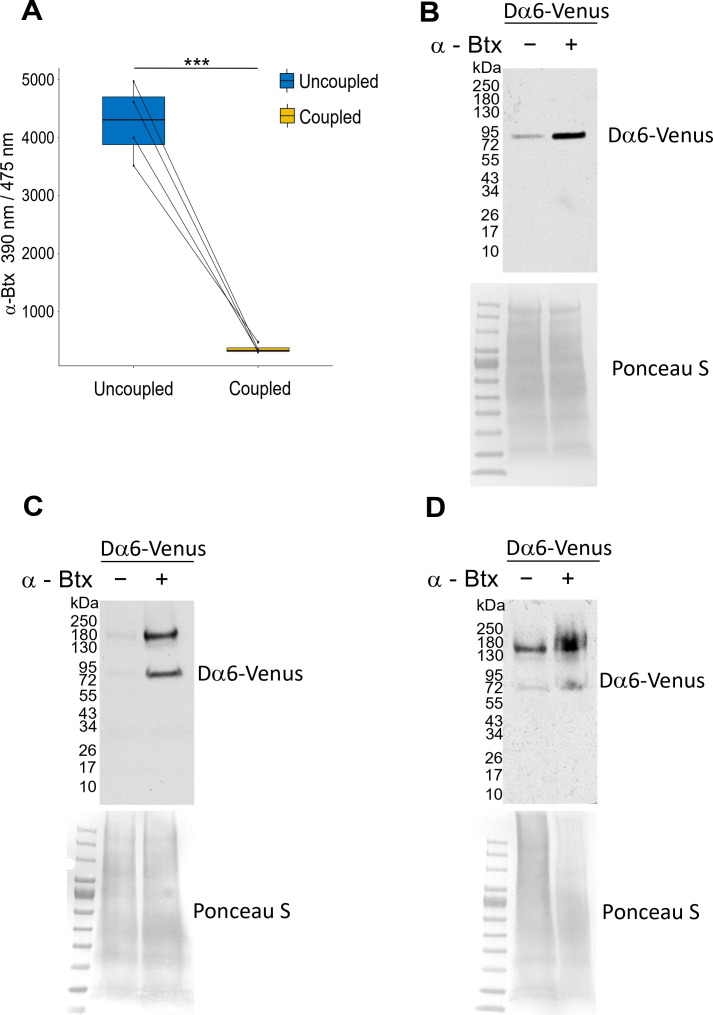
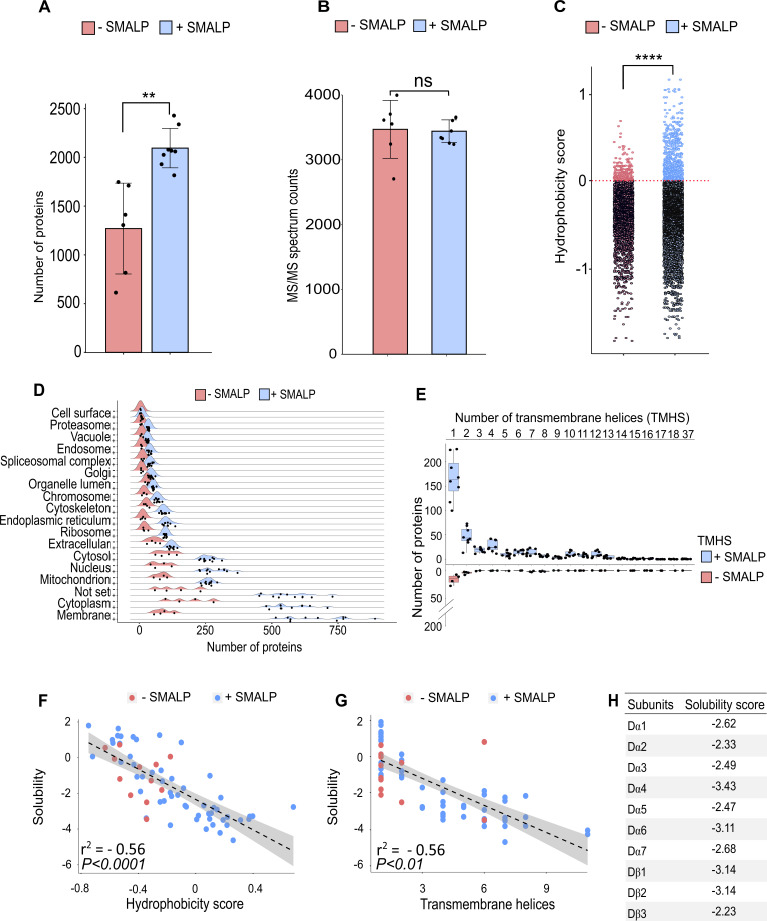
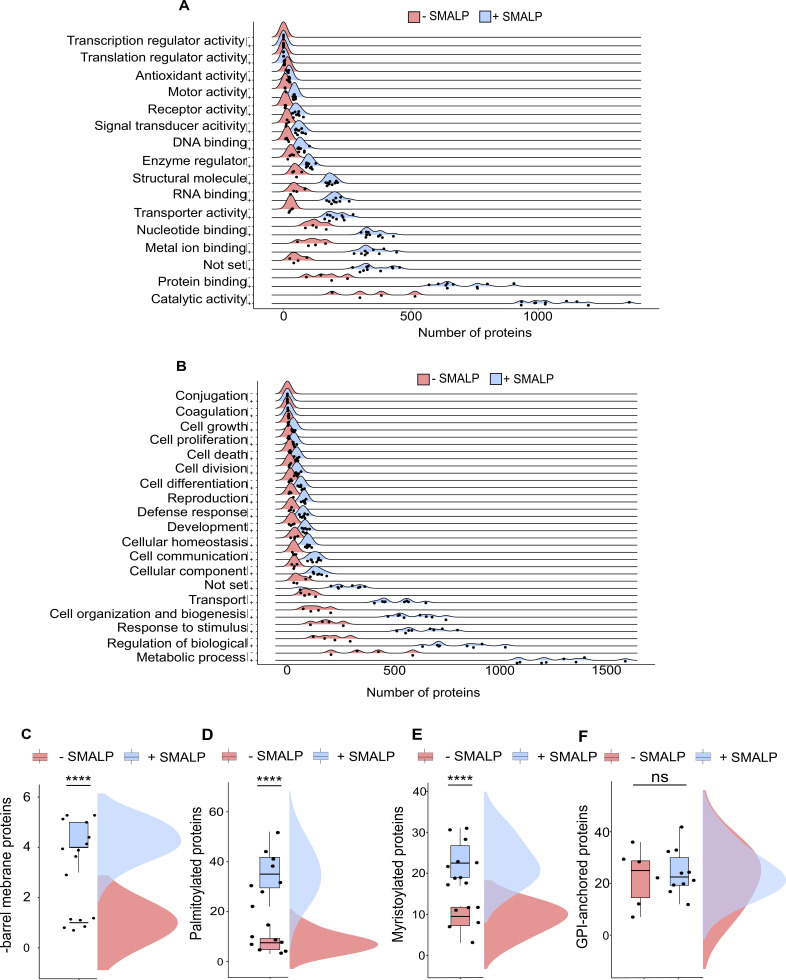
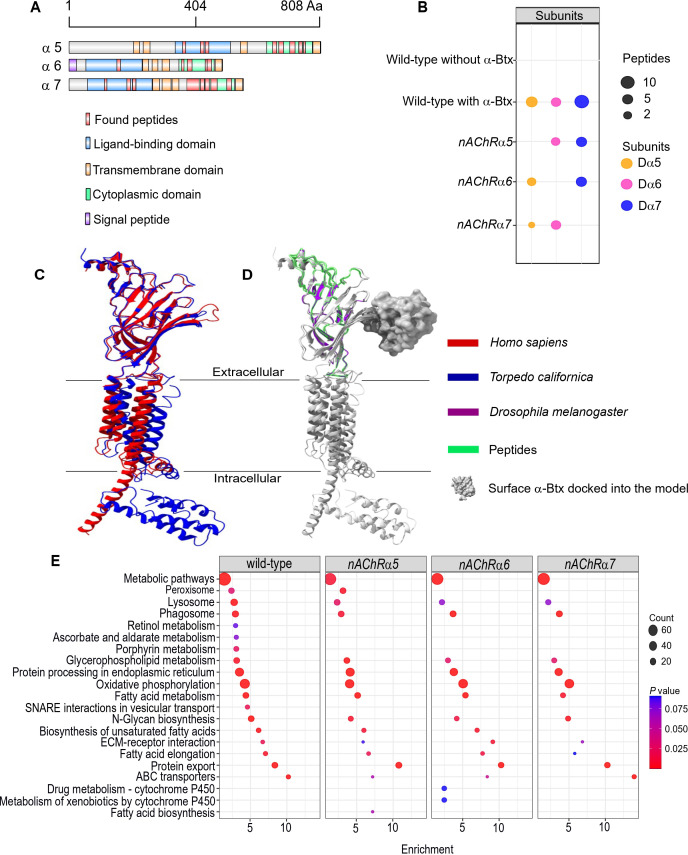
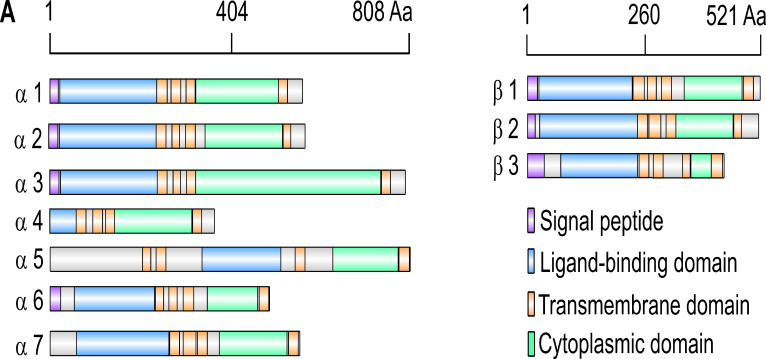
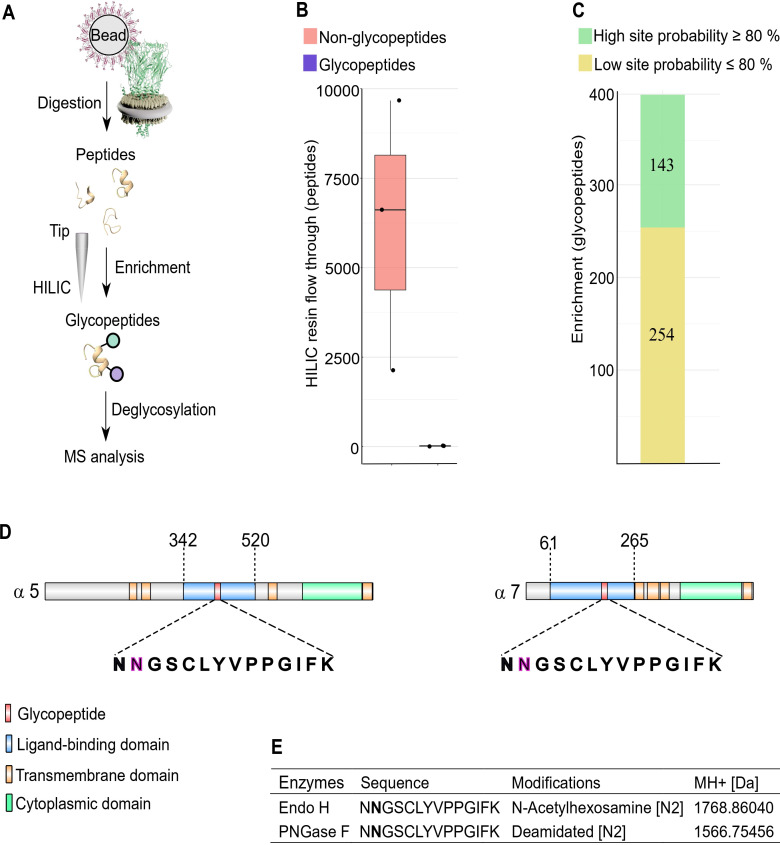
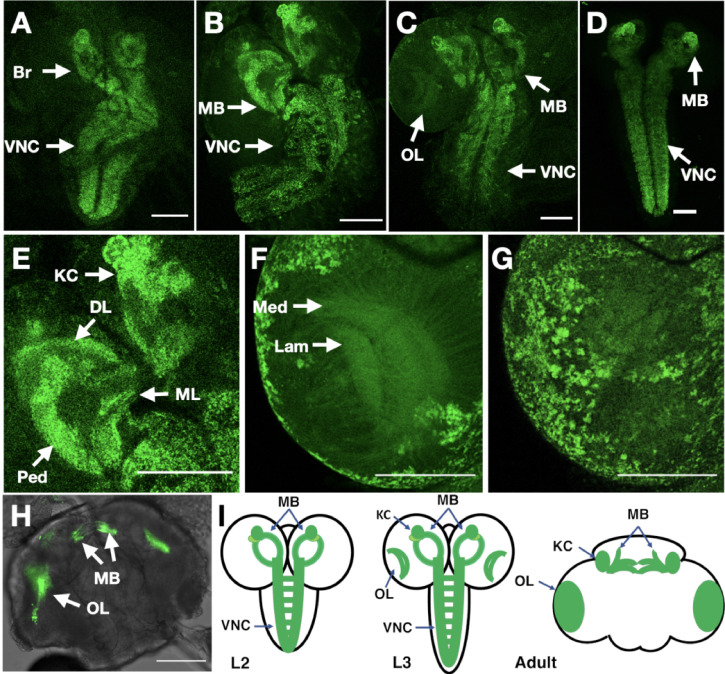
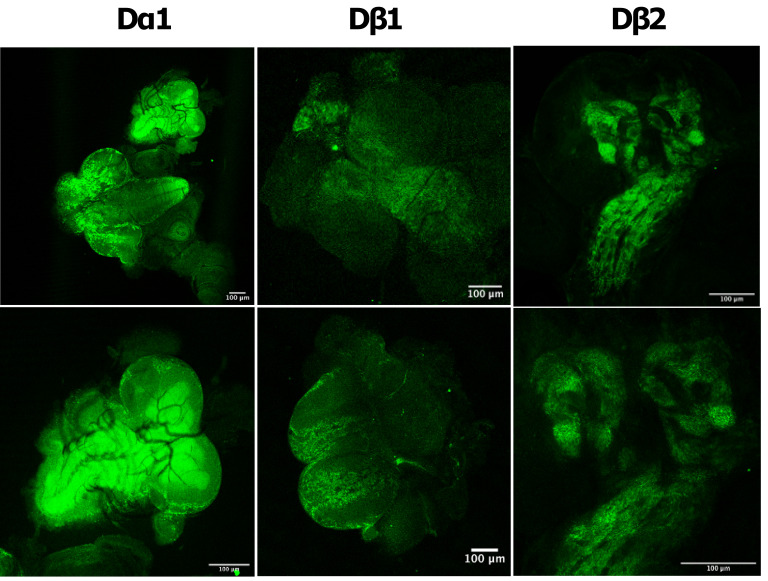
Drosophila nicotinic acetylcholine receptors (nAChRs) are ligand-gated ion channels that represent a target for insecticides. Peptide neurotoxins are known to block nAChRs by binding to their target subunits, however, a better understanding of this mechanism is needed for effective insecticide design. To facilitate the analysis of nAChRs we used a CRISPR/Cas9 strategy to generate null alleles for all ten nAChR subunit genes in a common genetic background. We studied interactions of nAChR subunits with peptide neurotoxins by larval injections and styrene maleic acid lipid particles (SMALPs) pull-down assays. For the null alleles, we determined the effects of α-Bungarotoxin (α-Btx) and ω-Hexatoxin-Hv1a (Hv1a) administration, identifying potential receptor subunits implicated in the binding of these toxins. We employed pull-down assays to confirm α-Btx interactions with the Drosophila α5 (Dα5), Dα6, Dα7 subunits. Finally, we report the localisation of fluorescent tagged endogenous Dα6 during Drosophila CNS development. Taken together, this study elucidates native Drosophila nAChR subunit interactions with insecticidal peptide toxins and provides a resource for the in vivo analysis of insect nAChRs.

Keywords: D. melanogaster; Drosophila; Drosophila nAChRs; insecticidal toxins; neuroscience; neurotoxin interactions.


Conflict of interest statement

DK, CG, RQ, RP, KM, DM, MD, GJ, FE, SR, KL No competing interests declared, BD, LF is affiliated with Syngenta. The author has no other competing interests to declare

Figures

Figure 1.
Figure 1.. Morphological and locomotor phenotypes in nAChR subunit mutants.
(A) Adult males from indicated nAChR subunit null mutants, black arrows indicate curled abdomens but even in lines with a low frequency the phenotype is prominent (blue arrow). (B) Frequency of curled abdomen phenotype (%), n=3. (C) Graph of locomotor activity determined in climbing assays as a percentage of wild-type, n=3.
Figure 1—figure supplement 1.
Figure 1—figure supplement 1.. Construction of new D. melanogaster nicotinic acetylcholine receptor subunit gene mutations.
(A) Diagram of the construct used to generate DsRED insertions into each of the nAChR subunit genes. LHA and RHA = Left and Right homology arms. (B) A guide RNA target site is identified in the exon of interest. Insertion by homology directed repair after Cas9 cleavage disrupts the exon by insertion of a 3XFLAG-DsRED cassette. If required, the DsRED may be removed by Cre-LoxP recombination, restoring the reading frame with the addition of a 3XFLAG tag. (C) Diagramatic representation of DsRED insertion sites in each of the subunit genes with the gRNA specified in Supplementary file 6. Purple blocks represent coding exons on longest transcript, dotted lines represent introns. Genomic coordinates are above each gene model. The blue line represents the approximate extend of the ligand-binding domains.
Figure 2.
Figure 2.. ω-Hexatoxin-Hv1a and α-Bungarotoxin target different nAChR subunits.
(A) Bar graph of the survival rate, measured as the percentage of pupae formed, following larval injection of 2.5 nmol/g Hv1a in the indicated homozygous lines. **p=0.0035 (one-way ANOVA F(11,24) = 4.99, p=0.0005 with Bonferroni’s multiple comparisons test). Mean ± SD of three independent replicates in each group (10 injected larvae in total). Individual replicate data points are shown (B) Survival rate following larval injection of 1.25 nmol/g α-Btx. **p<0.001, ***p=0.0001, one-way ANOVA (F(11,24) = 7.921, p<0.0001, followed by Bonferroni’s multiple comparisons test). Mean ± SD of three independent replicates in each group (10 injected larvae in total). w1118 is the wild-type base stock, THattp40 and THattP2 are the Cas9 lines used to establish the mutants, w1118 + PBS represents the injection control.
Figure 3.
Figure 3.. Forming styrene maleic acid lipid particles (SMALPs).
(A) Schematic representation of the SMALPs extraction and nAChRs pull-down for mass spectrometric analysis. (B) Negative staining of extracted SMALPs by transmission electron microscopy, n=3. Scale bar 100 nm. (C) Western blot for Dα6-mVenus nAChR with and without enrichment using α-Btx, n=2. Detected with anti-GFP antibody. The fusion protein was detected at approximately 83 kDa. Ponceau S staining was used as sample equal loading control. (D, E) Negative staining of extracted SMALPs after α-Btx pull-downs, n=3, ring-like protein structures are boxed (scale bar = 100 nm) with an example in the magnified image (scale bar = 20 nm). A top view of the nAChR structure from PDB entry 4HQP is shown for reference.
Figure 3—figure supplement 1.
Figure 3—figure supplement 1.. Coupling α-Btx and testing pull-down efficiency with affinity beads.
(A) Fluorescence signal of uncoupled α-Btx in solution before and after coupling to affinity beads (two-tailed t-test, ***p<0.001, n=4). (B) Biological replicate: same condition as in Figure 3C, samples were reduced with 1% DTT. To allow the detection of the fusion protein Dα6-mVenus an anti-GFP (Ab252881) antibody was used. The fusion protein was detected at approximatly 83 kDa. (C) Pull-down samples were not reduced with 1% DTT. A signal at about 180 kDa was also detected and mostly indicative of a dimer. (D) Biological replicate: same condition as in (C), samples were not reduced with 1% DTT. Ponceau S staining was used as sample an equal loading control.
Figure 4.
Figure 4.. Identification of proteins enriched by SMALP extraction.
(A) Number of identified proteins in affinity pull-down samples solubilised with or without SMA, two-tailed t-test, **p<0.01, n=6 or 8 replicates per condition. (B) MS/MS spectrum counts from samples solubilised with or without SMA, ns = not significant after two-tailed t-test with n=6 or 8. (C) Calculated hydrophobicity score of amino acid residues found in protein sequences obtained with and without SMA solubilisation, ****p<0.0001, two-tailed t-test, n=3 per condition. (D) GO term (cellular compartment) enrichment of proteins identified with and without SMA solubilisation, n=4 or 11. (E) Predicted numbers of proteins containing transmembrane helices obtained with or without SMA solubilisation, n=4 or 8. (F, G) Analysis of solubility and hydrophobicity of receptors identified with and without SMA solubilisation (r2 = –0.56, p<0.0001, n=4) and of transmembrane receptor helices (r2=0.56, p < 0.01, n = 4). (H) Solubility score of individual nAChR subunits.
Figure 4—figure supplement 1.
Figure 4—figure supplement 1.. GO terms and predicted membrane proteins.
(A) GO slim term for biological process and (B) for molecular function analysed within samples solubilised without or with SMA, n=4 or 11 per conditions. Predicted β-barrel membrane- (C), two-tailed t-test ****p<0.0001, n=6 or 10; palmitoylated- (D), ****p<0.0001, each n=8; myristoylated- (E), ****p<0.0001, n=6 or 10; and GPI-anchored proteins (F), non-significant ns, n=6 or 10.
Figure 5.
Figure 5.. Three nAChR α-subunits bind to α-Bungarotoxin (α-Btx).
(A) Identified Dα5, Dα6, and Dα7 subunit peptides in pull-downs using α-Btx affinity beads. Peptides from the ligand-binding and cytoplasmic domain are highlighted in red. (B) Numbers of identified unique peptides in wild-type pull-downs using affinity beads in absence and presence of α-Btx, n=3. Deleting nAChRα5, nAChRα6, nAChRα7 and performing pull-downs identified unique peptides for nAChR subunits suggesting that functional complexes can be formed in each of the mutants, n=3. (C) Superimposed nAChR α-subunit structures from Homo sapiens (blue, PDB 6USF) and Torpedo californica (red, 6UWZ). The extracellular ligand-binding domains (LBD) exhibit a structure similarity. (D) Same superimposed structures docked to α-bungarotoxin (α-Btx, surface structure). Peptides found in LBD are highlighted in green. The homology regions of the Dα6 LBD are shown in violet.(E) KEGG pathway enrichment analysis of pull-downs in wild-type and nAChRα5, nAChRα6, nAChRα7 mutants, Fisher’s exact test, n=3. Protein counts with p values of enriched pathways are shown. p values of ≤ 0.05 are to be considered as strongly enriched with default threshold of 0.1.
Figure 5—figure supplement 1.
Figure 5—figure supplement 1.. Illustration of nAChR subunits.
(A) Graphical representation of ten nAChR subunits. The position of protein domains and signal peptides are shown.
Figure 5—figure supplement 2.
Figure 5—figure supplement 2.. Identified peptides in ligand-binding and cytoplasmic domain.
(A) Shared peptides found in the ligand-binding domains are shown in red. (B) Identified unique (/) and shared (,) peptides in cytoplasmic domain.
Figure 6.
Figure 6.. N-glycosylation sites in nAChR subunits.
(A) Diagrammatic representation of nAChR subunit glycopeptide enrichment. Pull-downs with α-Btx affinity beads enrich for nAChRs and after tryptic digestion glycopeptides were enriched. Glycopeptides were deglycosylated with Endo H or PNGase F and analyzed by mass spectrometry. (B) Low numbers of glycopeptides (average 20) are detected in HILIC resin flow through fractions. (C) Numbers of identified glycopeptides according to site probabilities are shown (n=3). (D) Shared glycopeptide identified in the ligand-binding domain of Dα5 and Dα7, an N-linked glycosylated asparagine (N) residue is highlighted. (E) Deglycosylated peptide with either Endo H or PNGase F and contains either an N-acetylhexosamine or is deamidated on asparagine (N2). The two different modifications on the same peptide lead to a different monoisotopic mass (MH+ [Da]). Peptide contains an additional carbamidomethyl on cysteine (C5).
Figure 6—figure supplement 1.
Figure 6—figure supplement 1.. MS/MS spectra of Da5 and Da7 subunit peptides.
(A) MS/MS spectra of fragmented shared Dα5 and Dα7 subunit peptides. Glycopeptides were deglycosylated with Endo H and the second asparagine (N) residue is modified with an N-acetylhexosamine, HexNAc (H). (B) Same deglycosylated peptide with PNGase F and deamination (D) of asparagine residue is shown.
Figure 6—figure supplement 2.
Figure 6—figure supplement 2.. Glycosylation sites of nAChR subunits.
(A) Multiple sequence alignment of insect α7 nAChR subunits compared to sequences of nematodes. The glycosylated ligand-binding domain (LBD) sequence of Dα5 and Dα7 nAChR subunits are shown. Glycosylated asparagine residues highlighted in red are conserved within insects and nematodes (Dα5 422 and Dα7 170 amino acids). (B) Same Dα5 and Dα7 nAChR subunit sequences compared to T.californica, D.rerio, M. musculus, and H. sapiens. (C) Graphical representation of Dα3 and Dβ3 nAChR subunits. N-acetylhexosamine (H) modification on asparagine residues are highlighted and are of low site probability ≤ 80%.
Figure 7.
Figure 7.. In vivo imaging of endogenously tagged Dα6 nAChR subunit.
(A–C) Dα6-YFP localisation from live confocal imaging in 2nd A, early B and late C 3rd instar larval brains. Visible localisation in brain (Br), ventral nerve cord (VNC), mushroom bodies (MB), and optic lobes (OL). Scale bar = 100 µm. (D) Imaging Dα6-YFP localisation in fixed late 3rd instar larval brain. (E) Dα6-YFP in mushroom bodies of 3rd instar larvae with detectable fluorescence signal in Kenyon cells (KC), calyx (CX), peduncle (Ped), dorsal lobes (DL), and medial lobes (ML). Scale bar = 100 µm. (F) Dα6-YFP was observed in developing optic lobes, lamina (Lam) and medulla (Med) of later 3rd instar larvae. Scale bar = 100 µm. (G) Dα6-YFP on external structures of developing lobes in later 3rd instar larvae. Scale bar = 100 µm. (H) Dα6-YFP in the adult fly brain, strong signal is detected in mushroom bodies (MB) and optic lobe (OL). Scale bar = 100 µm. (I) Schematic summary of Dα6 subunit expression during different developmental stages, (L2, L3 and Adult) in which the green shading indicate the localisation of the Dα6 subunit.
Figure 7—figure supplement 1.
Figure 7—figure supplement 1.. In vivo imaging of endogenously tagged Dα1, Dβ1, Dβ2 nAChR subunits.
Live confocal microscope images for the indicated subunits tagged at the C-terminus with YFP. Scale bars as indicated.

Similar articles

Cited by

References

    1. Alexander JK, Govind AP, Drisdel RC, Blanton MP, Vallejo Y, Lam TT, Green WN. Palmitoylation of nicotinic acetylcholine receptors. Journal of Molecular Neuroscience: MN. 2010;40:12–40. doi: 10.1007/s12031-009-9246-z. - DOI - PMC - PubMed
    1. Barnstedt O, Owald D, Felsenberg J, Brain R, Moszynski JP, Talbot CB, Perrat PN, Waddell S. Memory-Relevant Mushroom Body Output Synapses Are Cholinergic. Neuron. 2016;89:1237–1247. doi: 10.1016/j.neuron.2016.02.015. - DOI - PMC - PubMed
    1. Blanc M, David F, Abrami L, Migliozzi D, Armand F, Bürgi J, Goot FG. SwissPalm: Protein Palmitoylation database. F1000Research. 2015;4:261. doi: 10.12688/f1000research.6464.1. - DOI - PMC - PubMed
    1. Bologna G, Yvon C, Duvaud S, Veuthey AL. N-terminal myristoylation predictions by ensembles of neural networks. Proteomics. 2004;4:1626–1632. doi: 10.1002/pmic.200300783. - DOI - PubMed
    1. Carroll J, Altman MC, Fearnley IM, Walker JE. Identification of membrane proteins by tandem mass spectrometry of protein ions. PNAS. 2007:14330–14335. doi: 10.1073/pnas.0706817104. - DOI - PMC - PubMed

Publication types

LinkOut - more resources