. 2022 May 25;22(10):4215-4222.
doi: 10.1021/acs.nanolett.2c01219. Epub 2022 May 16.

Two-Photon-Excited Single-Molecule Fluorescence Enhanced by Gold Nanorod Dimers

Affiliations

Two-Photon-Excited Single-Molecule Fluorescence Enhanced by Gold Nanorod Dimers

Xuxing Lu et al. Nano Lett. .

Abstract

We demonstrate two-photon-excited single-molecule fluorescence enhancement by single end-to-end self-assembled gold nanorod dimers. We employed biotinylated streptavidin as the molecular linker, which connected two gold nanorods in end-to-end fashion. The typical size of streptavidin of around 5 nm separates the gold nanorods with gaps suitable for the access of fresh dyes in aqueous solution, yet small enough to give very high two-photon fluorescence enhancement. Simulations show that enhancements of more than 7 orders of magnitude can be achieved for two-photon-excited fluorescence in the plasmonic hot spots. With such high enhancements, we successfully detect two-photon-excited fluorescence for a common organic dye (ATTO 610) at the single-molecule, single-nanoparticle level.

Keywords: ATTO 610 dye; gold nanorod dimer; plasmonic enhancement; single-molecule bursts; single-molecule fluorescence; two-photon excitation.


Conflict of interest statement

The authors declare no competing financial interest.

Figures

Figure 1
Figure 1
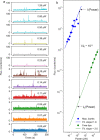
Optical characterization of ATTO 610. (a) Normalized one-photon absorption (blue-shaded band with dashed outline) and emission (light orange-shaded band with dashed outline) spectra of ATTO 610, respectively. The solid lines give the emission spectra of 4 μM ATTO 610 excited by ∼220 fs laser pulses at 760 nm for different powers depicted in panel b as matching dot colors for 760 nm wavelength. The integrating time for recording the spectra was set as 120 s. The inset shows the chemical structure of ATTO 610. (b) Power dependence of the emission integrated over wavelengths ranging from 555 to 728 nm, excited at the wavelength of 760 nm (dot colors correspond to the spectra colors in panel a) and 785 nm (black dots). The power law fits (solid lines) show close-to-perfect quadratic dependence of the emission on the excitation power for both excitation wavelengths.
Figure 2
Figure 2
Two-photon-excited single-molecule fluorescence enhancement. (a) One-photon-excited luminescence spectrum taken on three different structures made of gold nanorods: end-to-end dimer, side-by-side dimer, and a single gold nanorod, acquired under excitation by a circularly polarized 532 nm CW laser. Inset shows the SEM images of the structures. (b) Respective intensity traces taken in the presence of 20 nM ATTO 610 dyes, excited by a femtosecond laser at the wavelength of 760 nm and at the power of ∼2 μW. The binning time was set as 10 ms. (c) Respective zoomed-in views of the photoluminescence intensities indicated by the arrows shown in panel b. The binning time for the zoomed-in time traces was set as 1 ms. The single-step changes of those bursts in the time traces from the GNR dimers (blue and orange) confirm that the enhanced fluorescence signals are stemming from single molecules. As expected, the green trace of a single GNR does not show any clear bursts (see zoomed-in traces at two randomly chosen points).
Figure 3
Figure 3
Two-photon-excited fluorescence enhancement in the plasmonic hot spot of an end-to-end gold nanorod dimer. (a and d) Real-time spectra of a gold nanorod dimer with (a) and without (d) the presence of 100 nM ATTO 610 in solution. (b) Comparison of the measured spectrum (orange, corresponding to the recorded time of the orange dashed line in panel a) with the spectrum of free ATTO 610 dye in solution (green solid) and the simulated enhanced spectra (blue dashed, corresponding to the blue dashed line in panel e) in the hot spot. (e) Simulated emission spectra of an ATTO 610 molecule at different positions along the main axis of the gold nanorod dimer in the gap. (c) Calculated radiative (blue) and nonradiative (red) enhancement factor as functions of the position in the hot spot and (f) respective excitation (blue) and total emission (red) enhancements. The vertical red dashed lines in panels b and e represent the wavelength of the femtosecond laser.
Figure 4
Figure 4
Power dependence of the emission. (a) Emission time trace (10 ms/bin) as a function of excitation power recorded on a gold nanorod self-assembled nanostructure. The particle was immersed in a solution of ATTO 610 with the concentration of 30 nM. (b) Power dependence of the maximum fluorescence burst intensity (blue) and the averaged unenhanced fluorescence per molecule.

Similar articles

Cited by

References

    1. So P. T. C.; Dong C. Y.; Masters B. R.; Berland K. M. Two-Photon Excitation Fluorescence Microscopy. Annu. Rev. Biomed. Eng. 2000, 2, 399–429. 10.1146/annurev.bioeng.2.1.399. - DOI - PubMed
    1. Callis P. R. On the Theory of Two-photon Induced Fluorescence Anisotropy with Application to Indoles. J. Chem. Phys. 1993, 99, 27–37. 10.1063/1.465805. - DOI
    1. Göppert-Mayer M. Über Elementarakte Mit Zwei Quantensprüngen. Ann. Phys. 1931, 401, 273–294. 10.1002/andp.19314010303. - DOI
    1. Franken P. A.; Hill A. E.; Peters C. W.; Weinreich G. Generation of Optical Harmonics. Phys. Rev. Lett. 1961, 7, 118–119. 10.1103/PhysRevLett.7.118. - DOI
    1. Kaiser W.; Garrett C. G. B. Two-Photon Excitation in CaF2: Eu2+. Phys. Rev. Lett. 1961, 7, 229–231. 10.1103/PhysRevLett.7.229. - DOI

Publication types