. 2022 May 2:(183):10.3791/61277.
doi: 10.3791/61277.

Imaging and Analysis of Oil Red O-Stained Whole Aorta Lesions in an Aneurysm Hyperlipidemia Mouse Model

Affiliations

Imaging and Analysis of Oil Red O-Stained Whole Aorta Lesions in an Aneurysm Hyperlipidemia Mouse Model

Pei-Yu Chen et al. J Vis Exp. .

Abstract

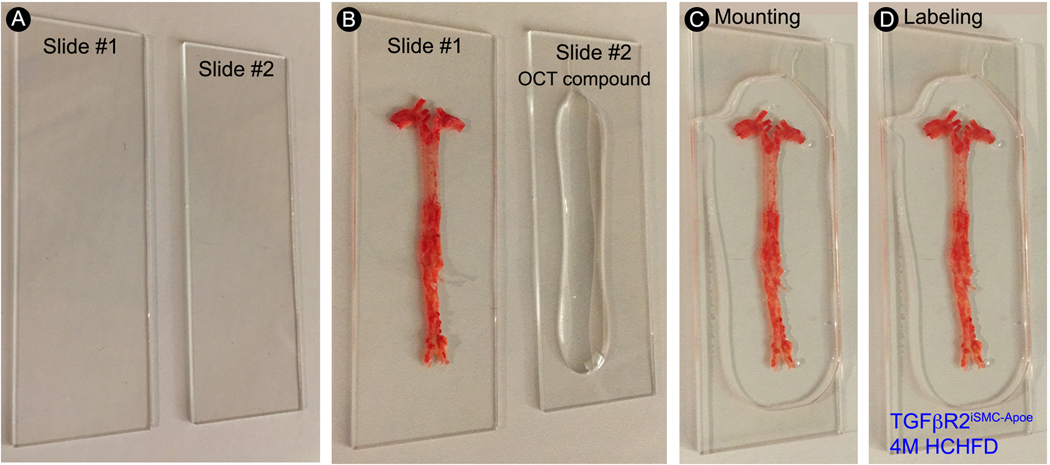
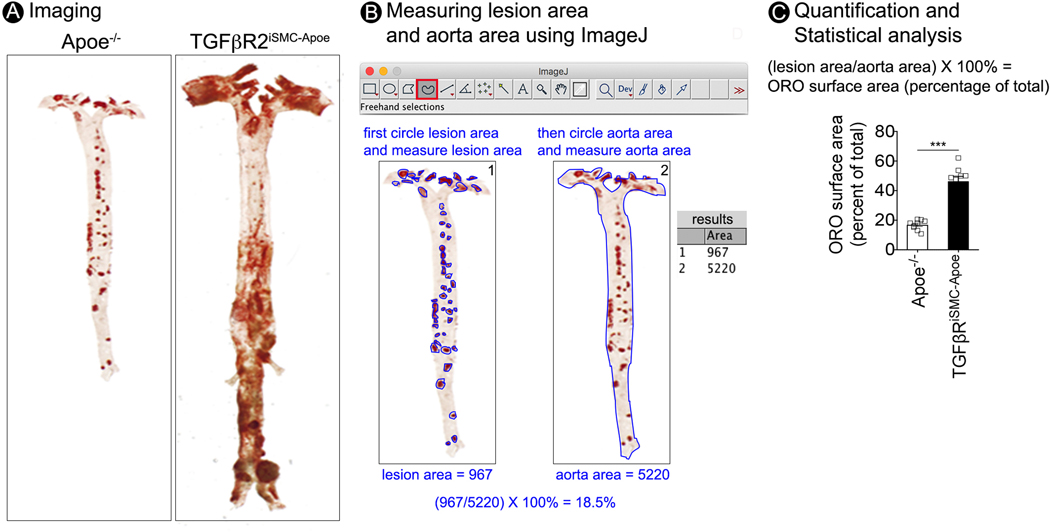
Apolipoprotein E (Apoe)- or low density lipoprotein receptor (Ldlr)-deficient hyperlipidemic mice are the two most commonly used models for atherosclerosis research. They are used to study the impact of a various genetic factors and different cell types on atherosclerotic lesion formation and as well as test the development of new therapies. Isolation, excision of the whole aorta, and quantification of Oil Red O-stained atherosclerotic lesions are basic morphometric methods used to evaluate atherosclerotic burden. The goal of this protocol is to describe an optimized, step-by-step surgical method to dissect, perfuse-fix, isolate, stain, image and analyze atherosclerotic lesions in mouse aortas with Oil Red O. Because atherosclerotic lesions can form anywhere in the entire aortic tree, this whole aorta Oil Red O staining method has the advantage of evaluating lipid-laden plaques in the entire aorta and all branches in a single mouse. In addition to Oil Red O staining, fresh isolated whole aortas can be used for variety of in vitro and in vivo experiments and cell isolations.


Figures

Figure 1.
Figure 1.
All the dissection tools used in this protocol.
Figure 2.
Figure 2.
Step-by-step protocol for excision of a 24-week old TGFβR2iSMC-Apoe mouse fed with 4 months of HCHF diet mouse aorta. (A) Mouse under ketamine/xylene anesthesia. Dashed lines indicate where to cut the skin. (B) Dissect the mouse to expose the thoracic and abdominal cavities. (C) Carefully remove the internal organs including lung, liver, spleen, gastrointestinal and reproductive organs and expose the mouse aorta under a dissection microscope. (D) Carefully remove the connective tissues along the aorta as clean as possible. (E) Image of isolated whole aorta with branches
Figure 3.
Figure 3.
Step-by-step protocol for unopened aorta Oil Red O staining and imaging. (A) Pin the whole aorta with branches on a wax petri dish. (B) Cover the aorta with Oil Red O staining solution. (C) Image illustrate the whole aorta after Oil Red O staining. (D) Image illustrate Oil Red O stained whole aorta after cleaning. (E) Representative photomicrographs of Oil Red O stained whole aorta of TGFβR2iSMC-Apoe mice after 4 months of HCHF diet. (a’) A high-magnification of ascending aorta from a. (b’) A high-magnification of abdominal aorta from b.
Figure 4.
Figure 4.
Step-by-step protocol for en face aorta preparation. (A-B) The arterial tree stained with Oil Red O was opened longitudinally in order to flatten the aorta for imaging. Dotted lines along the vessel wall and numbers indicate sequential cuts to be made to open up the vessels. (C) Longitudinally split and pinned whole aorta on a wax petri dish in Y shape.
Figure 5.
Figure 5.
Step-by-step protocol for en face aorta mounting. (A) Gently clean the glass microscope slides with 70% ethanol and dry with clean laboratory wipes. (B) Apply a small amount of OCT compound to the surface of one glass microscope slide and spread the en face aorta flat on the other glass microscope slide. (C) Gently place the glass microscope slide with OCT compound on the top of the en face aorta sample. (D) Label the slide with sample name.
Figure 6.
Figure 6.
Step-by-step protocol for en face aorta imaging and atherosclerotic lesion quantification. (A) Microphotographs of en face aortas from Apoe−/− and TGFβR2iSMC-Apoe mice after 4 months of HCHF diet stained with Oil Red O. (B) Images illustrating the process for computer-assisted quantification of the atherosclerotic lesions. (C) Lesion area quantification: % lesion area refers to Oil Red O stained as a % of the total aortic surface. All data shown as mean ± SEM ( ***p<0.001; unpaired two-tailed Student’s t test) (for each time point N=9 for Apoe−/− mice; and N=9 for TGFβR2iSMC-Apoe mice).

References

    1. Lusis AJ Atherosclerosis. Nature. 407, 233–241 (2000). - PMC - PubMed
    1. Emini Veseli B. et al. Animal models of atherosclerosis. European Journal of Pharmacology. 816, 3–13 (2017). - PubMed
    1. Plump AS et al. Severe hypercholesterolemia and atherosclerosis in apolipoprotein E-deficient mice created by homologous recombination in ES cells. Cell. 71, 343–353 (1992). - PubMed
    1. Zhang SH, Reddick RL, Piedrahita JA, Maeda N. Spontaneous hypercholesterolemia and arterial lesions in mice lacking apolipoprotein E. Science. 258, 468–471 (1992). - PubMed
    1. Ishibashi S. et al. Hypercholesterolemia in low density lipoprotein receptor knockout mice and its reversal by adenovirus-mediated gene delivery. Journal of Clinical Investigation. 92, 883–893 (1993). - PMC - PubMed

Publication types