. 2022 Jun 28;13(3):e0346721.
doi: 10.1128/mbio.03467-21. Epub 2022 May 16.

Complex Ecotype Dynamics Evolve in Response to Fluctuating Resources

Affiliations

Complex Ecotype Dynamics Evolve in Response to Fluctuating Resources

Megan G Behringer et al. mBio. .

Abstract

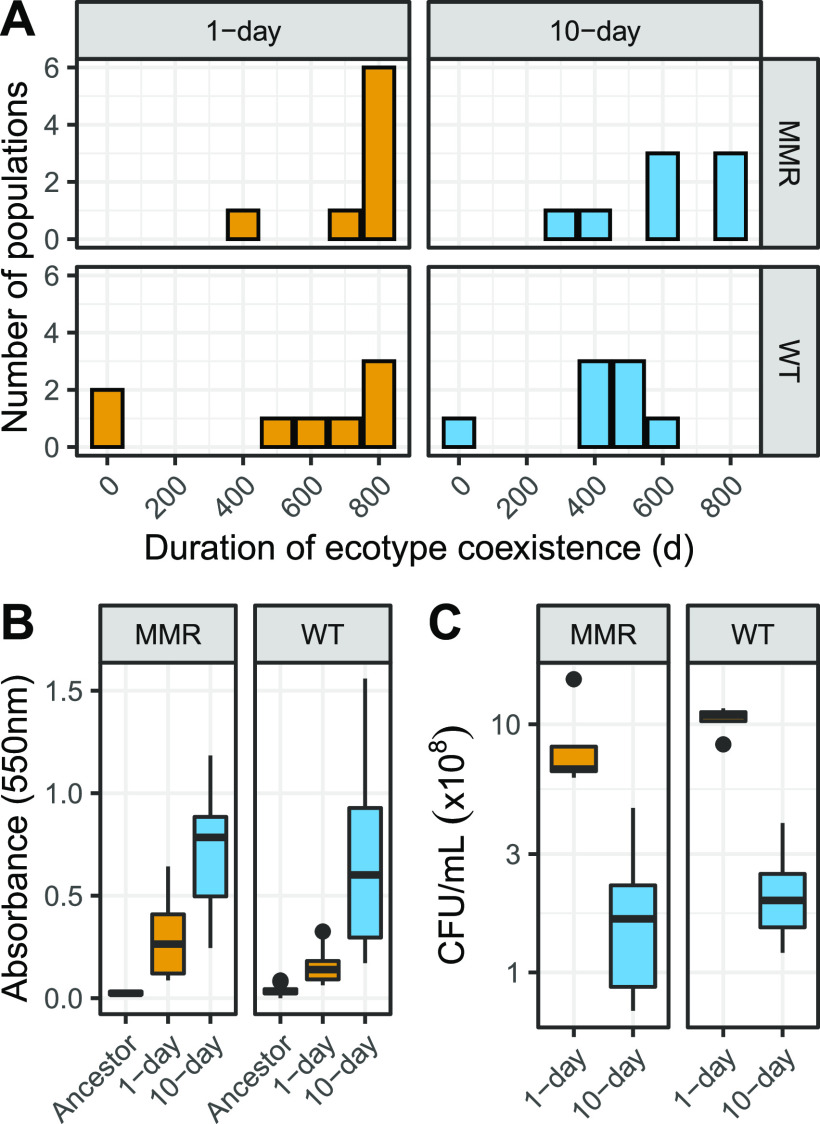
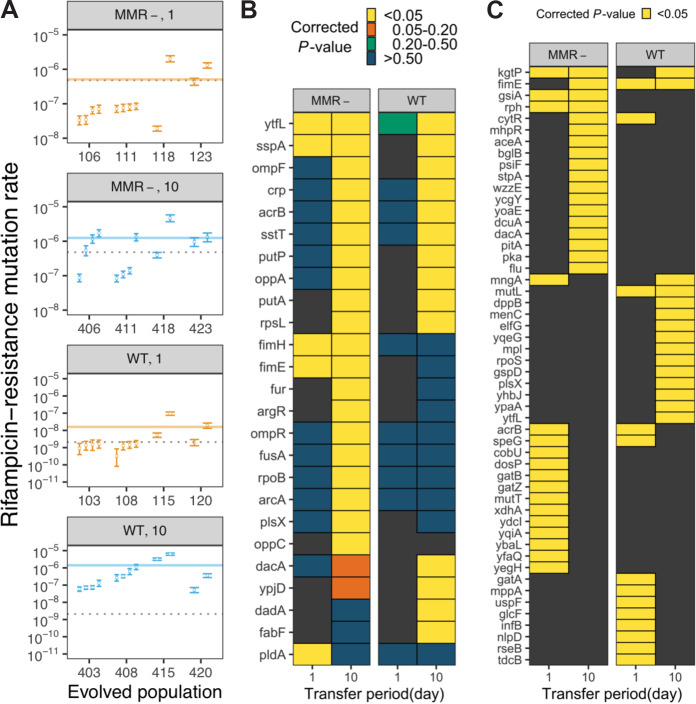
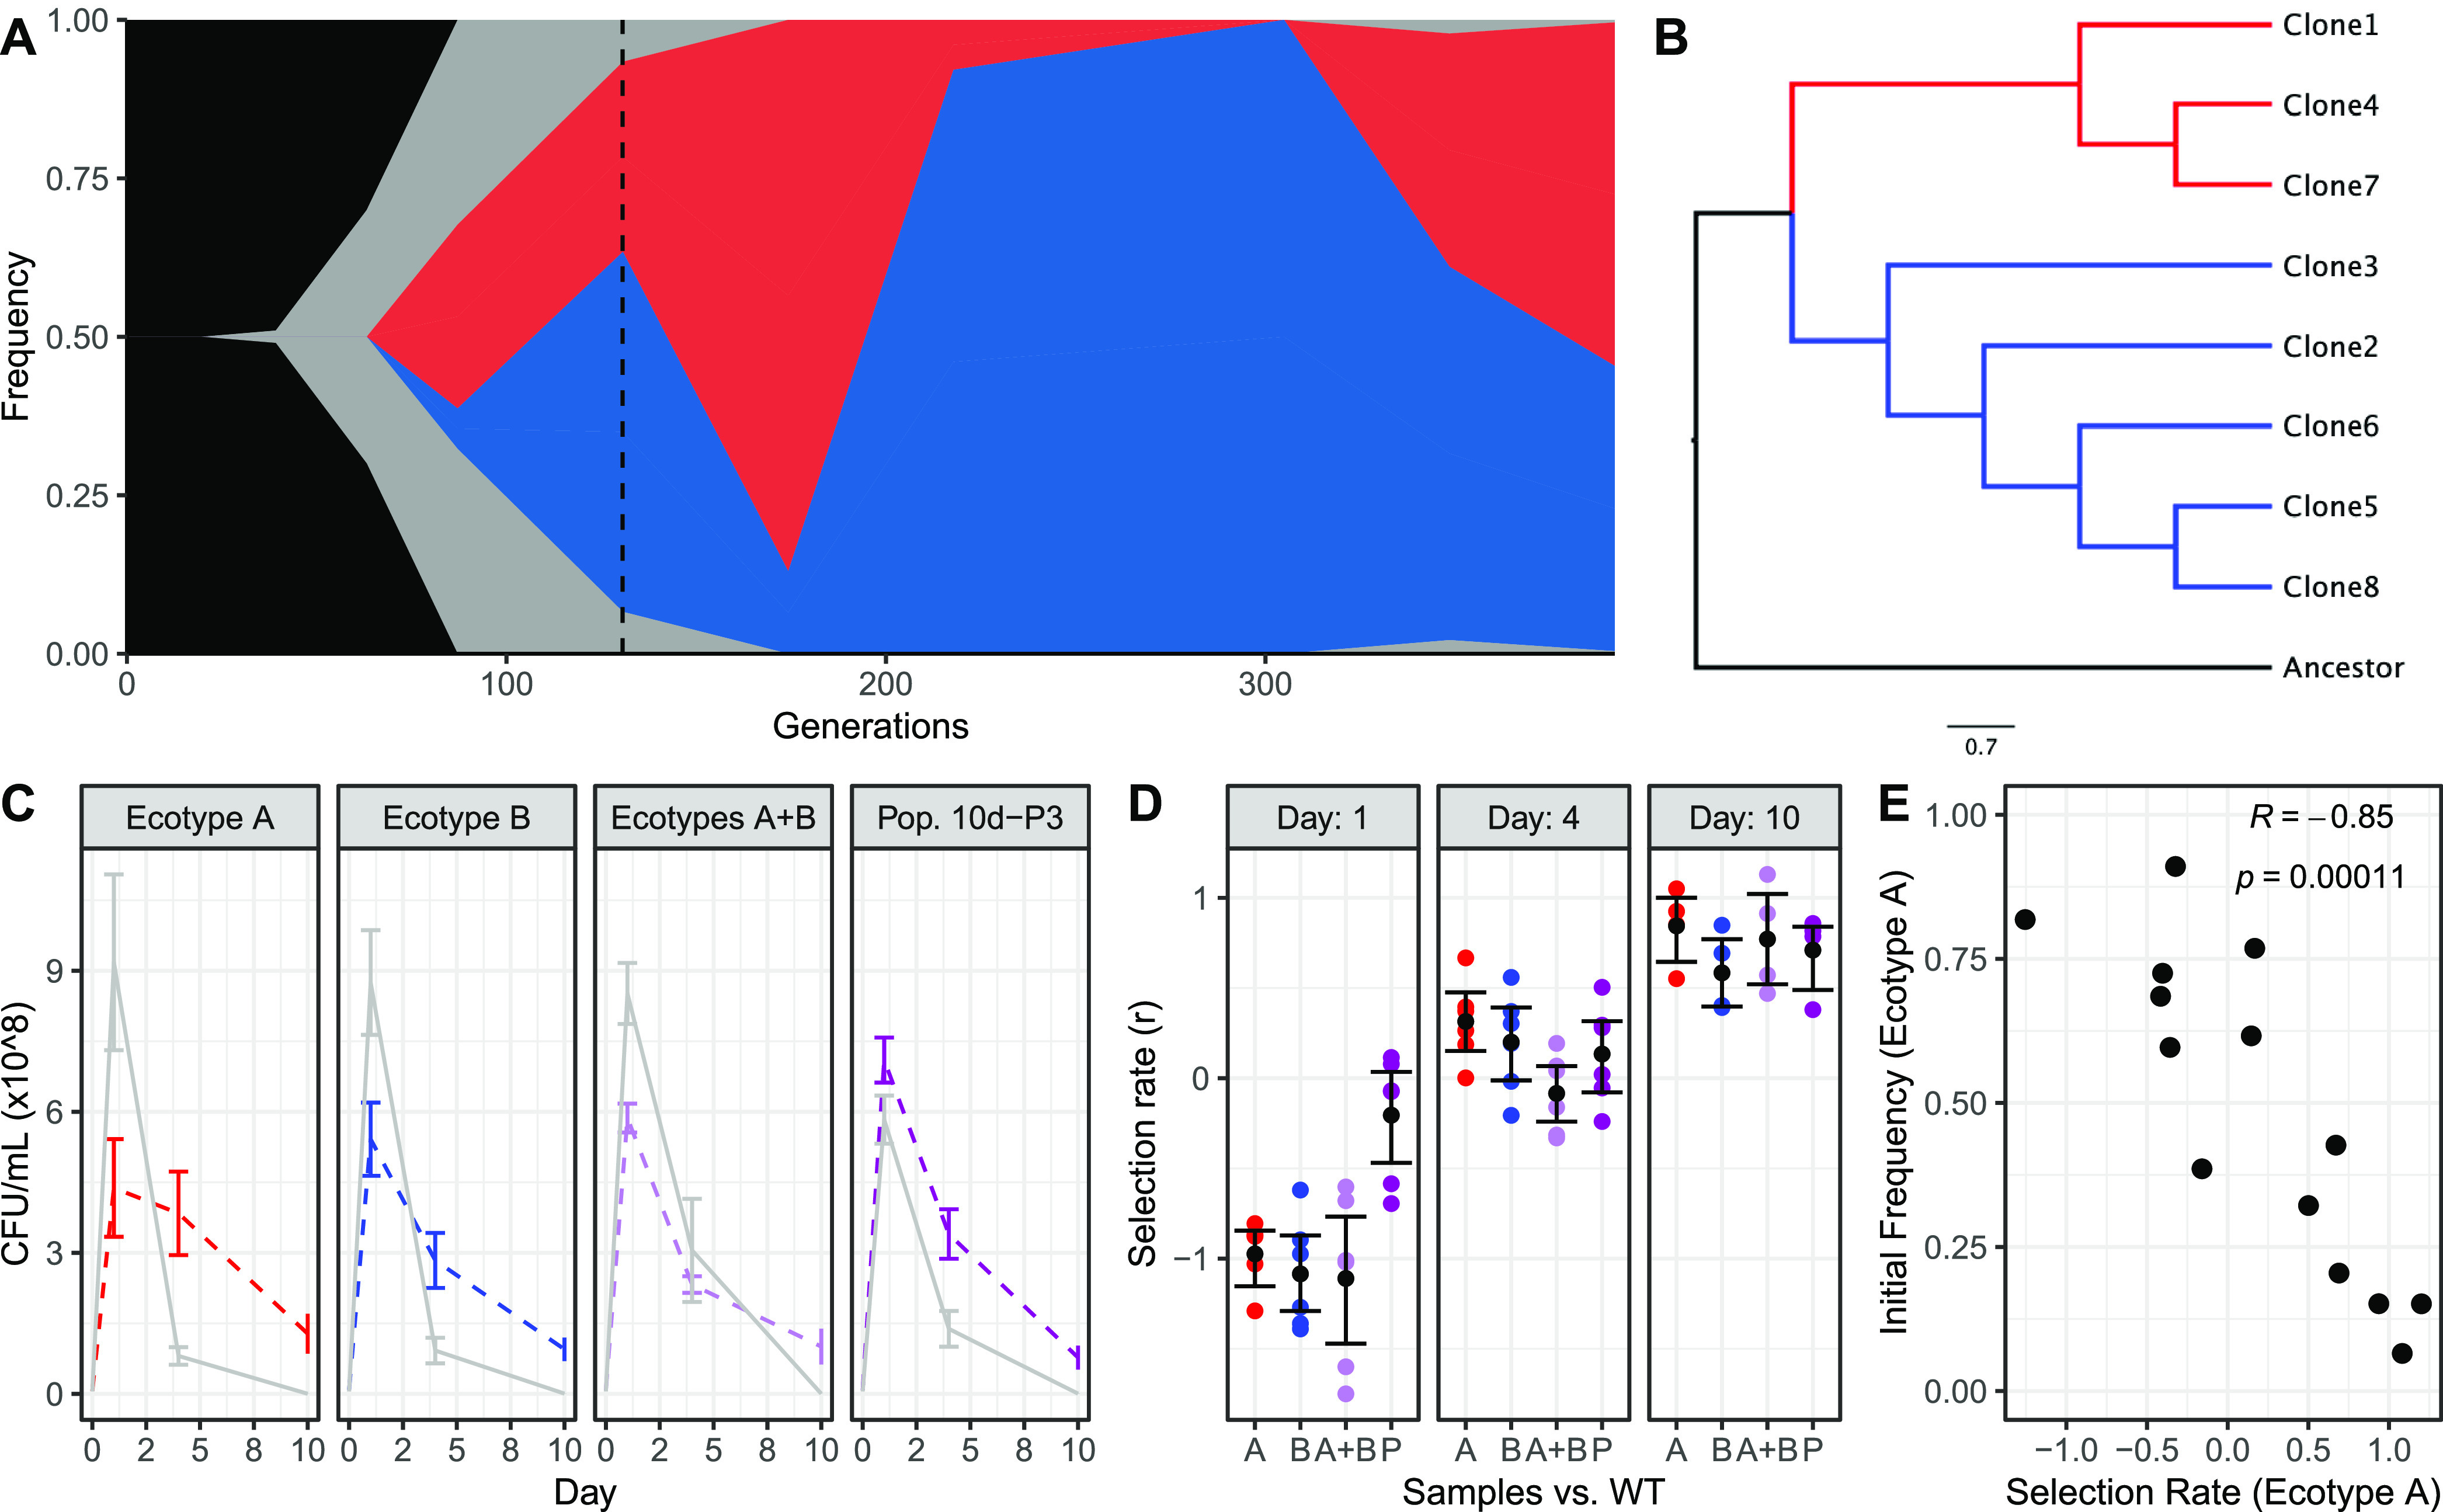
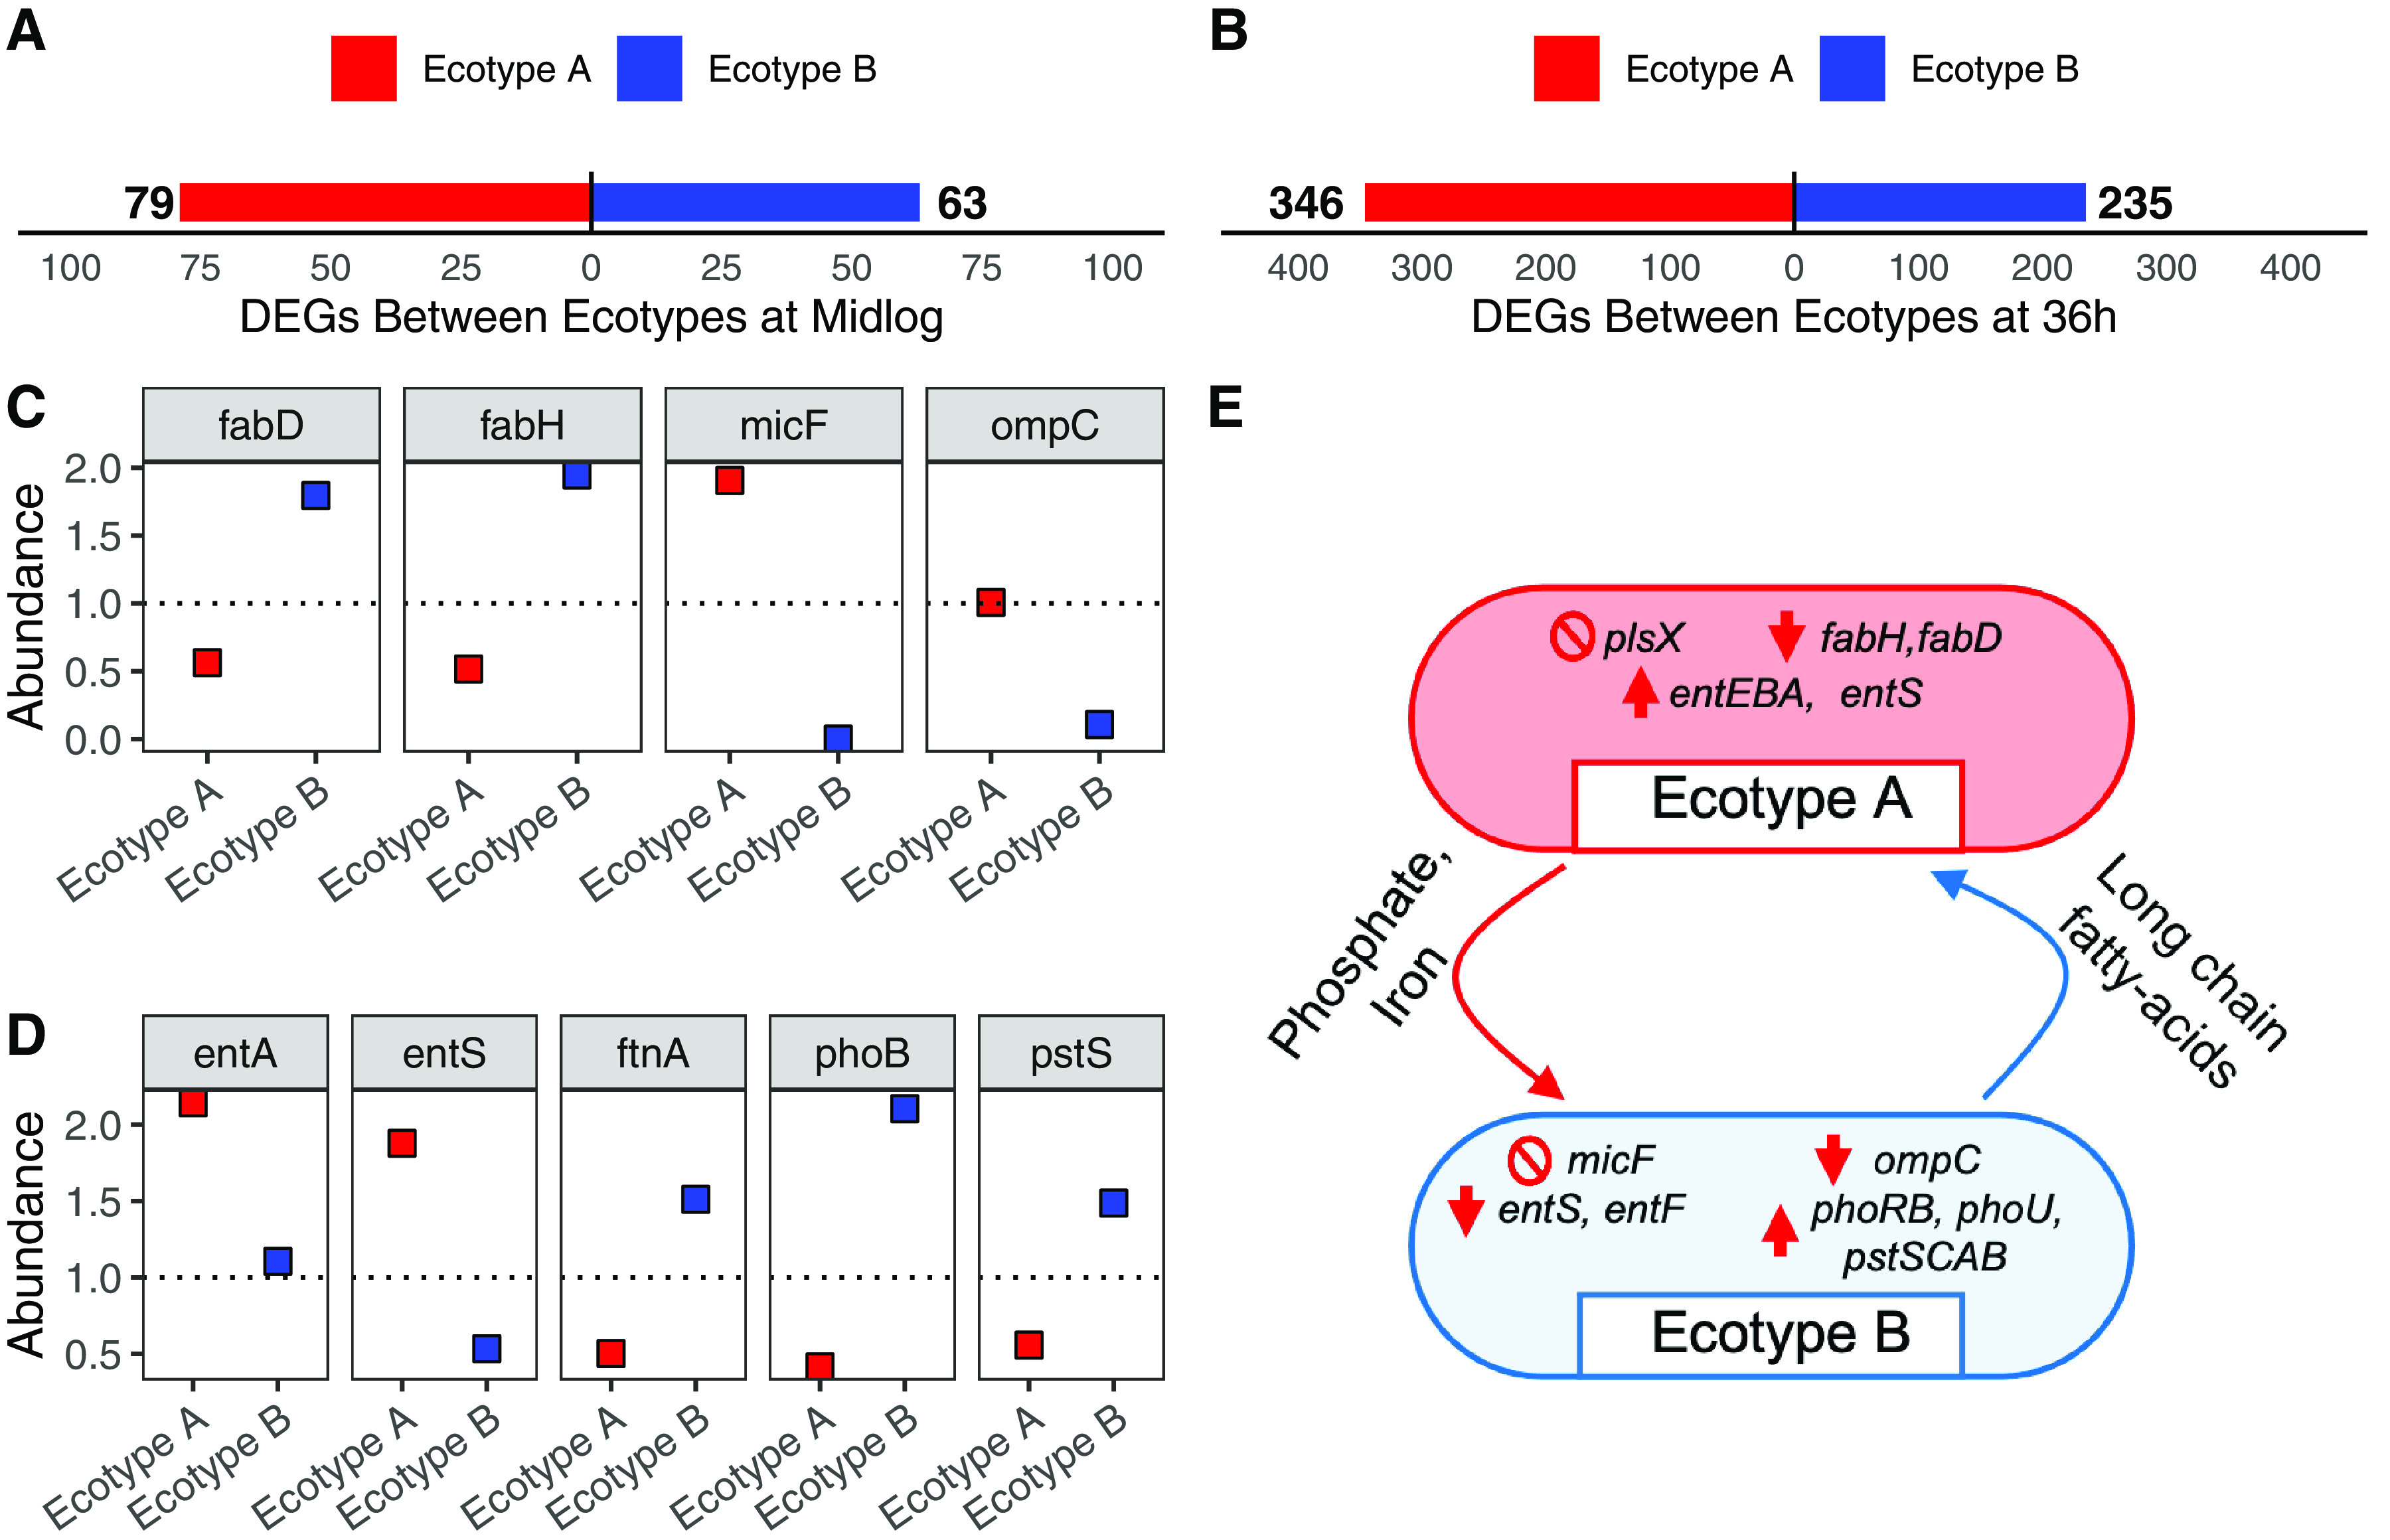
Ecotypic diversification and its associated cooperative behaviors are frequently observed in natural microbial populations whose access to resources is often sporadic. However, the extent to which fluctuations in resource availability influence the emergence of cooperative ecotypes is not fully understood. To determine how exposure to repeated resource limitation affects the establishment and long-term maintenance of ecotypes in a structured environment, we followed 32 populations of Escherichia coli evolving to either 1-day or 10-day feast/famine cycles for 900 days. Population-level analysis revealed that compared to populations evolving to 1-day cycles, 10-day populations evolved increased biofilm density, higher parallelism in mutational targets, and increased mutation rates. As previous investigations of evolution in structured environments have identified biofilm formation as the earliest observable phenotype associated with diversification of ecotypes, we revived cultures midway through the evolutionary process and conducted additional genomic, transcriptional, and phenotypic analyses of clones isolated from these evolving populations. We found not only that 10-day feast/famine cycles support multiple ecotypes but also that these ecotypes exhibit cooperative behavior. Consistent with the black queen hypothesis, or evolution of cooperation by gene loss, transcriptomic evidence suggests the evolution of bidirectional cross-feeding behaviors based on essential resources. These results provide insight into how analogous cooperative relationships may emerge in natural microbial communities. IMPORTANCE Despite regular feast and famine conditions representing an environmental pressure that is commonly encountered by microbial communities, the evolutionary outcomes of repeated cycles of feast and famine have been less studied. By experimentally evolving initially isogenic Escherichia coli populations to 10-day feast/famine cycles, we observed rapid diversification into ecotypes with evidence of bidirectional cross-feeding on costly resources and frequency-dependent fitness. Although unidirectional cross-feeding has been repeatedly observed to evolve in laboratory culture, most investigations of bidirectional cooperative behaviors in microbial populations have been conducted in engineered communities. This work demonstrates the de novo evolution of black queen relationships in a microbial population originating from a single ancestor, providing a model for investigation of the eco-evolutionary processes leading to mutualistic cooperation.

Keywords: Escherichia coli; black queen hypothesis; experimental evolution; intraspecific cooperation; starvation.


Conflict of interest statement

The authors declare no conflict of interest.

Figures

FIG 1
FIG 1
Presence of coexisting ecotypes is supported by genomic data and is associated with increased biofilm formation. (A) Distribution of durations of coexistence of major and minor clades, or multiple ecotypes, as determined by the caHMM among the parallel experimental populations for each resource limitation cycle/genetic background combination for 1 day (orange) or 10 days (blue). (B) Quantification of biofilm formation for the ancestral clone and evolved populations at the 900-day time point. Biofilm was stained with crystal violet and measured at an absorbance of 550 nm via microplate reader after 24 h of static growth in a 96-well plate. (C) Quantification of CFU numbers for the evolved populations after 24 h of growth. The observed increases of biofilm formation in populations evolving to 10-day feast/famine cycles cannot be explained by population-size differences, as these populations exhibit lower CFU counts after 24 h of growth. For panels B and C, boxplots visualize the quantile distribution of measurements.
FIG 2
FIG 2
Genomic responses to 10-day feast/famine cycles include increased base genetic mutation rates and high parallelism in fixed mutations within ecotypes. (A) Mutation rates of populations at the 900-day time point for each resource limitation cycle (1 or 10 days) and genetic background (MMR or WT) as measured by fluctuation tests. In each combination, four evolved replicate lines were tested by isolating and measuring two or four clones per evolved line. As mutation rates are estimated via maximum likelihood, the open circle and error bar represent the mean and the 95% confidence interval for each clone. The gray dashed line represents the mutation rate measurement of the corresponding ancestor. The transparent colored lines represent the mean mutation rate measurement of each combination. (B and C) Heatmaps visualize genes that are likely under positive selection, as they are enriched for nonsynonymous mutations that significantly contribute to the increased sum of G scores (B) or significantly overrepresented structural mutations (IS element insertions and indels) (C). Significance levels (simulated P values with Bonferroni correction) are shown by the different nonblack colors of tiles. Genes with no such hits in a particular resource limitation cycle/genetic background combination are shown by black tiles.
FIG 3
FIG 3
Evaluation of isolated clones reveals long-term ecotype dynamics suggesting frequency-dependent selection. (A) Pairing whole-population genomic sequencing of population 10d-P3 (WT, 10-day cycles) with genomic sequencing of eight clones isolated from population 10d-P3 at the day 300 time point (dotted vertical line) reveals two distinct ecotypes, ecotype A (red) and ecotype B (blue). (B) Clustering via maximum likelihood confirms the distinct diversification of isolated clones into two primary clades. (C) Coculture assays competing the WT ancestor against isolated clones (A, red; B, blue), pooled clones (1:1 A and B, light purple), and revived population samples (1:2 A and B) over 10 days of culture suggests frequency-dependent cooperative interactions between ecotypes, as evolved samples perform worse outside the evolved 1:2 ratio observed at the day 300 time point. Lines denote the trend of the mean CFU/mL count of the ancestor (solid gray) and evolved (dashed colored) samples over the 10-day coculture. Error bars denote ± SEM. (D) Revived population samples (P) exhibit significantly higher selection rates on day 1 compared to the other evolved samples, with comparable selection rates on day 4 and 10. Colored circles indicate measured selection rates for each replicate, black circles indicate mean selection rate, and error bars indicate ± SEM. (E) Competition of ecotype A versus ecotype B when pooled at different initial frequencies reveals selection rate values that confirm negative frequency dependence. R value denotes Pearson’s correlation coefficient.
FIG 4
FIG 4
Differential expression reveals functional differences between evolved ecotypes. Comparison of relative transcript abundance between ecotypes at mid-log phase (A) and 36 h (B). Bars illustrate the total number of transcripts with significantly higher expression in ecotype A (red) or ecotype B (blue). (C) Relative abundance of transcripts associated with fatty acid biosynthesis (fadD and fadH) and passive uptake of long-chain fatty acids (micF and ompC) for both ecotypes with respect to mean transcript abundance of the WT ancestor at mid-log phase. (D) Relative abundance of transcripts associated with enterobactin biosynthesis (entA and entS), iron storage (ftnA), and phosphate uptake (phoB and pstS) for both ecotypes with respect to mean transcript abundance of the WT ancestor at 36 h. For both panels C and D, ecotypes A and B are represented by red and blue squares, respectively. The dotted line represents the 1:1 ratio line with respect to the WT ancestor. (E) Schematic illustrating the hypothesized cross-feeding relationships between ecotypes A and B, with crossed circles highlighting null genes of interest, thick red arrows illustrating evolved differences in gene expression, and thin curved arrows illustrating resources shared by ecotype A to ecotype B (red) or shared by ecotype B to ecotype A (blue).
FIG 5
FIG 5
Overlapping targets of parallel mutation following evolution of E. coli populations to long-term starvation and 10-day feast/famine cycles. Venn diagram showing the number of overlapping genes experiencing parallel mutations as a result of evolution to 10-day feast/famine cycles (this study; blue) and long-term starvation (Ratib et al. [57] and Katz et al., 2021(30); gray). Circles representing each gene set are not drawn to scale, and genes that overlap between multiple studies are listed in the offset labels.

References

    1. Rainey PB, Travisano M. 1998. Adaptive radiation in a heterogeneous environment. Nature 394:69–72. doi:10.1038/27900. - DOI - PubMed
    1. Poltak SR, Cooper VS. 2011. Ecological succession in long-term experimentally evolved biofilms produces synergistic communities. ISME J 5:369–378. doi:10.1038/ismej.2010.136. - DOI - PMC - PubMed
    1. Ribeck N, Lenski RE. 2015. Modeling and quantifying frequency-dependent fitness in microbial populations with cross-feeding interactions. Evolution 69:1313–1320. doi:10.1111/evo.12645. - DOI - PubMed
    1. Cordero OX, Polz MF. 2014. Explaining microbial genomic diversity in light of evolutionary ecology. Nat Rev Microbiol 12:263–273. doi:10.1038/nrmicro3218. - DOI - PubMed
    1. Healey D, Axelrod K, Gore J. 2016. Negative frequency‐dependent interactions can underlie phenotypic heterogeneity in a clonal microbial population. Mol Syst Biol 12:877. doi:10.15252/msb.20167033. - DOI - PMC - PubMed

Publication types