. 2022 Jun 28;7(3):e0006022.
doi: 10.1128/msystems.00060-22. Epub 2022 May 16.

Spatiotemporal Heterogeneity and Intragenus Variability in Rhizobacterial Associations with Brassica rapa Growth

Affiliations

Spatiotemporal Heterogeneity and Intragenus Variability in Rhizobacterial Associations with Brassica rapa Growth

Scott A Klasek et al. mSystems. .

Abstract

Microbial communities in the rhizosphere are distinct from those in soils and are influenced by stochastic and deterministic processes during plant development. These communities contain bacteria capable of promoting growth in host plants through various strategies. While some interactions are characterized in mechanistic detail using model systems, others can be inferred from culture-independent methods, such as 16S amplicon sequencing, using machine learning methods that account for this compositional data type. To characterize assembly processes and identify community members associated with plant growth amid the spatiotemporal variability of the rhizosphere, we grew Brassica rapa in a greenhouse time series with amended and reduced microbial treatments. Inoculation with a native soil community increased plant leaf area throughout the time series by up to 28%. Despite identifying spatially and temporally variable amplicon sequence variants (ASVs) in both treatments, inoculated communities were more highly connected and assembled more deterministically overall. Using a generalized linear modeling approach controlling for spatial variability, we identified 43 unique ASVs that were positively or negatively associated with leaf area, biomass, or growth rates across treatments and time stages. ASVs of the genus Flavobacterium dominated rhizosphere communities and showed some of the strongest positive and negative correlations with plant growth. Members of this genus, and growth-associated ASVs more broadly, exhibited variable connectivity in networks independent of growth association (positive or negative). These findings suggest host-rhizobacterial interactions vary temporally at narrow taxonomic scales and present a framework for identifying rhizobacteria that may work independently or in concert to improve agricultural yields. IMPORTANCE The rhizosphere, the zone of soil surrounding plant roots, is a hot spot for microbial activity, hosting bacteria capable of promoting plant growth in ways like increasing nutrient availability or fighting plant pathogens. This microbial system is highly diverse and most bacteria are unculturable, so to identify specific bacteria associated with plant growth, we used culture-independent community DNA sequencing combined with machine learning techniques. We identified 43 specific bacterial sequences associated with the growth of the plant Brassica rapa in different soil microbial treatments and at different stages of plant development. Most associations between bacterial abundances and plant growth were positive, although similar bacterial groups sometimes had different effects on growth. Why this happens will require more research, but overall, this study provides a way to identify native bacteria from plant roots that might be isolated and applied to boost agricultural yields.

Keywords: 16S RNA; Brassica rapa; feature selection; microbial communities; microbial community; plant growth promotion; rhizosphere; rhizosphere-inhabiting microbes.


Conflict of interest statement

The authors declare no conflict of interest.

Figures
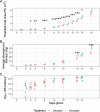
FIG 1
FIG 1
Plant and bacterial growth across the time series. (A and B) Projected leaf area (PA) (A) and aboveground biomass (B) by treatment across the time series. Points represent the mean across six blocks and five different harvest times (on days 3, 4, 13, or 14, with 95% confidence intervals shown). *, P < 0.05; **, P < 0.01; ***, P < 0.001. (C) Bacterial 16S gene counts per gram rhizosphere soil. Dashed line indicates mean SBC soil 16S rRNA gene copy number at inoculation, accounting for dilution.
FIG 2
FIG 2
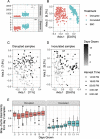
Rhizosphere bacterial community diversity. (A and B) Alpha diversity (number of observed ASVs and Shannon indices) (A) and PCoA ordination of Bray-Curtis dissimilarities (B) between raw soil inoculum (SBC) and rhizosphere communities by treatment. Separate ordinations of disrupted (C) and inoculated (D) communities are shaded by the number of days of plant growth, with harvest times indicated by shape. (E) Bray-Curtis dissimilarities across the time series. In each treatment, dissimilarities from communities harvested at each day are shown relative to those from day 2. (Dissimilarities at day 2 were calculated from day 2 samples only.) Raw read counts were transformed using cumulative sum scaling.
FIG 3
FIG 3
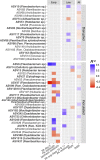
ASVs associated with plant growth in both treatments. ASVs were associated with projected area (PA), residuals of aboveground biomass controlling for days grown, residuals of PA controlling for days grown and sample collection date, and relative growth rates (RGR). Measurements from early and late columns denote rhizosphere communities from plants grown 3 to 4 or 13 to 14 days, respectively, while All denotes all plants grown >2 days. R2 values show proportions of variance explained by Bayesian models of abundances of each ASV versus plant growth, with blue showing positive associations and red being negative. ASVs are labeled by most specific taxonomy information and shown in bold if also included in best multivariate Bayesian models. PA, residual, and RGR values represent averages from 3 to 7 plants (early stage) or 2 plants (late stage).
FIG 4
FIG 4
Most abundant growth-associated ASVs across time. (A and B) Relative abundances of growth-associated ASVs from inoculated (A) or disrupted (B) communities harvested at times where they were positively or negatively associated with any metric of plant growth (early, days 3 and 4; late, days 13 and 14). ASVs with abundances of less than 0.2% of communities, on average, by treatment and time were omitted. Most specific taxonomies are shown. The y axis for positive growth-associated ASVs in panel B was truncated because ASV10 exceeded 15% abundance within three disrupted communities, with a maximum abundance of 36.6%.
FIG 5
FIG 5
Modules associated with plant growth in both treatments. Modules were associated with PA (A) and RGR (B). Columns denote time stages when rhizosphere communities were sampled (early, 3 to 4 days; all, > 2 days). R2 values show proportions of variance explained by Bayesian models of each individual module’s abundance versus plant growth, with blue showing positive associations and red being negative. Modules consisting of only one ASV show its most specific taxonomy, and modules indicated with an asterisk denote ASVs that were omitted from the ASV-centered workflow based on low abundance or prevalence. Module labels are shown in boldface if also included in best multivariate Bayesian models. PA, residual, and RGR values represent the averages from 2 to 7 plants.
FIG 6
FIG 6
Subsetted networks showing growth-associated ASVs and their strong co-occurrences. Networks show inoculated (A) and disrupted (B) communities, subsetted to include only growth-associated ASVs and those they show strong co-occurrences with. Positive co-occurrences are shown as gray edges for weights exceeding the third quartile of all weights from unsubsetted networks, and negative co-occurrences are shown as red edges for weights below the first quartile. Nodes labeled in blue are ASVs positively associated with growth, and nodes labeled in red are negative. Unlabeled nodes are connected to one or more growth-associated ASVs. Node size corresponds to the square-rooted average relative abundance, and node color indicates module membership. Edge thickness corresponds to connection weight. Node sizes and edge widths across networks are not to scale. (C) Degree (number of connections) from each ASV in unsubsetted networks of inoculated or disrupted communities, separated by whether they were associated with growth. *, P < 0.05; ***, P < 0.001.

References

    1. Marilley L, Aragno M. 1999. Phylogenetic diversity of bacterial communities differing in degree of proximity of Lolium perenne and Trifolium repens roots. Appl Soil Ecol 13:127–136. doi:10.1016/S0929-1393(99)00028-1. - DOI
    1. Bulgarelli D, Rott M, Schlaeppi K, Ver Loren van Themaat E, Ahmadinejad N, Assenza F, Rauf P, Huettel B, Reinhardt R, Schmelzer E, Peplies J, Gloeckner FO, Amann R, Eickhorst T, Schulze-Lefert P. 2012. Revealing structure and assembly cues for Arabidopsis root-inhabiting bacterial microbiota. Nature 488:91–95. doi:10.1038/nature11336. - DOI - PubMed
    1. Sasse J, Martinoia E, Northen T. 2018. Feed your friends: do plant exudates shape the root microbiome? Trends Plant Sci 23:25–41. doi:10.1016/j.tplants.2017.09.003. - DOI - PubMed
    1. Harbort CJ, Hashimoto M, Inoue H, Niu Y, Guan R, Rombolà AD, Kopriva S, Voges M, Sattely ES, Garrido-Oter R, Schulze-Lefert P. 2020. Root-secreted coumarins and the microbiota interact to improve iron nutrition in Arabidopsis. Cell Host Microbe 28:825–837. doi:10.1016/j.chom.2020.09.006. - DOI - PMC - PubMed
    1. Rengel Z. 2015. Availability of Mn, Zn and Fe in the rhizosphere. J Soil Science Plant Nutrition 15:397–409. doi:10.4067/S0718-95162015005000036. - DOI

Publication types

LinkOut - more resources