

Temperature and Geographic Location Impact the Distribution and Diversity of Photoautotrophic Gene Variants in Alkaline Yellowstone Hot Springs
- PMID: 35575591
- PMCID: PMC9241655
- DOI: 10.1128/spectrum.01465-21
Temperature and Geographic Location Impact the Distribution and Diversity of Photoautotrophic Gene Variants in Alkaline Yellowstone Hot Springs
Abstract
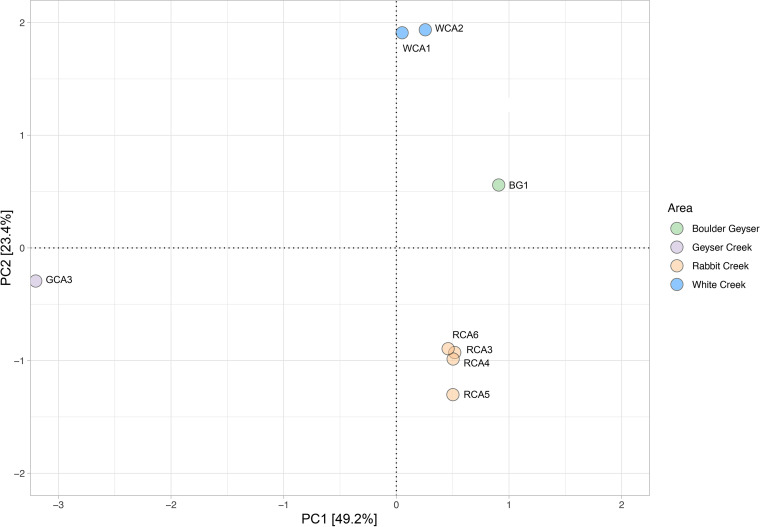
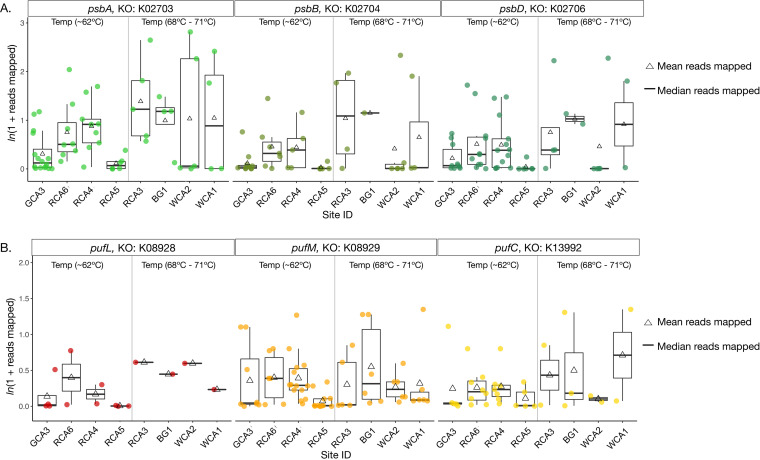
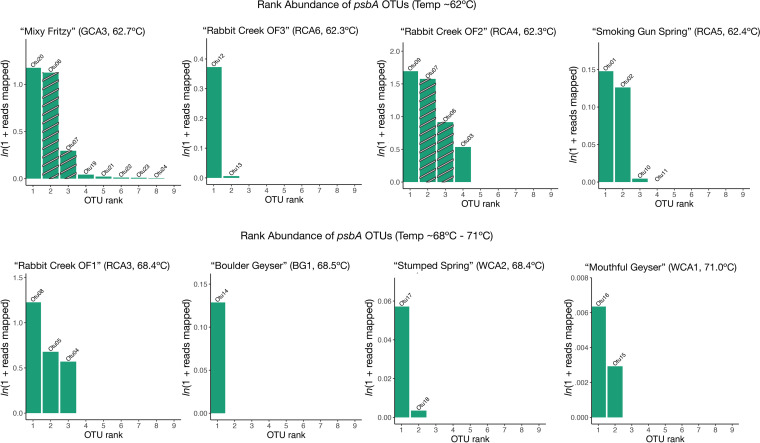
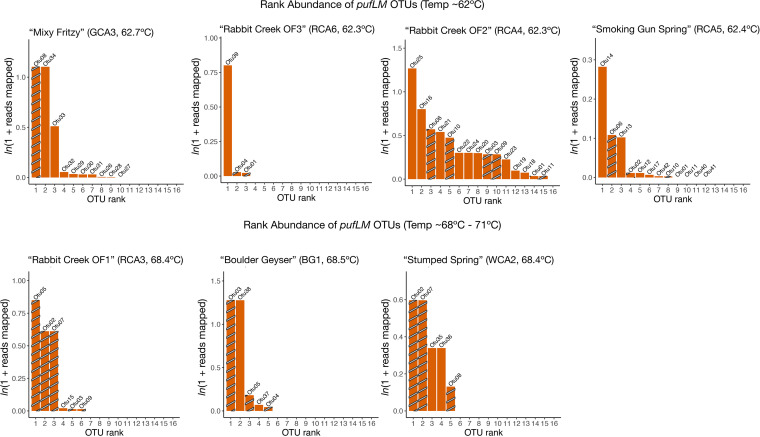
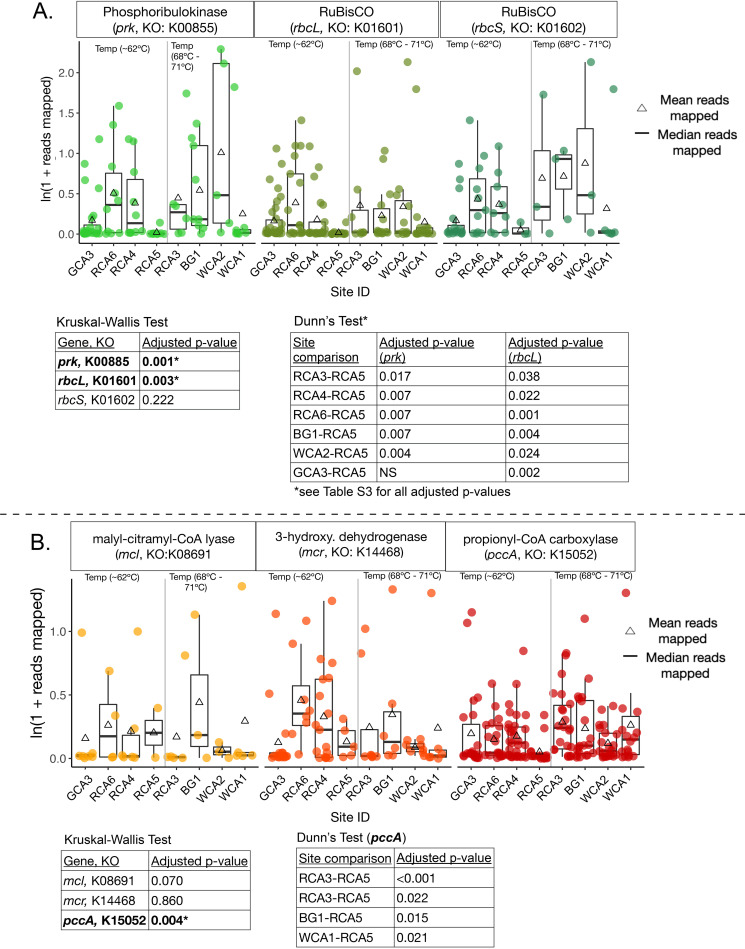
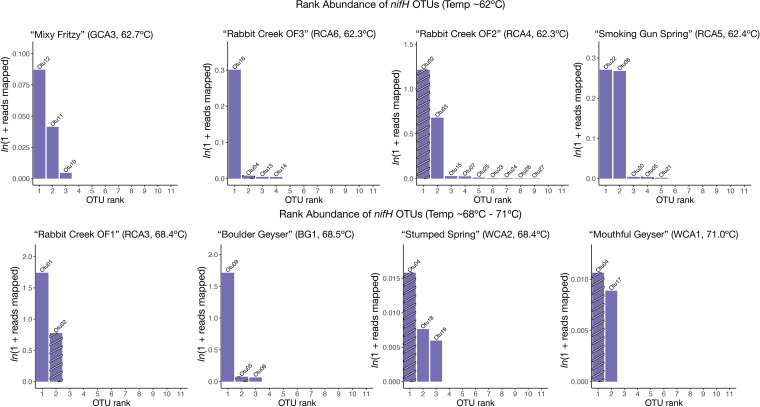
Alkaline hot springs in Yellowstone National Park (YNP) provide a framework to study the relationship between photoautotrophs and temperature. Previous work has focused on studying how cyanobacteria (oxygenic phototrophs) vary with temperature, sulfide, and pH, but many questions remain regarding the ecophysiology of anoxygenic photosynthesis due to the taxonomic and metabolic diversity of these taxa. To this end, we examined the distribution of genes involved in phototrophy, carbon fixation, and nitrogen fixation in eight alkaline (pH 7.3-9.4) hot spring sites near the upper temperature limit of photosynthesis (71ºC) in YNP using metagenome sequencing. Based on genes encoding key reaction center proteins, geographic isolation plays a larger role than temperature in selecting for distinct phototrophic Chloroflexi, while genes typically associated with autotrophy in anoxygenic phototrophs, did not have distinct distributions with temperature. Additionally, we recovered Calvin cycle gene variants associated with Chloroflexi, an alternative carbon fixation pathway in anoxygenic photoautotrophs. Lastly, we recovered several abundant nitrogen fixation gene sequences associated with Roseiflexus, providing further evidence that genes involved in nitrogen fixation in Chloroflexi are more common than previously assumed. Together, our results add to the body of work on the distribution and functional potential of phototrophic bacteria in Yellowstone National Park hot springs and support the hypothesis that a combination of abiotic and biotic factors impact the distribution of phototrophic bacteria in hot springs. Future studies of isolates and metagenome assembled genomes (MAGs) from these data and others will further our understanding of the ecology and evolution of hot spring anoxygenic phototrophs. IMPORTANCE Photosynthetic bacteria in hot springs are of great importance to both microbial evolution and ecology. While a large body of work has focused on oxygenic photosynthesis in cyanobacteria in Mushroom and Octopus Springs in Yellowstone National Park, many questions remain regarding the metabolic potential and ecology of hot spring anoxygenic phototrophs. Anoxygenic phototrophs are metabolically and taxonomically diverse, and further investigations into their physiology will lead to a deeper understanding of microbial evolution and ecology of these taxa. Here, we have quantified the distribution of key genes involved in carbon and nitrogen metabolism in both oxygenic and anoxygenic phototrophs. Our results suggest that temperature >68ºC selects for distinct groups of cyanobacteria and that carbon fixation pathways associated with these taxa are likely subject to the same selective pressure. Additionally, our data suggest that phototrophic Chloroflexi genes and carbon fixation genes are largely influenced by local conditions as evidenced by our gene variant analysis. Lastly, we recovered several genes associated with potentially novel phototrophic Chloroflexi. Together, our results add to the body of work on hot springs in Yellowstone National Park and set the stage for future work on metagenome assembled genomes.
Keywords: Chloroflexi; anoxygenic photosynthesis; cyanobacteria; hot springs; metagenomics; photosynthesis; phototroph.
Conflict of interest statement
The authors declare no conflict of interest.
Figures
References
-
- Ward DM, Cohan FM. 2005. Microbial diversity in hot spring cyanobacterial mats: pattern and prediction, p 185–202. In Inskeep WP, McDermott T (ed), Geothermal biology and geochemistry in Yellowstone National Park. Thermal Biology Institute, Bozeman, Montana.
-
- Tank M, Thiel V, Ward DM, Bryant DA. 2017. A panoply of phototrophs: an overview of the thermophilic chlorophototrophs of the microbial mats of alkaline siliceous hot springs in Yellowstone National Park, WY, USA, p 87–137. In Hallenbeck P (ed), Modern topics in the phototrophic prokaryotes: environmental and applied aspects. Springer, New York, NY.
Publication types
MeSH terms
LinkOut - more resources
Full Text Sources
Molecular Biology Databases
