Review
. 2022 Jun 6;51(11):4583-4762.
doi: 10.1039/d0cs01079k.

Water electrolysis: from textbook knowledge to the latest scientific strategies and industrial developments

Affiliations
Review

Water electrolysis: from textbook knowledge to the latest scientific strategies and industrial developments

Marian Chatenet et al. Chem Soc Rev. .

Abstract

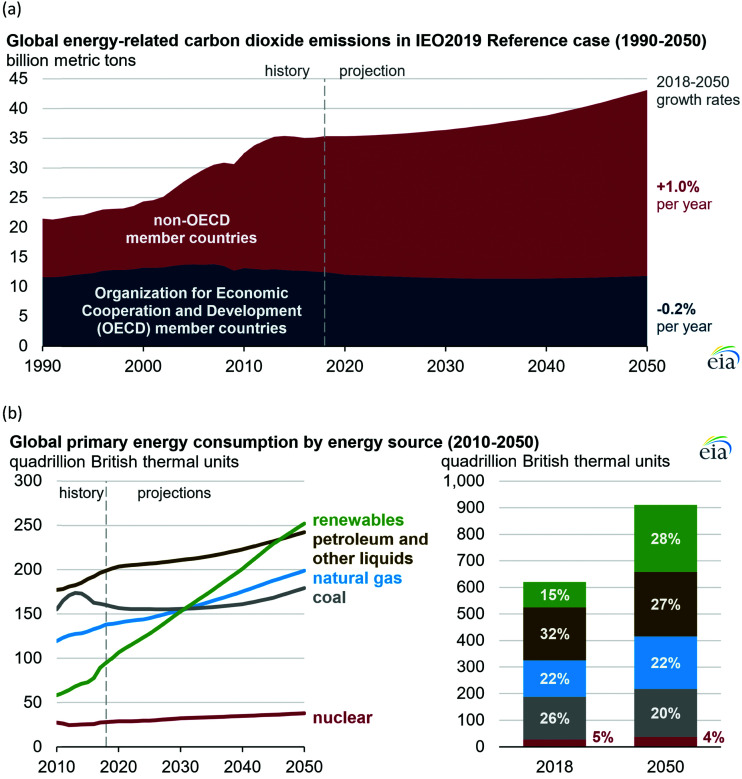
Replacing fossil fuels with energy sources and carriers that are sustainable, environmentally benign, and affordable is amongst the most pressing challenges for future socio-economic development. To that goal, hydrogen is presumed to be the most promising energy carrier. Electrocatalytic water splitting, if driven by green electricity, would provide hydrogen with minimal CO2 footprint. The viability of water electrolysis still hinges on the availability of durable earth-abundant electrocatalyst materials and the overall process efficiency. This review spans from the fundamentals of electrocatalytically initiated water splitting to the very latest scientific findings from university and institutional research, also covering specifications and special features of the current industrial processes and those processes currently being tested in large-scale applications. Recently developed strategies are described for the optimisation and discovery of active and durable materials for electrodes that ever-increasingly harness first-principles calculations and machine learning. In addition, a technoeconomic analysis of water electrolysis is included that allows an assessment of the extent to which a large-scale implementation of water splitting can help to combat climate change. This review article is intended to cross-pollinate and strengthen efforts from fundamental understanding to technical implementation and to improve the 'junctions' between the field's physical chemists, materials scientists and engineers, as well as stimulate much-needed exchange among these groups on challenges encountered in the different domains.


Conflict of interest statement

There are no conflicts to declare.

Figures

Fig. 1
Fig. 1. (a) Global carbon dioxide emissions; (b) global primary energy consumption by energy source. Source: ref. .
Fig. 2
Fig. 2. Water electrolysis electrode potentials with pH at standard conditions. Reproduced with permission from ref. . Wiley 2020.
Scheme 1
Scheme 1. (a) The acid–base and direct coupling adsorbate evolution reaction mechanisms of OER in the acidic (blue) or alkaline (red) medium. (b) The lattice oxygen mechanism of OER in alkaline medium. (c) The Volmer–Tafel HER mechanism on the electrode surface in acidic (blue) or alkaline (red) conditions. (d) Volmer–Heyrovsky mechanism of the HER.
Scheme 2
Scheme 2. The mechanism of the hydrogen evolution reaction in an acidic medium.
Fig. 3
Fig. 3. A common phenomenon in chemical catalysis is the volcano relationship between the catalytic activity of a particular reaction on the ordinate (on a log scale) and an activity descriptor on the abscissa. It is found that for a given reaction carried out on a variety of catalysts, the rates on each catalyst can be plotted so that they pass through a maximum. What is plotted on the abscissa varies, but it is always a function that includes a property of the catalyst (e.g., heat of sublimation, bonding strength of a reaction intermediate to the catalyst material). The volcano behaviour of the exchange current density of the hydrogen oxidation reaction vs. M–H bonding strength is generally valid for pure metals in acidic solution and was first determined by Trasatti 97. The noble metals Pt and Pd demonstrate exceptionally high activity, with Ni as the most active non-precious metal. Reproduced with permission from ref. Copyright 1972 Elsevier.
Fig. 4
Fig. 4. A theoretical-computational workflow to decipher the OER. Step 1. A DFT-based grand-canonical approach is developed to identify the surface adsorption state under relevant electrochemical conditions, i.e., through computing the surface Pourbaix diagram. Step 2. The OER reaction mechanism is identified and the Gibbs free energy diagram is generated using periodic DFT calculations. Step 3. A microkinetic model is formulated to obtain an expression for the net reaction rate. Step 4. The electrochemical interface model is solved to obtain the metal charging relation. The fully parameterised approach provides as output mechanistic insights as in Step 5 and 6, e.g., the rate-determining term in the net reaction rate; a descriptor-based activity assessment for materials screening; and effective parameters like Tafel-slope or exchange current density to use in porous electrode models.
Scheme 3
Scheme 3. Schematic presentation of the five main types of water electrolysers.
Fig. 5
Fig. 5. The annual number of publications in the field of AEMs (from Web of Science (access 29.07.2021)). Search terms: “Anion exchange membrane”, “water” and “electrolysis”.
Fig. 6
Fig. 6. Scheme of hydroxide ion transport through an AEM. Reproduced with permission from ref. Copyright Springer 2014.
Fig. 7
Fig. 7. Scheme of representative cationic functional groups used in AEMs.
Fig. 8
Fig. 8. Schematic representation for (a) main chain type, (b) comb-shaped, (c) side chain type with multi-cationic head groups, and (d) hyper-branched AEMs.
Fig. 9
Fig. 9. Conductivity as a function of water uptake (WU) from liquid water of AEMs at room temperature (RT, 20–30 °C), 60 °C, and 80 °C. Reproduced with permission from ref. . Copyright American Chemical Society 2018.
Fig. 10
Fig. 10. (a) AEM hydroxide conductivity vs. temperature, and (b) hydroxide conductivity and water uptake of selected AEMs (with conductivities ≥150 mS cm−1). (c) Fraction of AEMs at different levels of (c) IEC range and (d) water uptake range. Water uptake values are given in different temperatures. Represented data and the underlying sources are given in Table S1 (ESI†).
Fig. 11
Fig. 11. Selected high performance (polarisation curves) of AEMWEs reported in the literature. KOH solutions are fed to the AEMWEs. PGM-catalysts were used in these studies.
Fig. 12
Fig. 12. Performance summary of AEMWEs: comparison of current densities achieved at cell voltages in the 1.5–2.4 V range, extracted from different polarisation curves with different feed types. Yellow and orange areas represent AEMWE performance data with (KOH addition) and without liquid electrolyte (pure water). Operating temperature ranges from 22 to 90 °C. Main design parameters, operating conditions and underlying sources are provided in Tables S3 and S4 (ESI†).
Fig. 13
Fig. 13. Selected AEMs and their operando performance stability data reported in the literature. AEMs under development (research in universities) are marked in red, and commercially available AEMs are marked in blue, for (a) pure water fed (no liquid electrolyte) and (b) liquid electrolyte. AEMs and their operando performance stability of selected AEMWE cells showing the long-term tests (c) and a zoom in into the 0–600 h range (d). Main design parameters, operating conditions and underlying sources are provided in Tables S3–S5 (ESI†).
Fig. 14
Fig. 14. Elongation [%] vs. tensile strength [MPa]. In case there is a range of values, the lower value was considered. Represented data and underlying sources are given in Table S1 (ESI†).
Fig. 15
Fig. 15. Different degradation mechanisms reported for cationic functional groups in AEMs.
Fig. 16
Fig. 16. Ex situ alkaline stability data of AEMs. The stability is reported as % QA cation remaining vs. time of stability test, performed in various base concentrations at constant temperatures of (a) 60 °C, (b) 80 °C, and (c) ≥85 °C. Represented data and underlying sources are given in Table S2 (ESI†).
Fig. 17
Fig. 17. The evolution of platinum and iridium price (US$ g−1) in the period of 2000–2020.
Fig. 18
Fig. 18. Polarisation curves for hydrogen evolution/oxidation on Pt(hkl), with scan rate of 20 mV s−1, in (a) acid and (b) alkaline media. Reproduced with permission from ref. (copyright MDPI 2020), 410 (copyright American Chemical Society 1997), (copyright RSC 1996).
Fig. 19
Fig. 19. LSV curves of (a) Pt(111), (b) Pt(100) in 0.1 M HClO4 with scan rate of 50 mV s−1. (c) Plot of the current density at +1.65 V vs. RHE (j+1.65V) in the LSV as a function of the applied potential. Reproduced with permission from ref. . Copyright Wiley 2019.
Fig. 20
Fig. 20. Comparison of OER overpotentials at 10 mA cm−2 for the ten most promising catalysts in each category (Ir-, Ru- and PGM-free based catalysts) in acidic media. (a: the overpotential @ 20 mA cm−2). Reproduced with permission from ref. . Copyright Elsevier 2020.
Fig. 21
Fig. 21. Schematic representation of the generation of Ti/TiO2-NTs/PbO2. Reproduced with permission from ref. . Copyright Royal Society of Chemistry 2021.
Fig. 22
Fig. 22. OER activities of the Mn-oxide electrode compared with the ones from Pt, Ir and Ru. Reproduced with permission from ref. Copyright American Chemical Society 2010.
Fig. 23
Fig. 23. SEM images of dandelion-like- (a and b) and urchin-like α-MnO2 (c and d). Reproduced with permission from ref. . Copyright Elsevier 2017.
Fig. 24
Fig. 24. Schematic representation for the preparation of the metal-ion (Fe, V, Co, Ni)-doped MnO2 ultrathin nanosheet/CFP composite. Reproduced with permission from ref. , Copyright Wiley 2017.
Fig. 25
Fig. 25. Process of the surface-guided formation of ammo@MnO2via the galvanic replacement reaction. Reproduced with permission from ref. Copyright Wiley 2017.
Fig. 26
Fig. 26. Steady-state polarisation curves for overall water splitting of Ni foam, commercial Pt/C, compact MoO2, and porous MoO2 in a two-electrode configuration. (b) Demonstration of water-splitting device. (c) Chronopotentiometric curve of water electrolysis for porous MoO2. Reproduced with permission from ref. Copyright Wiley 2016.
Fig. 27
Fig. 27. Polarisation curves toward the OER for as-grown MoO2+OH (7 h case), MoO2–x+OH (9 h case), commercially available MoO2, and IrO2/C electrocatalysts on GCE in 1 M KOH electrolyte. Reproduced with permission from ref. . Copyright American Chemical Society 2020.
Fig. 28
Fig. 28. NTA electrode preparation procedures. (b and c) Cyclic voltammograms of NTA electrodes in 100 mM KPi buffer at pH 7.2. Reproduced with permission from ref. . Copyright American Chemical Society 2018.
Fig. 29
Fig. 29. Pourbaix diagrams (potential-pH) calculated for the nickel/water and cobalt/water system. Reproduced with permission from ref. . Copyright Wiley 2018.
Fig. 30
Fig. 30. Relation between observed OER activities of perovskites (ABO3) and the number of eg symmetry electrons of the transition metal (B in ABO3). Reproduced with permission from ref. . Copyright AAAS 2011.
Fig. 31
Fig. 31. Schematic structure of CaTiO3 perovskite. Reproduced with permission from ref. . Copyright Wiley 2019.
Fig. 32
Fig. 32. (a) ABO3 perovskite structure. (b) Schematic illustration of the preparation process of SNCF-NR by electrospinning. (c) Scanning electron microscopy (SEM) image of as-spun precursory polymer nanofibers before calcination. (d and e) Low/high-magnification SEM images of SNCF-NR. (f) Refined XRD pattern of SNCF-NR. Observed (purple circles), calculated (red solid line), and differences (orange line, bottom) are presented. Reproduced with permission from ref. . Copyright Wiley 2017.
Fig. 33
Fig. 33. Schematic presentation of the preparation route leading to perovkite-grapheneoxid composite with special morphology. Reproduced with permission from ref. . Copyright Elsevier 2014.
Fig. 34
Fig. 34. (a) Schematic of the atomic structure and charge transfer effect for K-MoSe2 and LSC/K-MoSe2. Complementary charge transfer in LSC/K-MoSe2 can modulate the electronic structure of MoSe2, increasing the 1T-MoSe2 ratio in the heterostructure. (b) Charge transfer from K and LSC to MoSe2 in the optimised LSC/K-MoSe2 heterostructure. Reproduced with permission from ref. . Copyright Nature Publishing 2021.
Fig. 35
Fig. 35. Design of RP/SP composites. Schematic for the RP/SP composites showing RP and SP phase crystal structures. The unit cell of the SP structure is duplicated along the c-axis, to suggest a difference in the material's dimensionality, that is, 2D for RP versus 3D for SP. Reproduced with permission from ref. . Copyright Wiley 2021.
Fig. 36
Fig. 36. Normal and inverse spinel structures. (a) MgAl2O4 normal and (b) MgGa2O4 inverse ground state atomic configurations. In each case the unit cell is shown by solid black lines. Octahedral and tetrahedral atomic coordination environments are also identified by the coordination polyhedra in each case. Reproduced with permission from ref. . Copyright Nature Publishing 2020.
Fig. 37
Fig. 37. (a) Electrochemical oxygen evolution activity at a fixed overpotential of 360 mV for the varying synthesis methods and compositions of mixed metal oxide electrocatalysts. (b) Geometric area-normalised polarisation (scan rate = 1 mV s−1) data of mixed Ni–Fe oxide catalysts (synthesised by the EISA method) showing the highest activity for 10 mol % Fe oxide. Reproduced with permission from ref. Copyright American Chemical Society 2012.
Fig. 38
Fig. 38. Plot of the overpotential as a function of time at current densities of 10 mA cm−2 (black) and 100 mA cm−2 (red) measured in 1 M KOH for films deposited at 50 °C (dashed lines) and 103 °C (full lines). Reproduced with permission from ref. . Copyright American Chemical Society 2020.
Fig. 39
Fig. 39. High-resolution images of spinel-type CoV2–xFexO4 (x = 0–2) nanoparticles: (A) CoFe2O4, (B) CoFeVO4, and (C) CoV2O4. Reproduced with permission from ref. . Copyright American Chemical Society 2018.
Fig. 40
Fig. 40. Schematic synthesis of cubic (a) and tetragonal (b) spinel phases, involving two steps of oxidation precipitation and crystallisation. Reproduced with permission from ref. . Copyright Nature Publishing 2015.
Fig. 41
Fig. 41. Structural analysis of the synthesised nanocrystalline spinels. (a and b) Rietveld- refined XRD patterns of CoMnO-B (a) and CoMnO-P (b) with experimental data (red dots), calculated profiles (black line), allowed Bragg diffraction positions (vertical bars) and difference curve (blue line). (c and d) Schematic representation of tetragonal (c) and cubic (d) spinels. Reproduced with permission from ref. . Copyright Nature Publishing 2015.
Fig. 42
Fig. 42. (a) 2D map of theoretical overpotentials η for the doped 101̄4 surface of β-CoOOH as function of ΔGO − ΔGOH and ΔGOH. The individual values of η are indicated in brackets. Improvement in activity relative to undoped surface is obtained in the case of Ni with η = 0.36 V and Fe with 0.43 V. Reproduced with permission from ref. . Copyright American Chemical Society 2013.
Fig. 43
Fig. 43. OER activity on various spinels as a function of eg occupancy of the active element at octahedral site. Reproduced with permission from ref. . Copyright Wiley 2017.
Fig. 44
Fig. 44. (a) Scheme of synthesis route for MCFO NS/IF. (b and c) XRD patterns of MCFO NS/IF, MFO NS/IF and CFO NP/IF. (d) The chronoamperometric plot of OER on MCFO NS/IF at 1.49 V versus RHE in 1.0 M KOH for 1000 h (25 °C). Reproduced with permission from ref. . Copyright Wiley 2021.
Fig. 45
Fig. 45. Schematic illustration of the synthesis of NiCo2O4 and Ni0.33Co0.67S2 nanowires, and the utilisation of these homologous Ni–Co based nanowires as OER and HER catalysts for water splitting. Reproduced with permission from ref. . Copyright Wiley 2015.
Fig. 46
Fig. 46. (a) Schematic illustration of the formation process of R-TMO with a necklace-like multishelled hollow structure for water splitting. (I) The absorption of metal ions on the carbon, (II) calcination of the absorbed carbon, and (III) reduction of the TMO to obtain R-TMO with a necklacelike multishelled hollow structure. (b) Schematic illustration of creating oxygen vacancy defects on the surface of NCO after reduction. Reproduced with permission from ref. . Copyright American Chemical Society 2018.
Fig. 47
Fig. 47. (a) Schematic illustration of the formation of AP-CoFe2O4 through the coprecipitation method followed by thermal treatment under N2 to obtain CoF-1, CoF-2, and CoF-3. (b) Field-emission (FE) SEM image of AP-CoFe2O4. (c) XRD patterns of CoF-1, CoF-2, and CoF-3 NPs. Reproduced with permission from ref. . Copyright Wiley 2020.
Fig. 48
Fig. 48. (a) LSV polarisation curves for the HER. (b) Overpotential values reach a current density of 10 mA cm−2. (c) Tafel and (d) Nyquist plots of CoFe2O4 NPs for the HER recorded at 0.4 V versus RHE. (e) Chronoamperometric stability test for CoF-2 performed at 0.35 V versus RHE. Inset shows the LSV polarisation curves before and after stability tests. (f) Experimental and theoretical gas evolution at 0.764 V versus RHE for the HER of CoF-2. Reproduced with permission from ref. . Copyright Wiley 2020.
Fig. 49
Fig. 49. Typical structures of selected Mn-oxides and oxyhydroxides. Reproduced with permission from ref. . Copyright ACS 2016.
Fig. 50
Fig. 50. Typical structure of Brucite type Ni(OH)2 and hydrotalcite-like NiFe LDH. Reproduced with permission from ref. . Copyright Wiley 2016.
Fig. 51
Fig. 51. Transition metal (oxy)hydroxides and LDHs OER performance trends. (a) Activity trend as effective turnover frequencies (TOF) at overpotential η = 350 mV and based on the total mass of the electrodeposited catalyst films calculated from quartz crystal microbalance measurements and ordered based on the atomic number of the host/primary metal cation. Electrolyte: 1 M KOH. Reproduced from ref. . Copyright American Chemical Society 2015. (b) Intrinsic activity trend as OER overpotentials at ECSA-normalised current densities of 0.1 mA cm−2ECSA for crystalline transition metal LDHs. Electrolyte: 0.1 M KOH. Reproduced from ref. . Copyright Wiley 2021. (c) Activity stability factor (ASF) trend for Fe containing (red bars) and Fe-free (blue bars) transition metal hydroxy oxide clusters. The Fe containing catalysts were obtained by adding Fe nitrate to the 0.1 M KOH electrolyte. Reproduced with permission from ref. . Nature Publishing 2020.
Fig. 52
Fig. 52. NiFe (oxy)hydroxide active site and OER mechanism by DFT calculations. (a) Proposed OER pathway involving the HO*, O* and HOO* intermediates and with a Fe atom site that was substituted in the (011̄2) surface of γ-NiOOH as the active site. Reproduced with permission from ref. . American Chemical Society. (b) A second proposed OER mechanism and intermediates on the H-saturated O-bridged Ni–Fe site as active site at the (01–10) surface of γ-NiFe LDH. The reaction centers are highlighted by large dotted white circles, the vacancy by a small pink dashed circle. The magnetic moments of Ni and Fe during OER are also given. Reproduced with permission from ref. . Copyright Nature Publishing 2020. (c) A third example of proposed mechanism for OER on Ni1−xFexOOH catalyst. Blue ovals highlight the synergistic role of Ni and Fe sites in forming key reaction intermediates. Reproduced with permission from ref. . Copyright American Chemical Society 2018.
Fig. 53
Fig. 53. A comparison of the OER activity of commercially available OER electrode materials like RuO2, IrO2 (highlighted in red), steel based OER materials (highlighted in blue), transition metal layered double hydroxides (pink), oxyhydroxides (black) and other state of the art OER electrocatalysts (green). The displayed OER materials are unmodified AISI 316 steel (1), unmodified AISI 302 steel (2),ex situ modified steel 304 (3),ex situ modified steel 304 (4),ex situ modified steel 316 (5),ex situ modified steel 302 (6), RuO2 (7), RuO2 (8), RuO2 nanoparticles (9), IrO2 (10), NiCeO on gold (11), CoFe LDH (12), gelled FeCoW oxyhydroxide (13), Co5Fe3Cr2 (oxy)hydroxide (14), CoCuFeMo(oxy)hydroxide (15), Ni6Fe2Cr LDH (16), NiFeCe LDH (17),ex situ modified steel 304 mesh (18), NiFeMo (19), Porous monolayer NiFe LDH (20), NiFe LDH (21), CoFe LDH (22),ex situ modified steel S235 (23), PrBaCoO3 (24), FeCoW oxyhydroxide (25).
Fig. 54
Fig. 54. (a–c) HER activity of TMPs. (A) Linear sweep voltammograms (LVSs) per geometric area of representative TMP electrodes. The HER activity of Pt nanoparticles (NPs) is displayed for comparison. (d) Activity volcano for the HER showing the geometric current density from (A) at an overpotential of Z = 100 mV as a function of hydrogen adsorption free energy (DGH). (e) Activity volcano for the HER showing the ECSA normalised current density from (B) at Z = 100 mV as a function of DGH. (f) Activity volcano for the HER showing the average TOF from (C) at Z = 100 mV as a function of DGH. Reproduced with permission from ref. . Copyright RSC 2015.
Fig. 55
Fig. 55. Linear polarisation curves with iR correction for CoB catalyst compared with Co metal in (a) pH 1 (0.1 M HClO4), (b) pH 4.4 (0.5 M KH2PO4) and (c) pH 9.2 (0.4 M K2HPO4) obtained with scan rate of 10 mV s−1. (d) Plot of overpotential (at 2 mA cm−2) and exchange current density values as a function of pH values of the solution used to test the CoB catalyst. Reproduced with permission from ref. . Copyright Wiley 2019.
Fig. 56
Fig. 56. (a and b) DFT results for Pd–B alloy formation energy convex hull and hcp Pd2B crystal.22 (c) Schematic representation of the synthetic route for Pd2B NS/C. (d) HRTEM image of Pd2B NS. The inset is the magnified image of the rectangular region in (d). (e) STEM image and STEM-EDS element mapping Pd2B. (f) XRD patterns illustrating the phase transformation from Pd (fcc) to Pd2B (hcp) at different reaction temperatures. Reproduced with permission from ref. . Copyright RSC 2019.
Fig. 57
Fig. 57. Schematic representation of the use of RuB2 as an anode and cathode in a water electrolysis approach. Reproduced with permission from ref. . Copyright American Chemical Society 2020.
Fig. 58
Fig. 58. Linear sweep polarisation curves of different materials recorded in 0.5 M H2SO4 (current density normalised with the electrode's geometric surface area). (b) Plots of the lattice parameter c and the overpotential (at 150 mA cm−2 current density) as a function of molybdenum content. (c) Linear sweep polarisation curves showing the high current density behaviours of Cr0.4Mo0.6B2 and 20% Pt/C. (d) Tafel plots of Cr0.4Mo0.6B2 and 20% Pt/C. Reproduced with permission from ref. . Copyright Wiley 2020.
Fig. 59
Fig. 59. (a) Polarisation curves (10th) of MoB and Mo2C at pH 0 and 14. Scan rate = 1 mV s−1. MoB, pH 0, 2.5 mg cm−2 (- - - -); MoB, pH 14, 2.3 mg cm−2 (—●—); Mo2C, pH 0, 1.4 mg cm−2 (—); Mo2C, pH 14, 0.8 mg cm−2 (—▲—). The iR drop was corrected. (b) Time dependence of catalytic currents during electrolysis over 48 h for MoB and Mo2C at pH 0 and 14. The iR drop was corrected. MoB, pH 0, −195 mV (- - - -); MoB, pH 14, −200 mV (—●—); Mo2C, pH 0, −195 mV (—); Mo2C, pH 14, 0.8 mg cm−2 (—▲—). Reproduced with permission from ref. . Copyright Wiley 2012.
Fig. 60
Fig. 60. The polarisation curves of nanostructured Mo2C/CNT, Mo2C/XC, bulk Mo2C, Mo metal, Pt/C and CNT in 0.1 M HClO4. Reproduced with permission from ref. . Copyright RSC 2013.
Fig. 61
Fig. 61. (a) Schematic illustration of Mo2C-, Mo2N-, and MoS2-nanoparticles anchored on carbon nanotubes (in turn) attached to graphene and the corresponding discharging of H+ ions leading to HER. (b) Polarisation curves derived from the nanoparticle-CNT-graphene hybrid electrocatalyst. Measurements were performed in 0.5 M H2SO4. Reproduced with permission from ref. . Copyright American Chemical Society 2014.
Fig. 62
Fig. 62. Schematic representation of biochar formation. Reproduced with permission from ref. . Copyright Wiley 2018.
Fig. 63
Fig. 63. (A) Schematic representation of synthesis of Mo2C nanostructures. (B) TEM image (inset: scale bar = 25 nm) and (C) the powder XRD pattern of Mo2C derived from biochar. Reproduced with permission from ref. . Copyright Wiley 2018.
Fig. 64
Fig. 64. Schematic presentation of the synthesis of Rh2C. Reproduced with permission from ref. . Copyright American Chemical Society 2020.
Fig. 65
Fig. 65. (a) The HER polarisation curves of 20 wt% Rh2C/C (red), Pt/C (black), and Rh/C (blue). The data were recorded in a 1.0 M KOH electrolyte with a scan rate of 50 mV s−1. (b) The 3-state free energy diagram for HER. The structural models show the OH* pre-covered surfaces used for calculations. The blue spheres are hydrogen atoms, and the gray spheres are oxygen atoms. Reproduced with permission from ref. . Copyright American Chemical Society 2020.
Fig. 66
Fig. 66. (a) Lowest energy 2-D phase diagram by projecting 3-D diagram onto ΔμC − 1/d axis. (b) Inverse average particle size vs. temperature for experimental reports. For clarity, plasma-based syntheses were omitted from Fig. 66b. (c) Stacked bar graph for percentage of experimental reports at given average particle sizes. Reproduced with permission from ref. . Copyright American Chemical Society 2020.
Fig. 67
Fig. 67. (a) Lab X-ray powder diffraction patterns of Co3Mo3N, CoMoN2, and δ-MoN. Asterisk marks the impurity peak of cobalt metal. (b) Four-layered crystal structure of CoMoN2. (c) Rietveld refinements of neutron diffraction for CoMoN2 showing observed data (black line), calculated pattern (red line) and difference curve (bottom line). Lab X-ray diffraction data (blue line) in same Q (= 2π/d) range between 2 and 7 Å−1 do not clearly show superstructure peaks such as the 013 and 015 reflections which are intense in neutron diffraction data. Reproduced with permission from ref. . Copyright American Chemical Society 2013.
Fig. 68
Fig. 68. Electrochemical measurements. (a) HER polarisation curves of the samples in 1.0 M KOH. (b) Corresponding Tafel plots. Reproduced with permission from ref. . Copyright Wiley 2020.
Fig. 69
Fig. 69. Electrochemical characterisation for the prepared catalysts. (a) Polarisation curves. (b) Stability measurement. Reproduced with permission from ref. . Copyright RSC 2021.
Fig. 70
Fig. 70. Synthesis and microscopic characterisation of the as-prepared NiMoN@NiFeN catalyst. (a) Schematic illustration of the synthesis procedures for the self-supported 3D core–shell NiMoN@NiFeN catalyst. (b–d) SEM images of (b) NiMoN and (c and d) NiMoN@NiFeN at different magnifications. Reproduced with permission from ref. Copyright Nature Publishing 2019.
Fig. 71
Fig. 71. (A) TEM image and (B) EDX spectrum of Ni2P nanoparticles. (C) HRTEM image of a representative Ni2P nanoparticle, highlighting the exposed Ni2P(001) facet and the 5.2 Å lattice fringes that correspond to the (010) planes. (D) Proposed structural model of the Ni2P nanoparticles. Reproduced with permission from ref. Copyright 2013 American Chemical Society.
Fig. 72
Fig. 72. (A) Polarisation data for three individual Ni2P electrodes in 0.5 M H2SO4, along with glassy carbon, Ti foil, and Pt in 0.5 M H2SO4, for comparison. (B) Corresponding Tafel plots for the Ni2P and Pt electrodes. Reproduced with permission from ref. Copyright 2013 American Chemical Society.
Fig. 73
Fig. 73. (a) SEM image showing the uniformly distributed Ni5P4@NiCo2O4 nanoflakes on graphene/Ni foam. (b) High-magnification SEM image of Ni5P4@NiCo2O4 nanoflakes. (c) Low-magnification TEM image and (d) corresponding energy dispersive spectroscopy (EDS) elemental mapping images of Ni5P4@NiCo2O4 nanoflakes. (e) High-resolution TEM image showing that nanometric Ni5P4 clusters are nested on the nanoflakes. (f) HRTEM image of one single Ni5P4 nanocluster. (g) HRTEM image and corresponding elemental mapping images of Ni5P4@NiCo2O4. Reproduced with permission from ref. Copyright Wiley 2018.
Fig. 74
Fig. 74. Synthesis and characterisation of catalysts. (A) Synthesis procedure. (B) XRD patterns. (C) SEM image. (D) TEM image. (E and F) TEM EDS elemental mapping images of Ni and P; inset: EDS spectrum. (G) High-resolution TEM image; white circles mark the possible Pv areas. (H) SAED of the white circle area in panel (D). (I) AFM image; insets: height distribution curves; note that (C–I) all show images/data for v-Ni12P5. Reproduced with permission from ref. Copyright Wiley 2020.
Fig. 75
Fig. 75. Electrochemical measurements. (A) Polarisation curves. (B) Tafel plots. Reproduced with permission from ref. Copyright Wiley 2020.
Fig. 76
Fig. 76. Polarisation curve for hydrogen evolution on Pt, daihope C-support, and MoS2 cathodes. The potentials are measured with respect to a carbon-supported Pt anode in a proton exchange membrane electrode assembly. (Right) STM images of MoS2 nanoparticles on modified graphite. Reproduced with permission from ref. Copyright 2005 American Chemical Society.
Fig. 77
Fig. 77. Required applied potential to obtain a zero-reaction energy for the rate determining Volmer step from [MX2]H to [MX2]H2. Reproduced with permission from ref. Copyright 2018 American Chemical Society.
Fig. 78
Fig. 78. Synthesis and structural characterisations. (a) Schematic illustration of the synthetic procedures of NiSxSe1−x nanocomposites. The scale bars for SEM images are 2 μm. (b) TEM and HRTEM images of NiS0.5Se0.5. (c) Atomic-resolution HAADF-STEM image (inset shows the corresponding schematic atom arrangement). (d) HAADF-STEM and EDS mapping images of NiS0.5Se0.5 from the cross-section view. Reproduced with permission from ref. . Copyright Wiley 2020.
Fig. 79
Fig. 79. Atomic structure of monolayer V-MoS2. (a) Schematic of V–MoS2 with VS2 and VSn units and hydrogen evolution on V–MoS2via basal-plane activation. (b) ADF-STEM image at 9.3% V concentration, indicating a d-spacing of 0.27 nm for 2H–MoS2 and the corresponding electron-diffraction-pattern of (101–0) plane in the inset. (c) STEM image of white square region in (b) and simulated image and (d) the corresponding intensity profile. (e) False-coloured ADF-STEM image of monolayer V-MoS2 with Mo-substituted V atom (VMo), sulphur-vacancy next to V atom (V-vacs), Mo atom (MoMo), two S atoms (2S), and sulphur-vacancy next to Mo atom (Mo-vacs). (f) Atomic % distribution of VMo, V-vacs, and Mo-vacs as a function of molar ratio of V to Mo precursor. Statistical analysis data were obtained from false-coloured ADF-STEM images. Reproduced with permission from ref. Copyright Wiley 2021.
Fig. 80
Fig. 80. The schematic fabricating processes of MoSe2–NiSe2–CoSe2 nanorods on the PNCF surface. Reproduced with permission from ref. Copyright Elsevier 2020.
Fig. 81
Fig. 81. Schematic illustration of synthesis of Ni2P–NiSe2/CC heterostructure catalyst. Reproduced with permission from ref. Copyright Elsevier 2020.
Fig. 82
Fig. 82. Schematics of the 1T0.72-MoS2@NiS2 and 1T0.81-MoS2@Ni2P synthesis steps. Reproduced with permission from ref. Copyright Nature Publishing 2021.
Fig. 83
Fig. 83. The electrocatalytic HER performance of 1T0.72-MoS2@NiS2 and 1T0.81-MoS2@Ni2P hybrid materials in comparison with MoS2, carbon cloth and Pt/C. (a) LSV curves in 1 M KOH. (b) LSV curves in 0.5 M H2SO4. Reproduced with permission from ref. Copyright Nature Publishing 2021.
Fig. 84
Fig. 84. Schematic presentation of the synthesis steps leading to P-CoNi2S4 YSS particles and TEM images of these particles. Reproduced with permission from ref. Copyright Wiley 2021.
Fig. 85
Fig. 85. Schematic illustration of the fabrication procedure of SS-based electrodes. Reproduced with permission from ref. . Copyright Elsevier 2019.
Fig. 86
Fig. 86. The HER activity of stainless steel 304 was enhanced in a two-step activation process comprising chemical oxidation (KOH + NaClO). Reproduced with permission from ref. . Copyright American Chemical Society 2020.
Fig. 87
Fig. 87. Fe2O3//NiO nanocrystals were formed on the surface of corroded AISI 304 steel and significantly improved the capability of the material to act as an OER electrode. Reproduced with permission from ref. Copyright American Chemical Society 2017.
Fig. 88
Fig. 88. Schematic of the formation mechanism of RuNiFe-O@SS electrocatalyst. Reproduced with permission from ref. Copyright RSC 2021.
Fig. 89
Fig. 89. Schematic representation of the fabrication process of the CESS. Reproduced with permission from ref. . Copyright RSC 2017.
Fig. 90
Fig. 90. Digital photos (a and d) and SEM images (b, c, e and f) of SSM-Pristine (a–c) and SSM-Cathodisation (d–f). Reproduced with permission from ref. . Copyright Elsevier 2020.
Fig. 91
Fig. 91. An OER-based current density of j = 100 mA cm−2 was achieved at an overpotential of η = 173 mV in 1 M KOH. Reproduced with permission from ref. . Copyright Elsevier 2020.
Fig. 92
Fig. 92. (a).7Li MAS NMR spectrum of (as-prepared) Co-300/Li recorded at 11.7 T and a MAS frequency of 25.0 kHz, showing a broad, asymmetric spinning sideband pattern characteristic of a strong electron-Li dipolar interaction. (b). Averaged chronopotentiometry curve based on 53 samples of the sample series Co-300/Li (blacksquares) with standard error bars (magenta). Reproduced with permission from ref. . Copyright American Chemical Society 2018.
Fig. 93
Fig. 93. Faradaic efficiency measurements of the OER on Ni42 (sample 22) in a sulphuric acid/Fe2O3 suspension during chronopotentiometric measurements at 30 mA cm−2. Electrode area: 2 cm2. The areas where the FE measurements begin and end are highlighted. (b) Correlation of oxygen evolution (black dotted curve: measurement 1; blue dotted curve: measurement 2) with the charge passed through the electrode system (the red line corresponds to 100% faradaic efficiency). Reproduced with permission from ref. . Copyright Royal Society of Chemistry 2020.
Scheme 4
Scheme 4. A cyclic process ensures electrocatalytically initiated splitting of water mediated through two different oxide species. Reproduced with permission from ref. . Copyright Royal Society of Chemistry 2020.
Fig. 94
Fig. 94. Schematic of PEDOT-based HER electrode (left side). Long-term performance of PEDOT–PEG on Goretex/Au in 1 M H2SO4 under N2 at −0.35 V vs. SCE. Reproduced with permission from ref. . Copyright 2010 Wiley.
Fig. 95
Fig. 95. Steps: (1) synthesis of melamine formaldehyde (MF) polymer with nickel nitrate and carbon particles; (2) pyrolysing metal-salt/MF-polymer precursor; and (3) acid leaching of the pyrolysed samples. Materials: (a) carbon particles (black dot); (b) carbon particles covered with MF polymer (yellow sphere) and nickel nitrate (green dot); a sample of pyrolysed N/C material that was not subjected to acid leaching was also prepared for a reference and was termed N/C–NiOx (c) N/C–NiOx catalyst (grey dot, NiOx); and (d) N/C catalyst. Reproduced with permission from ref. . Copyright Nature Publishing.
Fig. 96
Fig. 96. Schematic illustration of the synthesis of the monolith 3D NiDPCC. Reproduced with permission from ref. . Copyright 2010 Royal Society of Chemistry (RSC).
Fig. 97
Fig. 97. (a) Schematic illustration of the preparation process for the NPMC foams. An aniline (i)–phytic acid (ii) complex (iii) is formed (for clarity, only one of the complexed anilines is shown for an individual phytic acid), followed by oxidative polymerisation into a three-dimensional PANi hydrogel crosslinked with phytic acids. For clarity, only a piece of the two-dimensional network building block is shown in the enlarged view under the three-dimensional PANi hydrogel and only a piece of the two-dimensional NPMC network building block is shown in the enlarged view under the three-dimensional NPMC). Reproduced with permission from ref. Copyright Nature Publishing 2015.
Fig. 98
Fig. 98. Preparation process of N,P-doped 3D porous graphitic carbon. Reproduced with permission from ref. . Copyright Wiley 2016.
Fig. 99
Fig. 99. Illustration of charge-transfer process and ORR/OER/HER on C60-SWCNTs. Reproduced with permission from ref. . Copyright American Chemical Society 2019.
Fig. 100
Fig. 100. Fabrication of the 3D g-C3N4 NS-CNT porous composite. Reproduced with permission from ref. . Copyright Wiley 2014.
Fig. 101
Fig. 101. (left) SEM micrographs of unsupported IrO2 nanoparticles used at the anode of PEM water electrolysis cells. (right) In situ cyclic voltammograms recorded on IrO2 at the anode of a PEM water electrolysis cell, at different scan rates. Reproduced with permission from ref. . Copyright Elsevier 2016.
Fig. 102
Fig. 102. Overview of the protocol used for the synthesis of SO-IrNi@IrOx and DO-IrNi@IrOx hybrid core–shell nanoparticle catalysts. Reproduced with permission from ref. . Copyright. RSC 2014.
Fig. 103
Fig. 103. (a and b) sweep voltammetry and catalytic oxygen evolution reaction (OER) activities of stepwise oxidised (SO) IrNix and directly oxidised (DO) IrNix core–shell nanoparticles, compared to pure Ir nanoparticles. (c) Ir mass-based activities and (d) specific activities at 0.25 V overpotential. Reproduced with permission from ref. . Copyright RSC 2014.
Fig. 104
Fig. 104. (a) Volcano plots of j0vs. M–H bond energy. (b) SEM micrographs of nano-Pt/C electrocatalysts for the HER. (c) Cyclic voltammograms measured (a) on metallic Pt in 1 M H2SO4; (b) in situ at the cathode of a PEM water electrolysis cell. Reproduced with permission from ref. Copyright Elsevier 2014.
Fig. 105
Fig. 105. Various routes for preparing PEMFC, and PEMWE Pt/C catalyst and catalyst ‘inks’.
Fig. 106
Fig. 106. (a) SEM photograph showing the cross-section of the Ni42/Pt interface (Pt thickness ∼800–900 nm); the Pt loading is 1.8 mg cm−2. (b) comparison of the HER performances of Pt and Ni42SoPt at pH = 0. Reproduced with permission from ref. . Copyright Wiley 2019.
Fig. 107
Fig. 107. (a) General chemical formulae of cobalt clathrochelates. (b) Cyclic voltammograms recorded on three different cobalt clathrochelates in acetonitrile (10 mV s−1). Complex 1: X = n-butane and R = cyclohexane; complex 2: X = F and R = methyl group; complex 3: X = n-butane and R = phenyl group; complex 4: X = F and R = phenyl group. Reproduced with permission from ref. Copyright Wiley 2008.
Fig. 108
Fig. 108. Overview of multi-steps processes used for CLs, CCMs, and MEAs manufacturing for PEM fuel cells.
Fig. 109
Fig. 109. Photograph of a catalytic ink printer used to spray catalytic inks onto PFSA membranes (batch process, lab-scale). Reproduced with permission from Paris-Saclay University.
Fig. 110
Fig. 110. (a) Sono-Tek Ultrasonic Spray system—‘ExactaCoat’; (b) representation of the vibrating nozzle cross-section; (c) mist formation of the liquid schematic; (d) CCMs for PEMFC, DMFC, and PEMWE manufactured by the Sono-Tek system; (e) representation of nanoparticle de-agglomeration via the ultrasonic-spray method vs. the air spray method. Reproduced with permission from ref. . Copyright MDPI 2019.
Fig. 111
Fig. 111. (a) Comparison of the electrochemical OER properties of sample Co-300 with sample Ir/Ru and sample Depos-30 in pH 13 (b) and pH 7. (c) SEM micrograph of a FIB machined cross section of sample Co-300. (d) A diagram represents difference between sample Co-300 (electro oxidation) and sample Depos-30 (electrodeposition) as a function of OER properties. Reproduced with permission from ref. . Copyright RSC 2016.
Fig. 112
Fig. 112. Comparison of the 316L SS electrodes OER (test conducted at E = +1.75 V vs. RHE) after accelerated activation and the in situ activated 316L SS electrodes OER in 5.0 M LiOH at T = 25 °C (A). SEM of the surface of the 316L SS electrode activated (B). Reproduced with permission from ref. . Copyright Elsevier 2019.
Fig. 113
Fig. 113. A schematic illustration of the electrodeposition of CoFeWOx on NFs (a), In 1.0 M KOH aqueous electrolyte, catalytic output of catalysts deposited on glassy carbon electrodes (GCEs) for OER in three-electron configuration (b). The electrolyser was tested for stability at 100 mA cm−2 in 1.0 M KOH electrolyte. During electrolysis, the elemental preservation of Co, Fe, and W in FeCoWOx/NiF (c). Reproduced with permission from ref. . Copyright Wiley 2020.
Fig. 114
Fig. 114. The formation of NiCo2S4 nanowire arrays on Ni foam and their morphology are depicted schematically. (a) Ni foam substrate, (b) in situ growth of NiCo2(Co3)1.5(OH)3 nanowire arrays on Ni foam (1st step), (c) hydrothermal anion exchange reaction with full growth of hierarchical NiCo2S4 nanowire arrays on Ni foam (2nd step) (a). OER polarisation curves (iR-corrected) of NiCo2S4 NW/NF, Ni3S2/NF, NiCo2O4/NF, NiCo2S4, bare Ni foam, and IrO2 with a scan rate of 10 mV s−1 (b). HER polarisation curves (iR-corrected) of NiCo2S4 NW/NF, Ni3S2/NF, NiCo2O4/NF, NiCo2S4, bare Ni foam, and Pt/C (40%) with a scan rate of 10 mV s−1. (c). Reproduced with permission from ref. . Copyright Wiley 2016.
Fig. 115
Fig. 115. Polarisation curves of Ni foam, NiMoO4, N-doped NiMoO4, Ni3N and N-doped NiMoO4/Ni3N heterostructure (a). LSV curves of N-doped NiMoO4/Ni3N//NiFe-LDH and commercial Pt/C//RuO2 systems in 1.0 M KOH solution without iR correction (b). Reproduced with permission from ref. . Copyright American Chemical Society 2020.
Fig. 116
Fig. 116. SEM image of Mo2N–Ni/NF(a). LSV curves with iR correction in 1 M KOH (b). LSV curves of Mo2N–Ni/NF before and after a 100 h aging test, and the SEM image of Mo2N–Ni/NF after a 100 h aging test (c). Volcano plot of i0 as a function of ΔGH* for Mo2N–Ni and some typical reported electrocatalysts (d). Reproduced with permission from ref. . Copyright American Chemical Society 2020.
Fig. 117
Fig. 117. Side view of the structure of Photosystem II, the water splitting enzyme of photosynthesis. This structure was determined by X-ray crystallography. With permission from ref. . Copyright AAAS 2004.
Fig. 118
Fig. 118. Molecular structure of cis,cis-[(bpy)2Ru(H2O)RuIIIORuIII(OH2)-(bpy)2]4+ (1). Reprinted with permission from ref. Copyright 1985. American Chemical Society.
Fig. 119
Fig. 119. Catalytic cycle for water oxidation by single-site ruthenium-based complexes via water nucleophilic attack (WNA), in 0.1 mol L−1 de HNO3. At pH 0 beyond the steps shown an extra pathway occurs, the [RuIV–OO]2+ is further oxidised to [RuV–OO]3+, the O2 release yields [RuIII–OH]3+ starting another cycle. Reprinted with permission from ref. . Copyright 2008 American Chemical Society.
Fig. 120
Fig. 120. Plots of E1/2 (V vs. NHE) vs. pH for the Ru(v/iv) and Ru(iv/ii) redox couples of [Ru(tpy)(bpm)(OH2)]2+ and for the Ru(iv/iii) and Ru(iii/ii) redox couples of [Ru(tpy)(bpy)(OH2)]2+ in aqueous solution (I) 0.1 M; T) 298 K; glassy carbon working electrode). Reprinted with permission from ref. Copyright 2008. American Chemical Society.
Fig. 121
Fig. 121. Electrolysis of [(4,4′-((HO)2P(O)CH2)2bpy)2RuII(bpm)–RuII(tpy)(OH2)]4+ on FTO at 1.8 V in 1.0 M HClO4: turnovers > 8900; rate) 0.3 s−1; current density ≈ 6.7 μA cm−2; Γ ≈ 7 × 10⁻¹¹ mol cm−2; (A) 1.95 cm2. For [(4,4′-((HO)2P(O)CH2)2bpy)2RuII(bpm)RuII-(Mebimpy)(OH2)]4+ on FTO at 1.8 V in 1.0 M HClO4: turnovers >28 000; rate) 0.6 s−1; current density ≈ 14 μA cm−2; Γ ≈ 7 × 10⁻¹¹ mol cm−2; (A) 1.95 cm2. Reprinted with permission from ref. Copyright Wiley 2009. American Chemical Society.
Fig. 122
Fig. 122. Left side. Structure of a dinuclear ruthenium complex with a negatively charged dicarboxylate ligand. Right side ORTEP view of the cation of the complex with thermal ellipsoids at the 50% probability level. H atoms are omitted for clarity. Reprinted with permission from ref. . Copyright ACS 2009.
Fig. 123
Fig. 123. Computed Reaction Pathway at pH 7.0 for the Generation of the Catalytically Active Species [RuIII(tPaO-κ-N2OPOC)(py)2]2−, 62−, from the Precursor Complex [RuII(H2tPa-κ-N3O)(py)2], 2. Redox potentials (E) in units of volts (V) vs. NHE, and ΔGs and ΔG‡ in units of kcal mol−1. Axial pyridyl ligands are omitted for clarity. Reprinted with permission from ref. . Copyright 2020 American Chemical Society.
Fig. 124
Fig. 124. Iridium catalysts for water oxidation. Reprinted with permission from ref. Copyright 2009. American Chemical Society.
Fig. 125
Fig. 125. General Procedure for the Synthesis of Hybrid Carbon Nanotubes-Based IrI-NHC Catalysts. Reprinted with permission from ref. . Copyright 2019. American Chemical Society.
Fig. 126
Fig. 126. Ball-and-stick representations of the molecular structure (left) and the Fe5O core structure (right) of [FeII4FeIII3-O)(μ-L)6]3+. Three penta-coordinated iron centres are bridged by an oxygen atom in μ3-fashion to form a triangle structure, and two hexa-coordinated iron centres are connected to the triangle structure by six Ls. Reprinted with permission from ref. . Copyright 2016. Nature Publishing.
Fig. 127
Fig. 127. Iron and Cobalt Metallocorroles tested and compared as WOCs in the study presented by Sinha et al. Reprinted with permission from ref. Copyright 2020. American Chemical Society.
Fig. 128
Fig. 128. Cyclic voltammograms (V vs. Ag/AgCl) of Nafion films, loaded (blue trace) and not loaded (black trace) with Fe(tpfc)Cl, on FTO electrodes in pH 10 phosphate–KOH buffer (scan rate of 100 mV s−1; catalyst loading 1.6 nmol cm−2). (b) Evolution of oxygen before (red) and after (blue) application of a potential of 1.5 V. Reprinted with permission from ref. Copyright 2020.American Chemical Society.
Fig. 129
Fig. 129. X-Ray structure of Na10[Co4(H2O)2(PW9O34)2] in combined polyhedral ([PW9O34] ligands) and ball-and-stick (Co4O16 core) notation. Co atoms are purple; O/OH2(terminal), red; PO4, orange tetrahedra; and WO6, gray octahedra. Hydrogen atoms, water molecules, and sodium cations are omitted for clarity. Reprinted with permission from ref. Copyright 2010. AAAS.
Fig. 130
Fig. 130. A structural representation of [CoII(Py5)(OH2)](ClO4)2] (left image). Pourbaix diagram for [CoII(Py5)(OH2)](ClO4)2]. Reprinted with permission from ref. Copyright 2011 RSC.
Fig. 131
Fig. 131. Water oxidation in the presence of Co(tpc)Py2 (red), Co(tdfc)Py2 (blue) and Co(tpfc)Py2 (green) in acetonitrile on adding 4.8% water. Reprinted with permission from ref. Copyright 2020. American Chemical Society.
Fig. 132
Fig. 132. The charge vs. time and current vs. time plots obtained from chronoamperometric measurements at an applied potential of 1.5 V for two hours to the Co(tpfc)Py2 -loaded Nafion film. Reprinted with permission from ref. Copyright 2020 American Chemical Society.
Fig. 133
Fig. 133. Structural model of [Ni4(H2O)2(SiW9O34)2]12− (M = Ni; W: blue, O: red; S: yellow; H: white; M: dark blue). Reprinted with permission from ref. . Copyright 2012 RSC.
Fig. 134
Fig. 134. The structure of [Ni(meso-L)]2+. Reprinted with permission from ref. . Copyright 2014 Wiley.
Fig. 135
Fig. 135. The aqueous speciation of a 1 : 1 copper(ii):bpy solution, observed by EPR. Reprinted with permission from ref. . Copyright 2012 Nature Publishing.
Fig. 136
Fig. 136. A proposed structure of the active site of the [FeFe] hydrogenase enzyme. Reprinted with permission from ref. Copyright 2007. American Chemical Society.
Fig. 137
Fig. 137. Long-run electrolysis experiments for both hydrogen evolution and oxidation carried out respectively at −0.3 and +0.3 V vs. NHE in H2SO4 (0.5 mol L−1) on a membrane electrode on which MWCNTs have been deposited and further Ni-functionalised. Reprinted with permission from ref. Copyright 2009 AAAS.
Fig. 138
Fig. 138. Reaction of [(PY5Me2)Mo(CF3SO3)]1+ with water to form [(PY5Me2)MoO]2+ and release H2. Reprinted with permission from ref. . Copyright 2010. Nature publishing.
Fig. 139
Fig. 139. [Co(Py3Me-Bpy)OH2] (PF6)2. Reprinted with permission from ref. . Copyright Wiley VCH.
Fig. 140
Fig. 140. One-step procedure of hydrothermal reaction for the synthesis of MoS2 nanosheets that were intercalated with PPD, DMPD, and TMPD. Reprinted with permission from ref. . Copyright Royal Society of Chemistry.
Fig. 141
Fig. 141. (A) Polarisation analyses of the three 100 kA Generation alkaline water electrolysers (AWE) of the Varennes experimental plant. A current of 100 kA corresponds to a current density of 0.25 A cm−2. (B) Long-term performance of the 100 kA cells of the Varennes experimental plant, monitored at a constant current of 100 kA (0.25 A cm−2). The electrolyte consists of 25% KOH at 70 °C. Reproduced from ref. with permission from Elsevier. (C) Typical PEMWE polarisation plots and corresponding individual voltage terms in the low current density range (0–1 A cm−2), for a temperature T = 90 °C and an overall pressure P = 1 bar. Reproduced from with permission from Wiley-Verlag. (D) Device enabling local current density and temperature measurement during PEMWE operation. Reproduced from ref. with permission from Elsevier.
Fig. 142
Fig. 142. (A) Example of Nyquist plots of electrochemical impedance spectroscopy (EIS) measured on an operating unit proton exchange membrane fuel cell (PEMFC) in H2/O2 operation at several constant current densities. The membrane electrode assembly (MEA) is based on Nafion 112 Catalyst Coated Membrane with anode/cathode loading of 0.4/0.4 mgPt cm−2 and Nafion/carbon weight ratio of approximately 0.8; frequency range of 100 kHz–0.01 Hz; peak-to-peak perturbation of ±0.02 A cm−2. (B) Corresponding, complex-plane impedance for MEAs with Nafion/Carbon weight ratio of 0.8 and 0.4, respectively. Data corrected for pure resistance and inductance calculated from model. The 45° region enables to evaluate the proton resistance using a transmission line model. Reproduced from ref. with permission from the Electrochemical Society. Cyclic voltammetry of a (C) Pt/C-based cathode of PEMWE and (D) an IrO2-based anode before and after operation. Reproduced from ref. with permission from CRC press. (E) Example of H2 crossover measurement through the membrane in a PEMFC, as a function of the temperature. Reproduced from ref. with permission from Elsevier. (F) (a) Schematic view of the high-pressure water electrolyser test cell, (b) applied current profile and (c) resulting pressure profile during the experiment, with θ the characteristic time constant of the system, defined by the fraction of its permeance and its capacity. Reproduced from ref. with permission from Elsevier.
Fig. 143
Fig. 143. Basics of water electrolysis kinetic markers’ determination, for the example of the HER. (a) HER onset potential and overpotential at a current density of 10 mA cm−2 and (b) corresponding Tafel slopes. The blue electrocatalyst would be better for operation at low current density, while the red one would be better at high current density (i.e., in an industrial water electrolyser). Reproduced from with permission from ref. with permission from the American Chemical Society. (c) Example of electrochemical impedance spectroscopy measurements (EIS) enabling double layer capacitance measurements and (d) similar determination of the double layer capacitance from cyclic voltammetry measurements. Reproduced from ref. , with permission from Elsevier.
Fig. 144
Fig. 144. Evaluation of the OER (a) activity and (b) stability versus time at a given representative OER current in MEA (blue) and RDE (black) configuration for a state-of-the-art commercial IrO2 catalyst. Reproduced from ref. with permission from Wiley.
Fig. 145
Fig. 145. Evolution of the interlayer spacing and intralayer metal–metal distances of NiFe and CoFe LDHs from WAXS measurement. (a and b) Normalized and background-subtracted (003) peak obtained during in situ WAXS in 0.1 M KOH and potential steps for NiFe LDH (a) and CoFe LDH (b). (c and d) Interlayer distances for NiFe LDH (c) and CoFe LDH (d) obtained by Rietveld refinement. (e and f) In situ WAXS patterns for d-values close to the (110) peak of NiFe LDH (e) and CoFe LDH (f). For NiFe LDH, the WAXS patterns at the reported potentials were obtained by the collapsed film technique. In e, the dashed arrows highlight the feature associated to the γ-phase. (g and h) Lattice parameter a, corresponding to the intralayer metal–metal distance in NiFe LDH (g) and CoFe LDH (h) obtained by Rietveld refinement. Full and open symbols are used for different phases. Error bars represent SD provided by Topas for the refined parameters. Reproduced with permission from ref. Copyright Springer-Nature 2020.
Fig. 146
Fig. 146. Example of tomographic elucidation of a PTL porous structure. Reproduced with permission from ref. . Copyright Elsevier 2017.
Fig. 147
Fig. 147. Production of sonolysis species by acoustic cavitation.
Fig. 148
Fig. 148. Effect of ultrasound on (a) cell voltage (Ecell), (b) efficiency (ε) and (c) specific energy (e) for hydrogen production (*UsA = ultrasound-assisted).
Fig. 149
Fig. 149. Hydrogen evolution on a Pt wire in the absence (top left corner) and presence of ultrasound (26 kHz, 100% ultrasonic amplitude). The applied potential was set at −1.30 V vs. RHE – (a) 0 μs, (b) 100 μs, (c) 200 μs, (d) 300 μs, (e) 400 μs, (f) 500 μs, (g) 600 μs. The time between each image is 10−4 s (100 μs) filmed at 10 000 frames per second. Reproduced with permission from ref. . Copyright Elsevier 2020.
Fig. 150
Fig. 150. Pourbaix diagram for electrolysis of 0.5 M NaCl. The electrode potential for OER is included as well, assuming oxygen partial pressure of 0.021 MPa. The red square points show the operating potentials (vs. SHE) after 1 h constant current density of 10 mA cm−2 with NiFe LDH catalyst in 0.1 M KOH + 0.5 M NaCl (pH 13) and 0.3 M borate buffer + 0.5 M NaCl (pH 9.2) electrolyte. Reproduced with permission from ref. Copyright Wiley 2016.
Fig. 151
Fig. 151. (a) Electrocatalytic OER activities of NiFe LDH nanoplates supported on carbon, measured using LSV in four different electrolytes after CV “break-in” (50 cycles). A potential of approximately 480 mV, corresponding to the design criteria limit, is marked by a dashed vertical line. (b) Corresponding Tafel plot for low current density j. Measurement conditions: room temperature, 1600 rpm, and scan rate of 1 mV s−1. Reproduced with permission from ref. . Copyright Wiley 2016.
Fig. 152
Fig. 152. Cation-selective layer generation during anodic activation (A) chronopotentiometry plot whilst second activation step in salty electrolyte. (B) The associated OER relative faradaic efficiency plots for O2 production. Reproduced with permission from ref. Copyright PNAS 2019.
Fig. 153
Fig. 153. Durability tests (1000 h) recorded at a constant current of 400 mA cm−2 of the seawater-splitting electrolyser under 1 M KOH + real seawater at room temperature and 6 M KOH electrolyte at 80 °C, respectively. (h) Reproduced with permission from ref. . Copyright PNAS 2019.
Fig. 154
Fig. 154. Theoretically calculated and experimentally measured O2 amounts for NCFPO/C@CC as a function of time in the NaCl + KOH electrolyte. Reproduced with permission from ref. . Copyright ACS 2020.
Fig. 155
Fig. 155. Survey of Ir-based organometallics subject to pyrolysis with activated carbon. Ir1, Ir2, Ir3, Ir4, Ir5, and Ir6 correspond to the following organometallics, respectively: chlorodihydrido[bis(2-diisopropylphosphino)ethylamine]iridium(iii), (1,5-yclooctadiene)(pyridine)(tricyclohexylphosphine)-iridium(i) hexafluorophosphate,chloro(5-methoxy-2-{1-[(4-methoxyphenyl)imino-N]ethyl}phenyl-C)(1,2,3,4,5 pentamethylcyclopentadienyl)iridium(iii), bis(pyridine)(1,5-cyclooctadiene) iridium(i)hexafluorophosphate, (1,5-cyclooctadiene)bis(methyldiphenylphosphine)iridium(i) hexafluorophosphate, and iridium chloride. Reproduced with permission from ref. Copyright Wiley 2020.
Fig. 156
Fig. 156. The cumulative installed capacity of modern hydrogen electrolysers, split by technology; with analysts’ projections for future market size. Historical data from Buttler and IEA, and future trajectories from Aurora and the ETC.
Fig. 157
Fig. 157. The perceived competitiveness of hydrogen across different market sectors. (a) The ‘hydrogen ladder’ popularised by Liebreich Associates, which ranks applications from uncompetitive to unavoidable. (b) The competitiveness of hydrogen applications versus low-carbon and conventional alternatives, from the Hydrogen Council. (c) The assessment of multiple potential uses of hydrogen performed by SYSTEMIQ for the ETC.
Fig. 158
Fig. 158. Capex costs of electrolysers, both historical and projections for alkaline, PEM and SOEC technologies. Data compiled from ref. .
Fig. 159
Fig. 159. Typcial schematic of a PEMWE system. Source ref.
Fig. 160
Fig. 160. Comparison of the cost contribution of different electrolyser components. Data from ref. , , and .
Fig. 161
Fig. 161. Component contribution to PEMWE electrolysis system cost at different capacities. Data from ref. .
Fig. 162
Fig. 162. Estimates of cost contribution of different PEM electrolyser stack elements from three studies. Data from ref. .
Fig. 163
Fig. 163. The development of experience rates for electrolysis stack modules as a function of cumulative production. Reproduced from Böhm et al.
Fig. 164
Fig. 164. Cost projections from ETC based on optimistic and conservative learning rates for electrolysers (technology-neutral); compared to the BNEF scenario for costs outside of China. Data from ref. .
Fig. 165
Fig. 165. Cost projections for alkaline and PEM electrolysers surveyed from the literature. Reproduced from Saba et al.
Fig. 166
Fig. 166. Estimated capital costs for water electrolysis in 2030 from expert elicitations conducted by Schmidt et al. The median cost from all experts is given by technology (top to bottom). Each panel shows the relative impact of increased R&D funding (1x, 2x, 10x) by bars labelled R&D. This impact combined with production scale-up due to increased deployment is shown by bars labelled RD&D. Reproduced from ref. .
Fig. 167
Fig. 167. The size of individual electrolysis plants commissioned over the last two decades, and announced by companies for construction during the next decade. Compiled using data from IEA and Aurora.
Fig. 168
Fig. 168. Estimate of cost reduction associated with plant size increases for AWEs and PEMWEs. Reproduced from the IEA.
Fig. 169
Fig. 169. Future cost reductions for PEMWE systems across different production scales. Reproduced from Mayyas and Mann.
Fig. 170
Fig. 170. Hypothetical future levelised cost of hydrogen production from electrolysers as a function of capital cost (left) and electricity cost (right). Calculations assume a discount rate of 8% and efficiency of 69% (LHV). Reproduced from IEA.
Fig. 171
Fig. 171. Modelled cost of hydrogen production using solar PV or wind as electricity source. Reproduced from IEA.
Fig. 172
Fig. 172. Cost projections for green hydrogen production over time, as a function electrolyser capital cost and electricity price. Reproduced from IRENA.
Fig. 173
Fig. 173. Levelised cost of hydrogen production from different production technologies. Reproduced from ref. and .
Fig. 174
Fig. 174. The most cost-effective storage technology, in terms of lowest levelised cost of storage, as a function of the application requirement. Each panel shows the technology with the lowest levelised cost for all possible combinations discharge duration and annual cycle requirements. Left panels consider all modelled technologies, and right panels exclude pumped hydro and underground compressed air (as these have geological pre-requirements). Circled numbers represent the requirements of 12 common power-systems applications which are monetised. Colours represent technologies with lowest LCOS. Shading indicates the difference in levelised cost between the best and second-best technologies, so darker areas indicate a strong cost advantage of the prevalent technology.
None
Marian Chatenet
None
Dario R. Dekel
None
Pierre Millet
None
Iain Staffell
None
Helmut Schäfer

Similar articles

Cited by

References

    1. “Sir David Attenborough: We Must Act on Population”. Population Matters. 5 October 2018. Retrieved 1 December 2019
    1. Gregus J. Guillebaud J. Eur. J. Contracept. Reprod. Health Care. 2020;25:409–416. doi: 10.1080/13625187.2020.1821356. - DOI - PubMed
    1. Bongaarts J. O’Neill B. C. Science. 2018;361(6403):650–652. doi: 10.1126/science.aat8680. - DOI - PubMed
    1. Dincă M. Surendranath Y. Nocera D. G. Proc. Natl. Acad. Sci. U. S. A. 2010;107:10337–10341. doi: 10.1073/pnas.1001859107. - DOI - PMC - PubMed
    1. Poizot P. Dolhelm F. Energy Environ. Sci. 2011;4:2003–2019. doi: 10.1039/C0EE00731E. - DOI