Review
. 2022 Sep 14;122(17):14018-14054.
doi: 10.1021/acs.chemrev.1c00936. Epub 2022 May 16.

Cryo-electron Microscopy of Adeno-associated Virus

Affiliations
Review

Cryo-electron Microscopy of Adeno-associated Virus

Scott M Stagg et al. Chem Rev. .

Abstract

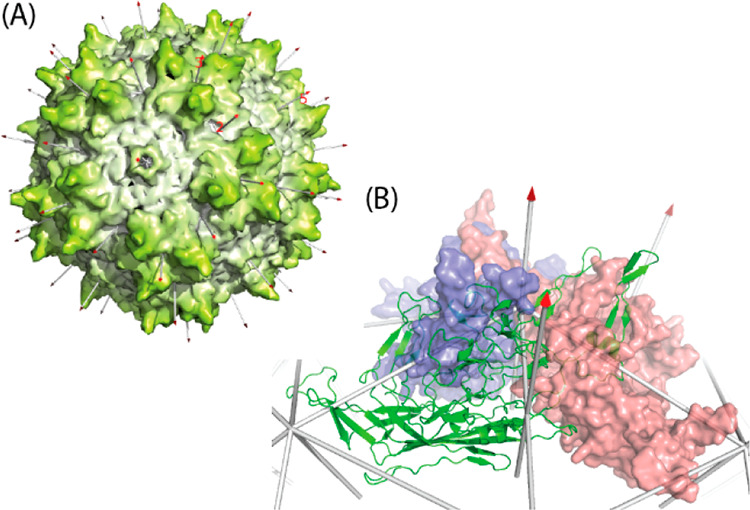
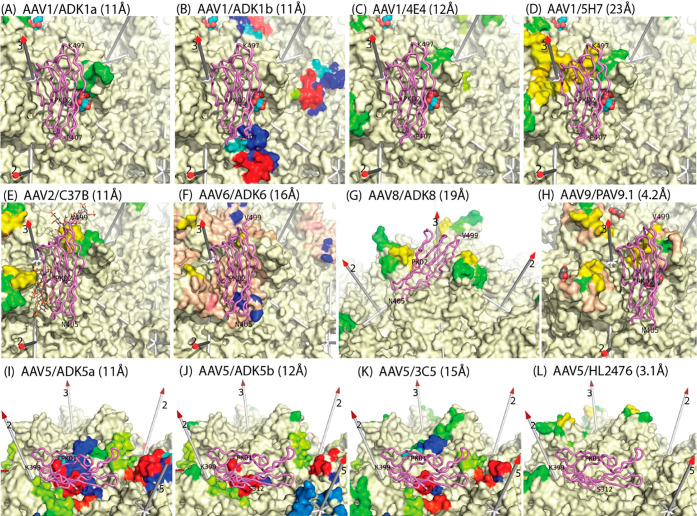
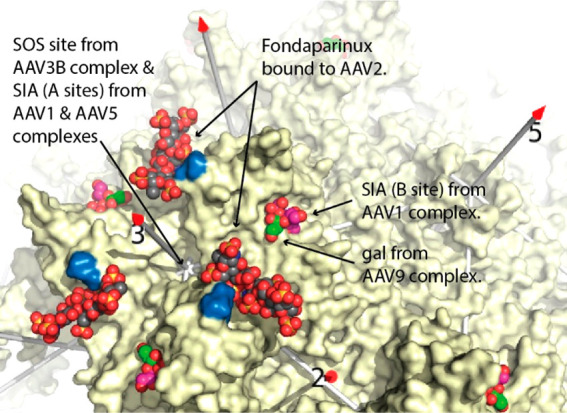
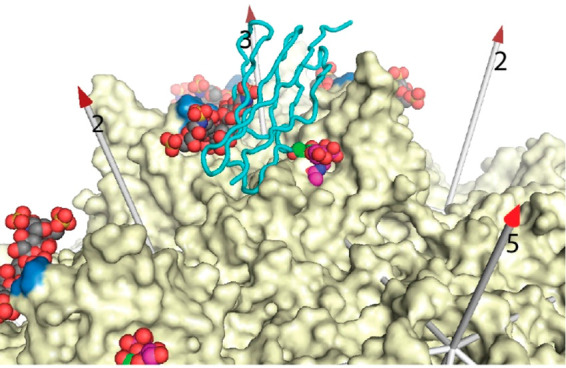
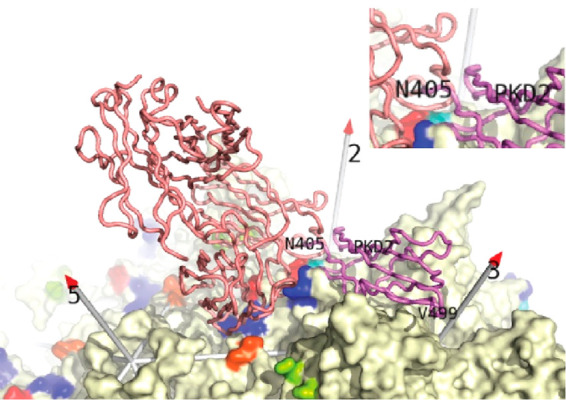
Adeno-associated virus (AAV) has a single-stranded DNA genome encapsidated in a small icosahedrally symmetric protein shell with 60 subunits. AAV is the leading delivery vector in emerging gene therapy treatments for inherited disorders, so its structure and molecular interactions with human hosts are of intense interest. A wide array of electron microscopic approaches have been used to visualize the virus and its complexes, depending on the scientific question, technology available, and amenability of the sample. Approaches range from subvolume tomographic analyses of complexes with large and flexible host proteins to detailed analysis of atomic interactions within the virus and with small ligands at resolutions as high as 1.6 Å. Analyses have led to the reclassification of glycan receptors as attachment factors, to structures with a new-found receptor protein, to identification of the epitopes of antibodies, and a new understanding of possible neutralization mechanisms. AAV is now well-enough characterized that it has also become a model system for EM methods development. Heralding a new era, cryo-EM is now also being deployed as an analytic tool in the process development and production quality control of high value pharmaceutical biologics, namely AAV vectors.


Conflict of interest statement

The authors declare no competing financial interest.

Figures

Figure 1
Figure 1
Capsid structure. (A) The surface of AAV2 is viewed approximately down a 5-fold axis. Data from both a mouse parvovirus and AAV suggests that an opening of the pore allows extrusion of the VP1-encoded phospholipase A2 (PLA2) domain for endosomal escape and for DNA entry/exit. Partially ordered density along the 5-fold pore in the AAV8 crystal structure suggests that some N-termini are external, as in several autonomous parvoviruses, connected by polypeptide chain running through the pore to the start of the β-barrel on the inner surface of the capsid. Above and to the right of the 5-fold, a 3-fold axis is surrounded by spikes that figure prominently in cellular entry and immune neutralization. (B) Three subunits intertwine around one of the 3-fold axes. The green ribbon shows the secondary structure common to VP1–3, dominated by the β-barrel on the inside surface of the capsid. In parvoviruses, the loops between β-strands are of unusual length, containing their own secondary structures and interacting with loops of neighboring subunits to form functionally important surface topologies that are distinctive to the major parvovirus genera.,,− The gross surface features are more conserved between AAVs (than between parvoviral families), but structural differences are sufficient to account for distinctive virus–host interactions.
Figure 2
Figure 2
Phylogenetic relationships between primate AAV VP3 major capsid proteins. (A) A maximum likelihood tree, showing, at each node, the bootstrap probability based on 500 replicates. The scale bar shows the fraction of amino acid substitutions per branch length. Representative serotypes are shown, grouped by clade, where applicable. VP3 sequences were curated manually from AAV1–13 VP1 (AAV1–13, GenInfo identifiers, respectively: NP_049542.1, YP_680426.1, AAB95452.1, NP_044927.1, YP_068409.1, AAB95450.1, YP_077178.1, AAS99264.1, AAT46337.1, AAT46339.1, ABI16639.1, and ABZ10812.1) and aligned with MUSCLE. The tree was generated using MEGA X. (B) Amino acid identities (%) based on pairwise alignment. Dark-blue highlights >90% identity; light-blue highlights 80–90% identity.
Figure 3
Figure 3
Progress in AAV cryo-EM. Through 2014, cryo-EM complemented higher resolution X-ray diffraction with studies of complexes, transitions, or less-ordered components that were not amenable to crystallography. 2015 brought the first structure beyond 3 Å, a resolution that supports the building of atomic models. Over a three-year period, the enabling EM technology was more broadly disseminated, leading to substantial growth in 2020. Also shown is the steady improvement in the highest resolution attained in each year. While it still requires special care to reach the highest 1.5–1.9 Å resolutions, it is becoming more routine to reach the 2–3 Å regime from which atomic models are readily derived.,
Figure 4
Figure 4
VP3 capsid protein subunit structure. The view is from the outside, looking down an icosahedral 2-fold, with a 3-fold left, and a 5-fold right. In traces A–C, the conserved β-barrel is behind the outer surface loops in the foreground. (A, B, D) Rainbow coloring is from blue (N-terminus) to red (C-terminus). (A) A subunit from the AAV2 crystal structure is annotated by sequence-variable region (VR). VR-IV through VR-VIII are all contributed by a long loop between β-strands G and H. (B) Neighboring subunits are added (thinner trace), with VRs of close neighbors intertwined and annotated in abbreviated form (chain-id:loop no.). (C) Structures of representative serotypes 2–9 and 11 are overlaid, colored by order in the AAV phylogenetic tree (Figure 2): AAV6 in violet, AAV3 in blue, AAV2 in cyan, AAV9 in green, AAV8 in lime, AAV7 in yellow, AAV5 in orange, AAV4 in brown, and AAV11 in red. AAV6, AAV3B, AAV2, AAV9, AAV8, and AAV4 are the crystal structures (PDB 3shm,3kic,3ux1,2qa0, and 2g8g(148)), while AAV7, AAV5, and AAV11 are EM structures that are new (7jot, 7l6f(86)) or at appreciably higher resolution (7kp3). From this, we see that, in approximate order, VR-IV, VR-V, VR-VII, VR-I, and then VR-III exhibit the most structural diversity, with VR-IX, VR-VI, and VR-II more conserved. The outliers are usually AAV5, AAV4, and AAV11 but differing by location. The tip of VR-IV extends out in most serotypes, but turns tangentially in one direction for AAV4 and AAV11 and in the opposite direction for AAV5. At the C-terminal end of VR-V, just AAV4 and 11 have a six-residue insertion, whereas much of the AAV5 loop is displaced ∼2 Å in the opposite direction. At VR-VII, a single insertion in AAV4/11 moves the base of the loop toward the spike (relative to most serotypes), but, in AAV5, a three-residue insertion extends the loop 6 Å further from the spike. VR-I loops differ in length by five residues with AAV4/11 the shortest, a single insertion point for clades A–F with inserts of diverse conformation and an insertion point for AAV5 two residues later. Finally, VR-III is well conserved for clades A–F, but has two-residue insertions for AAV5 and for AAV4/11, the latter displaced 3 Å further. (D) With AAV2 as an example, the surface is rainbow-colored as in (A), showing VR-I as blue, VR-II as cyan, VR-III as aquamarine, VR-IV as dark-green, VR-V as light-green, VR-VI as lime, VR-VII as chartreuse, VR-VIII as yellow, the HI loop as brown, and VR-IX as red.
Figure 5
Figure 5
Structural variation among representative serotypes. Each panel shows the Cα–Cα distance by residue number for the serotype labeled versus representatives of each phylogenetic group. The panels are ordered according to the phylogenetic tree in Figure 2 (so similar serotypes are clustered together) and with color coding of serotypes as in Figure 4C. In each panel, the serotype histograms are ordered by decreasing sequence identity from bottom to top. The nine variable regions (VR-I through VR-IX) are shaded gray in the backdrop of each panel. It is clear that the structural differences are greatest in the VRs. Between pairs of related serotypes, some of the VRs have diverged while others remain quite similar, generally with the number of diversified VRs increasing with evolutionary distance.
Figure 6
Figure 6
Representative AAV sequences aligned. The N-terminal amino acids of VP1, VP2, and VP3 are marked with black arrows. Variable regions (VRs) are boxed and amino acids colored by type.
Figure 7
Figure 7
Cryo-EM reconstruction of AAV2 empty particles at 1 nm resolution. An equatorial section from EMD1907 has been rendered using PyMol with map values >1σ colored blue. Symmetry axes are indicated, as are “fuzzy globules”, features at the inner surface on 2-fold axes that were proposed to be the unique parts of VP1 or VP2 that do not correspond to atomic model in high-resolution structures.,
Figure 8
Figure 8
Epitope mapping by cryo-EM. Although not of atomic resolution, the reconstruction was clear enough to dock a canonical Fab′ arm (salmon). The capsid structure is rainbow colored from blue (Gly217) to red (Leu735), so that contributions of different variable regions (VR) to the epitope can be discerned. Epitope residues are in dimmed color, looking through the lower end of the translucently rendered Fab′A20. The principal contributions to the epitope are: (a) Ser261–Ser264 of VR-I, together with Asn253, Asn254, and Lys258 of the canyon/wall that are colored red. (b) Ser384–Gln385 of VR-III (aquamarine). (c) From a 2nd subunit, Val708 of VR IX and Asn717 (red). (d) Glu548 and Lys556 from VR-VII (chartreuse) and on an adjacent 3-fold spike and Ser658–Thr660 (brown) in the canyon from a 3rd subunit. The epitope is clearly conformational, including several peptide segments and three subunits, so specific for assembled complexes. The AAV2-Fab′A20 complex shown is the only antibody complex available on public databases, but other structural mappings of epitopes followed a similar process of docking a “pseudo-atomic” model into usually low-resolution cryo-EM of an antibody complex to identify AAV contact amino acids.
Figure 9
Figure 9
Epitopes of additional anti-AAV monoclonal antibodies. In addition to the pseudoatomic model coordinates available for the AAV2–Fab′A20 complex (Figure 8), lists of contact residues have been reported, derived from cryo-EM studies of 12 other Fabs at resolutions noted parenthetically. Contact residues are highlighted on the surfaces of the respective serotypes,,,,,, rainbow-colored by residue number (blue to red) to distinguish different VRs. The rest of the surfaces are cream colored, except for the wheat-colored regions in F and G, reported as occluded by antibody binding., For AAV1 and AAV2, known glycan attachment sites are indicated with the overlaid sialic acid (spheres) or fondaparinux (stick-model), respectively., Glycan attachment has not been observed directly for other serotypes, but mutational analysis for dual-binding AAV6 indicates a sialic acid site with AAV1 and heparan-binding like AAV2 with participation of Lys531 (salmon-colored)., Bound domains from the subsequent cryo-EM complexes of AAVR are also overlaid with violet backbone traces: PKD1 for AAV5 and PKD2 for AAV1 and AAV2 (with AAV6–9 assumed to be similar).,,,, Comparative analysis tells us that: (1) dominant antigenic regions include the spikes (tip and sides) and the spur that runs toward the 2-fold. (2) Many, but not all neutralizing antibodies occlude glycan attachment. (3) The binding of all neutralizing antibodies conflicts with the binding of the serotype-relevant AAVR domain. In most cases, PKD1 or PKD2 lies directly over the neutralizing epitope. For HL2476 (L) conflict is with the implied location of the unseen interdomain linker (several others show direct conflict with PKD2 as well as implied conflict with the linker, as illustrated for AAV2/A20 in Figure 12).
Figure 10
Figure 10
Comparison of glycan attachment sites overlaid on the structure of AAV2. Shown are fondaparinux, a heparin analogue (space-filling, gray carbons) from the AAV2 cryo-EM complex, sialic acid (SIA, magenta carbons) from the AAV1 crystal structure, and galactose (gal; green carbons) from the cryo-EM AAV9 structure, the latter two overlapping. Fondaparinux is attaching at arginines 585 and 588 (blue) of the heparin-binding domain on the surface of AAV2. Atomic models are not available, but additional glycan attachment interactions for AAV1, AAV3B, and AAV5 have also been localized through crystallography and/or mutation to the surface at the 3-fold axis.,, (A second AAV5-SIA site was buried where the HI loop (orange in Figure 4) disappears under the 5-fold side of the spike, but it is likely not functionally relevant because mutation leads to SIA-independent change in transduction.) The fondaparinux heparan analogue and SIA/galactose are attached on opposite sides of each 3-fold proximal spike. Actually, they are closer with a 3-fold rotation that brings the sites to opposite sides of a valley running from 2-fold to 3-fold, which may be relevant to protein receptor-binding.
Figure 11
Figure 11
Conflict between the binding of the AAVR receptor and glycan attachment. Sites of glycan attachment are marked by overlaying on the surface of AAV2 the structures of fondaparinux, sialic acid, and galactose (in CPK sphere representation), bound respectively to AAV2, AAV1, and AAV9.,, Also overlaid is the PKD2 domain of AAVR from the AAV2 complex (cyan backbone trace). There is substantial direct conflict between fondaparinux (CPK grey carbons, left of AAVR) and AAVR near AAVR Asp459, indicating that heparan and AAVR cannot be bound simultaneously at the same symmetry-equivalent site on AAV. Galactose overlaps (CPK, right of AAVR) and sialic acid is close (binding at nearly the same site). Sialic acid and galactose are terminal residues on chains whose access would be obstructed by AAVR. All potential conflicts are with the PKD1 domain of AAVR. PKD2, as in the AAV5-complex, lies further away.
Figure 12
Figure 12
Conflict between the binding of neutralizing antibody A20 and the AAVR receptor. Overlaid on the surface of AAV2 are the AAVR PKD2 domain (violet) and the A20 Fab′ structure (salmon).,, The AAV2 surface is colored cream, except for A20 epitope amino acids (within 4 Å of Fab A20) that are colored by residue number from blue to red. The view is from the top of a 3-fold spike, down toward a 2-fold axis. Conflict (highlighted in the inset) is seen where both bind to the spur extending from the 3-fold proximal spike. The first AAVR residue seen is Asn405, but this implies likely conflict of mAb A20 with the unseen PKD1 domain: we see the first residues of PKD2 passing through space occupied by the CDR loops of the neutralizing antibody. Five residues of the AAV2 surface are part of the A20 epitope and also within the PKD2 footprint, but this view illustrates that conflict can also be several Å removed from the recognition surfaces.
Figure 13
Figure 13
Structures of the AAV2 (A) and AAV5 (B) AAVR complexes taken from cryo-EM reconstructions at 2.4 and 2.5 Å resolution, respectively., The view is from above the canyon, between 2-fold (left) and 5-fold (right), looking toward the spur or plateau that leads up to a 3-fold proximal spike. The unsharpened cryo-EM reconstruction (translucent violet) is overlaid on the backbone trace, with a single domain of AAVR seen in each case: PKD1 with AAV2 (A) and PKD1 with AAV5 (B). Within the contact footprint (4.5 Å cutoff), the surfaces of AAV are rainbow-colored by residue number, distinguishing the variable regions (VRs). For PKD2, there is continuous map for the backbone and tight AAV interactions are concentrated near the N-terminus of the domain. For PKD2, AAV contacts are exclusively at the C-terminal end, with weaker map and greater disorder at the N-terminal end. The first residue expressed in this construct is Val311, but there are no AAV contacts near the 5-fold.
Figure 14
Figure 14
Cryo-EM reconstruction of the AAV5–AAVR complex. Notwithstanding disorder at the distal end of the domain (Figure 13), the map for AAVR PKD1 is well defined at 2.5 Å resolution. The view is centered on Arg353 of AAVR (green-carbon stick model), where it is surrounded by AAV5 (cyan-carbon stick model).
Figure 15
Figure 15
AAV-DJ Coulombic potential maps at different resolutions. Tyr283 is buried and is an example of one of the more ordered side chains. Arg486 is a surface residue that are typically less well ordered. Structures of AAV-DJ have been determined at different resolutions, at 4.5 Å, at 2.8 Å (in complex with fondaparinux), and at 1.56 Å.,, The structure refined at 1.56 Å resolution is shown with green carbons, with structures refined into lower resolution maps shown with gray carbons. Backbone map is continuous at all resolutions through most of the structure, allowing a complete trace. At 1.56 Å resolution, carbonyls, hydroxyls, and many hydrogens are apparent, defining unambiguously peptide dihedrals and hydrogen bonds. For the well-ordered Tyr283, the map is sufficient to model a constrained aromatic side chain well at 2.8 Å, and enough is apparent even at 4.5 Å resolution. Although the fit of Arg486 appears good at 2.8 Å resolution, the map is truncated and the functional guanidinium atoms are misplaced by >1 Å, so designation of salt bridges would not be robust. While at 1.56 Å resolution, the extended conformation of Arg486 is clear, the more bulbous map at 2.8 Å allowed a shorter “corkscrew” rotamer to pass muster compatible with a somewhat misplaced backbone. At 4.5 Å resolution, the map is broken and connectivity wrong near Arg486 Cδ. The model is a reasonable approximation only because it was built using a high-resolution crystal structure and refined using a conservative algorithm,, otherwise, side chains at ca. 4 Å resolution are often plausible guesses among commonly occurring rotamers.
Figure 16
Figure 16
Coulombic potential maps from the structures of different serotypes exemplifying representative resolutions. This figure illustrates ambiguities and errors that would be typical for AAV structures at the stated resolutions. Illustrated amino acids align with those of Figure 15: an interior tyrosine, expected to be well-ordered and among the clearest (1) and a surface arginine or lysine, expected to be less well ordered (2). Atomic structures are shown with gray carbons, with the structure of AAV-DJ superimposed (1.56 Å, green carbons, PDB 7kfr). (A) AAV2 L336C is an excellent fit at 1.86 Å resolution (PDB 6e9d, EMD 9012). This structure was determined completely independently of AAV-DJ. Close agreement indicates that AAV-DJ can be regarded as a ground truth comparator for the non-hydrogen structure of other serotypes in regions (Tyr284 and Arg484), where sequence differences have no impact. Comparing this 1.86 Å map to the 1.56 Å (Figure 15), we see some, but fewer of the hydrogens. (B) At 2.1 Å resolution, AAV5 Tyr272 shows no evidence of hydrogens but is otherwise modeled well (PDB 7kp3, EMD 22987.) Arg484 is slightly less well defined but clearly different from AAV-DJ. Map ambiguity forces a choice between a model centered at the backbone or moved 1/2 Å for seemingly better fit of the guanidinium group. (C) At 2.5 Å resolution, there is no doubt of the identity of Tyr281 and Lys487 in AAV12 (PDB 7l6b, EMD 23201), but the tyrosine is missing some density; the backbone of Lys487 lacked the definitive features to see, in retrospect, that a structure more like AAV-DJ would have been ∼0.3 Å better. (D) In the 3.1 Å structure of AAV1 (PDB 6jcr, EMD 9795), local constraints yielded a correct model for Tyr282 in spite of missing map for Cδ and Cε. Truncated map for Arg485 led to a “corkscrew” rotamer model that we would not choose in retrospect. (E) The 3.8 Å wtAAV2 structure (PDB 5ipi, EMD 8099) is expected to be near identical to the L336C mutant (A). Fitting the side chain of Tyr281 into a truncated map has led to a ∼1 Å deformation of the backbone. At slightly higher contour, the map for Arg484 is discontinuous, with the result that the rotamer is incorrect, and compensating deformations of ∼1.5 Å have been made in the backbone. Inverting the narrative, even below 4 Å resolution, the approximate backbone path is clear. The general directions of side chains become clear and backbone more precise between 4 and 3 Å resolution. Rotamers become unambiguous between 3 and 2 Å resolution. Beyond 2 Å resolution, most non-hydrogens will be accurately placed, and with further improvement in resolution, more of the hydrogens become clearly defined.

Similar articles

Cited by

References

    1. Xie Q.; Bu W.; Bhatia S.; Hare J.; Somasundaram T.; Azzi A.; Chapman M. S. The Atomic Structure of Adeno-Associated Virus (Aav-2), a Vector for Human Gene Therapy. Proc. Natl. Acad. Sci. U. S. A. 2002, 99, 10405–10410. 10.1073/pnas.162250899. - DOI - PMC - PubMed
    1. McPherson R. A.; Rose J. A. Structural Proteins of Adenovirus-Associated Virus: Subspecies and Their Relatedness. J. Virol. 1983, 46, 523–529. 10.1128/jvi.46.2.523-529.1983. - DOI - PMC - PubMed
    1. Becerra S. P.; Koczot F.; Fabisch P.; Rose J. A. Synthesis of Adeno-Associated Virus Structural Proteins Requires Both Alternative Mrna Splicing and Alternative Initiations from a Single Transcript. J. Virol. 1988, 62, 2745–2754. 10.1128/jvi.62.8.2745-2754.1988. - DOI - PMC - PubMed
    1. Berns K. I., Parvoviridae: The Viruses and Their Replication. In Virology, 3rd ed.; Fields B. N., Knipe D. M., Howley P. M., Eds.; Raven Press: Philadelphia, 1996; pp 1017–1041.
    1. Harrison S. C.Principles of Virus Structure. In Virology, Fields B. N., Knipe D. M., Eds.; Raven Press: New York, 1990; pp 37–61.

Publication types