. 2022 May 16;45(5):48.
doi: 10.1140/epje/s10189-022-00182-6.

Actomyosin contractility requirements and reciprocal cell-tissue mechanics for cancer cell invasion through collagen-based channels

Affiliations

Actomyosin contractility requirements and reciprocal cell-tissue mechanics for cancer cell invasion through collagen-based channels

Lianne Beunk et al. Eur Phys J E Soft Matter. .

Abstract

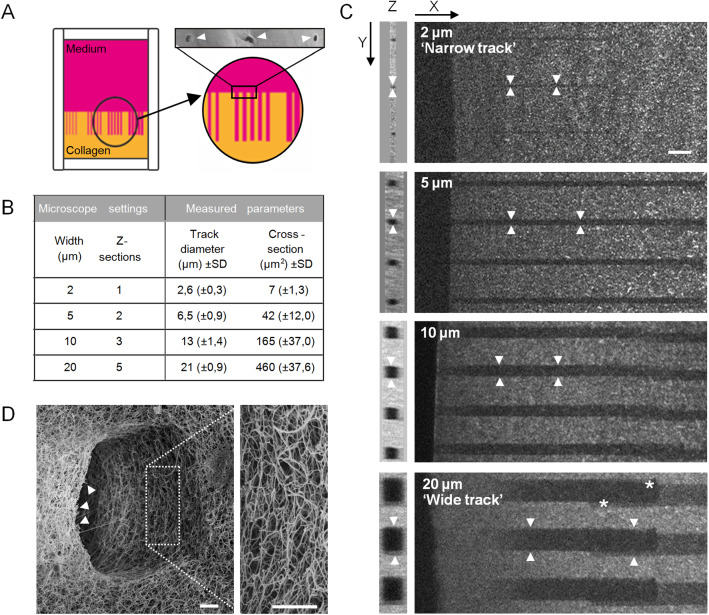
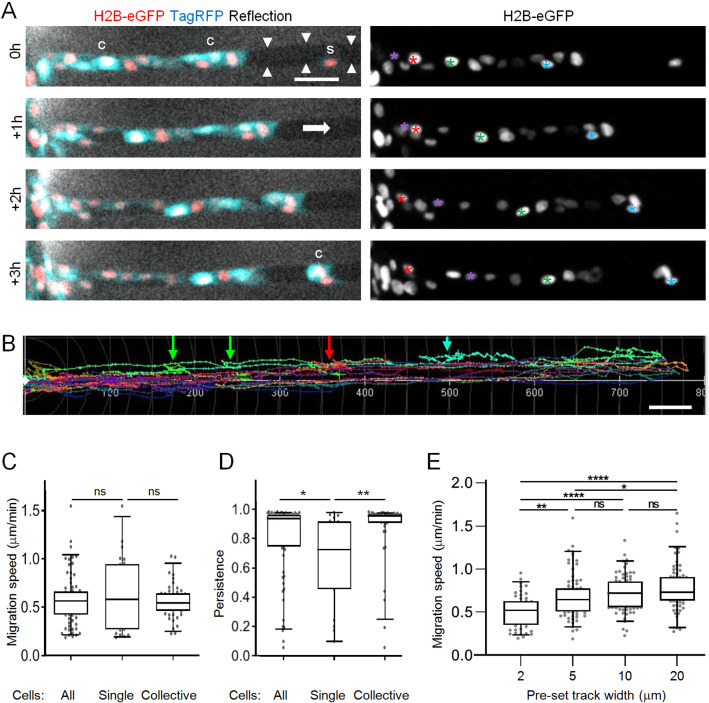
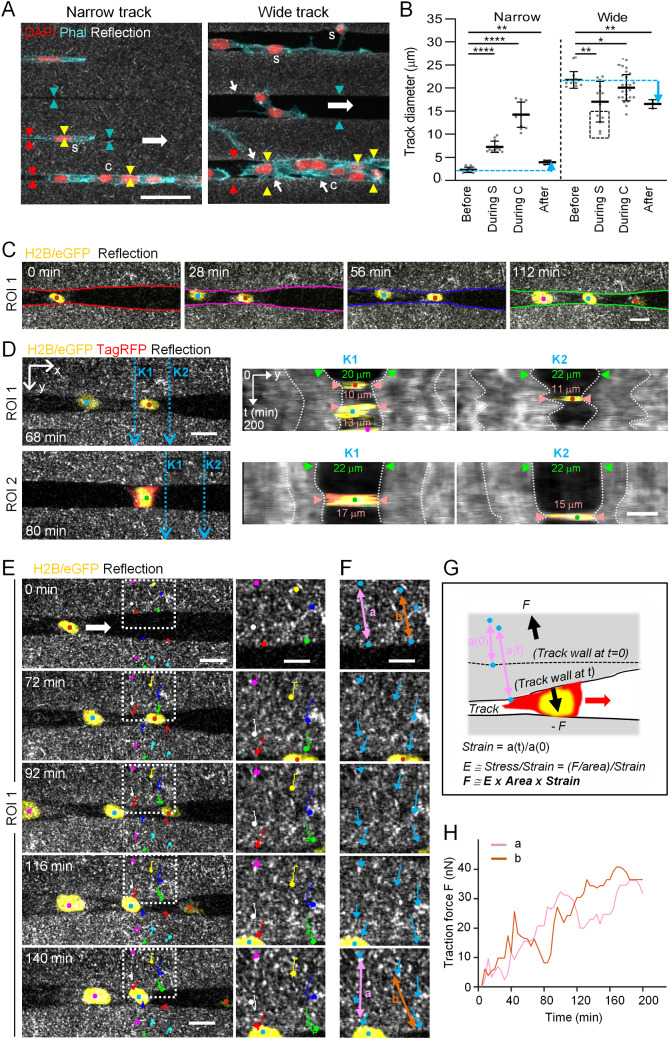
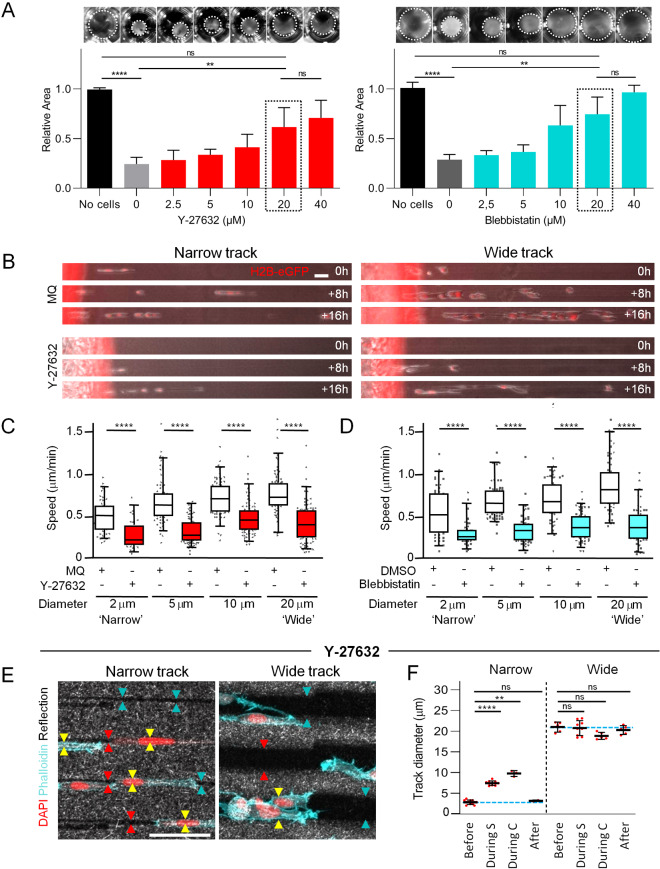
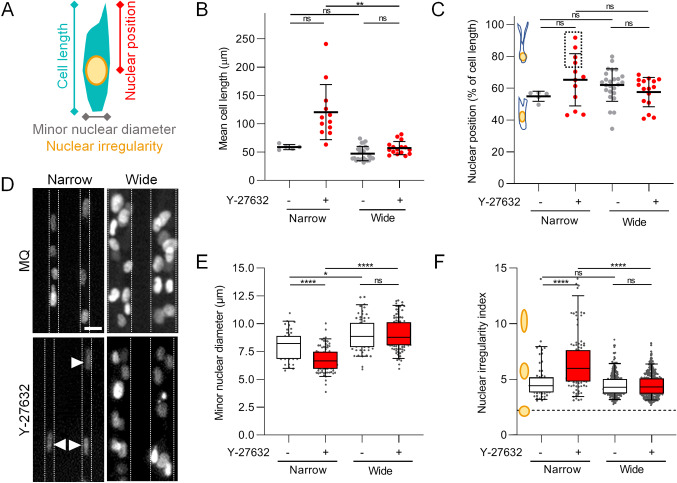
The interstitial tumor microenvironment is composed of heterogeneously organized collagen-rich porous networks as well as channel-like structures and interfaces which provide both barriers and guidance for invading cells. Tumor cells invading 3D random porous collagen networks depend upon actomyosin contractility to deform and translocate the nucleus, whereas Rho/Rho-associated kinase-dependent contractility is largely dispensable for migration in stiff capillary-like confining microtracks. To investigate whether this dichotomy of actomyosin contractility dependence also applies to physiological, deformable linear collagen environments, we developed nearly barrier-free collagen-scaffold microtracks of varying cross section using two-photon laser ablation. Both very narrow and wide tracks supported single-cell migration by either outward pushing of collagen up to four times when tracks were narrow, or cell pulling on collagen walls down to 50% of the original diameter by traction forces of up to 40 nN when tracks were wide, resulting in track widths optimized to single-cell diameter. Targeting actomyosin contractility by synthetic inhibitors increased cell elongation and nuclear shape change in narrow tracks and abolished cell-mediated deformation of both wide and narrow tracks. Accordingly, migration speeds in all channel widths reduced, with migration rates of around 45-65% of the original speed persisting. Together, the data suggest that cells engage actomyosin contraction to reciprocally adjust both own morphology and linear track width to optimal size for effective cellular locomotion.


Conflict of interest statement

We declare we have no competing interests.

Figures

Fig. 4
Fig. 4
Setup of a collagen model with microtracks of varying cross-sections. A Schematics depicting the setup of a collagen lattice within a 3D chamber from which microtracks of varying cross-sections were laser-ablated. Top right, entrances of three microtrcks into collagen (arrowheads), imaged by scanning electron microscopy. B Overview of used microscope settings during laser ablation and indicated output parameters measured from negative reflection signal by confocal reflection microscopy. C Microtracks (arrowheads) of indicated microscope-set diameters after laser ablation. Images were generated from PFA-fixed collagen samples by second harmonic generation, with loss of signal indicating ablated regions. Drifting of the sample during laser ablation sometimes resulted in slightly shifted ablated areas (asterisks). D Entrance of 10 μm wide microtrack imaged by scanning electron microscopy. Arrowheads indicate cleanly cut fibers. Scale bars: 20 μm (C); 2.5 μm (D)
Fig. 5
Fig. 5
Characterization of HT1080 cell migration in microtracks. A All cells migrated within collagen-ablated wide track with a general migration direction from left to right (see white arrow). Images of cells with indicated nuclear and cytoplasmic labels within track (arrowheads) at different time points over 3 hours. Differently colored asterisks indicate individual nuclei. S, single moving cell; C, collectively moving cells. B Trajectories of cells in wide tracks over 24 h. Colorful arrows point to regions of respectively colored trajectories where cells changed migration direction. C Average speed per cell migrating as single cell or within a collective as indicated in (A). D Persistance of cells migrating as single cells or within a collective. Persistance was calculated as track length divided by the beeline. E Mean migration speed of individual cells over 6–22 hours in tracks of varying diameters. Data represent 53–80 cells per condition (N = 3), and are also shown in Fig. 4C). Horizontal. lines and boxes and whiskers show the medians, 25th/75th, and 5th/95th percentile. Dots show all individual measurements outside of the 25th to 75th percentile. Mann-Whitney test. Ns, not significant; *, p-value <0.05; **, p-value <0.01; ****, p-value <0.0001. All scale bars: 50 μm
Fig. 6
Fig. 6
Quantification of HT1080 cell-induced collagen deformation during microtrack migration. All cells migrated within collagen-ablated wide tracks with a general migration direction from left to right. (A) Single cells (s) and cell clusters (c) migrating in tracks of indicated widths. Arrowheads, visualization of track boundaries before (cyan), during (yellow) and after (red) cell passage; note the equal distance between arrowheads along the track length. Small white arrows indicate collagen densification. (B) Track widths before, during (’During S’, during single cell transmigration; ’During C’, during collective cell transmigration) or after cell passage of narrow or wide tracks. Data represent 3-27 measurements (dots) per condition (N=2). Solid line with whiskers, mean and SD. Cyan dotted lines, initial track diameter. Cyan arrow indicates difference between track diameter before and after cell transmigration. Black dotted rectangle, deformed track diameters by single cells attaching to both track walls. Kruskal-Wallis test with Dunn’s multiple comparisons test. *, p -value < 0.05; **, p -value < 0.01; ****, p-value < 0.0001. (C-F) 3D timelapse confocal microscopy of cell-induced track deformation, where 80 μm stacks with 5 mm step sizes were taken at 4-min time intervals. Each of the three different cell nuclei is color-coded by dots throughout these panels. (C) Imaging sequence taken from a plane in the middle of a track at indicated time points, corresponding to the upper part (ROI1) of Movie 1. Color-coded lines indicate track wall deformation. (D) Kymograph analysis from two image sequences from the upper (ROI1) and lower (ROI2) part of Movie 1. From the x-positions K1 and K2 of both ROIs (left, blue dotted arrows), track deformation over time is shown (K1, middle; K2, right). White dotted lines show deformation of the collagen as a function of time (vertical axis). (E) Tracking of the local collagen speckle pattern (colored dots and lines) over time. Dotted rectangle depicts region of zoom-in on the right, demonstrating that collagen displacement is increasing towards the track edge (compare long red and green with short pink and yellow colored trajectories). (F) Strain analysis by cell-induced change of collagen speckle distance over time. Blue arrows, magnitude and direction of collagen displacement with respect to the first time point (0). Colored double arrows a and b in upper and lower image indicate increased distance between track edge and speckle-like positions within the collagen after cell passage. (G) Cartoon depicting collagen deformation (strain) by transmigrating cell and calculation principle of cell-derived traction force onto collagen leading to track deformation. The depicted formulas are applied for the calculation of traction force F. (H) Quantification of F on the track wall over time. Scale bars: 50 μm (A), 20 μm (C; D and E, left), 10 μm (D and E, right; F)
Fig. 7
Fig. 7
Dependence of fibrosarcoma cell migration on actomyosin contractility through microtracks of all diameters. A Dose-dependent inhibition of collagen gel contraction (top; dotted circles indicate collagen area) and quantification (bottom). Collagen areas were related to normalized control gel without cells. Bars and error bars, mean and SD. Data represent 7-9 gels per condition (N = 3). B Representative image series depicting cell migration through microtracks of indicated width in the absence or presence of Y-27632. C, D Mean migration speed of individual cells at indicated conditions over 6–22 hours. Horizontal lines and boxes and whiskers show the medians, 25th/75th, and 5th/95th percentile. Dots show all individual measurements outside of the 25th to 75th percentile. Data represent 47–80 cells per condition (N = 3–4). E Migrating cells in tracks of indicated diameter in the presence of Y-27632. Arrowheads, visualization of track boundaries before (cyan), during (yellow) and after (red) passage of the cell body; note the equal distance between arrowheads along the track length. F Track widths before, during (‘During S’, during single cell transmigration; ‘During C’, during collective cell transmigration) or after cell passage of narrow or wide tracks in the presence of Y-27632. Data represent 3–12 measurements (dots) per condition (N = 1). Solid line with whiskers, mean and SD. A, C, D Kruskal-Wallis test with Dunn’s multiple comparisons test; F Mann-Whitney test. Ns, not significant; **, p-value <0.01; ****, p-value <0.0001. Bars: 50 μm
Fig. 8
Fig. 8
Cell and nuclear morphology in microtracks in the absence or presence of Y-27632. A Schematics depicting cellular and nuclear parameters analyzed. B Quantification of mean cell length over time at indicated conditions. C Quantification of mean nuclear position over time calculated as percentage of cell length over time. Dotted box indicates cells in which the nucleus located at cell rear, as indicated in the drawing. (B,C) Data represent mean value of 5-25 cells (dots) per condition over 3-13 hours (N=1). Solid line with whiskers, mean and SD. D Image of fluorescent nuclear H2B-mCherry signal at indicated conditions. Dotted lines indicate track walls, arrowheads indicate strongly deformed nuclei. E, F Quantification of minor nuclear diameter (E) or nuclear irregularity index (F) at indicated conditions. Horizontal lines and boxes and whiskers show the medians, 25th/75th, and 5th/95th percentile. Dots show individual measurements outside of the 25th to 75th percentile. Data represent 42-105 nuclei per condition (E), or 63-439 nuclei per condition, each from 2 experiments (F). B, C, E, F Kruskal-Wallis test with Dunn’s multiple comparisons test; ns, not significant; *, p-value <0.05; **, p-value <0.01; ****, p-value <0.0001. Scale bar: 20 μm

Similar articles

Cited by

References

    1. Gupta GP, Massague J. Cancer metastasis: building a framework. Cell. 2006;127:679–695. doi: 10.1016/j.cell.2006.11.001. - DOI - PubMed
    1. Diepenbruck M, Christofori G. Epithelial-mesenchymal transition (EMT) and metastasis: yes, no, maybe? Curr. Opin. Cell Biol. 2016;43:7–13. doi: 10.1016/j.ceb.2016.06.002. - DOI - PubMed
    1. Beunk L, Brown K, Nagtegaal I, Friedl P, Wolf K. Cancer invasion into musculature: mechanics, molecules and implications. Semin. Cell Dev. Biol. 2018;93:36–45. doi: 10.1016/j.semcdb.2018.07.014. - DOI - PMC - PubMed
    1. Gritsenko PG, Ilina O, Friedl P. Interstitial guidance of cancer invasion. J. Pathol. 2012;226:185–199. doi: 10.1002/path.3031. - DOI - PubMed
    1. van Helvert S, Storm C, Friedl P. Mechanoreciprocity in cell migration. Nat. Cell Biol. 2018;20:8–20. doi: 10.1038/s41556-017-0012-0. - DOI - PMC - PubMed

LinkOut - more resources