. 2022 Sep;88(3):1450-1464.
doi: 10.1002/mrm.29298. Epub 2022 May 16.

Segmenting electroencephalography wires reduces radiofrequency shielding artifacts in simultaneous electroencephalography and functional magnetic resonance imaging at 7 T

Affiliations

Segmenting electroencephalography wires reduces radiofrequency shielding artifacts in simultaneous electroencephalography and functional magnetic resonance imaging at 7 T

Thanh Phong Lê et al. Magn Reson Med. 2022 Sep.

Abstract

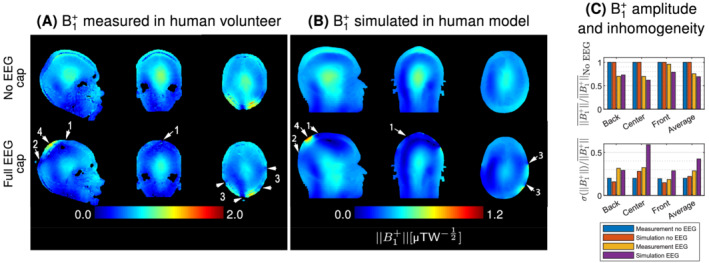
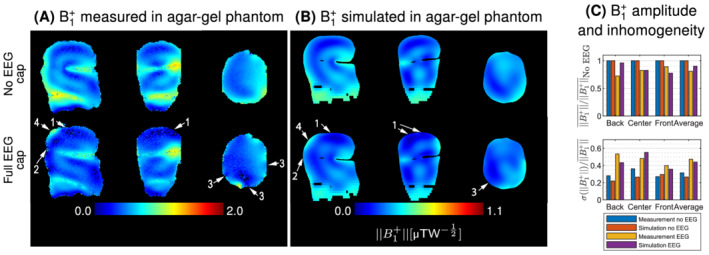
Purpose: Simultaneous scalp electroencephalography and functional magnetic resonance imaging (EEG-fMRI) enable noninvasive assessment of brain function with high spatial and temporal resolution. However, at ultra-high field, the data quality of both modalities is degraded by mutual interactions. Here, we thoroughly investigated the radiofrequency (RF) shielding artifact of a state-of-the-art EEG-fMRI setup, at 7 T, and design a practical solution to limit this issue.

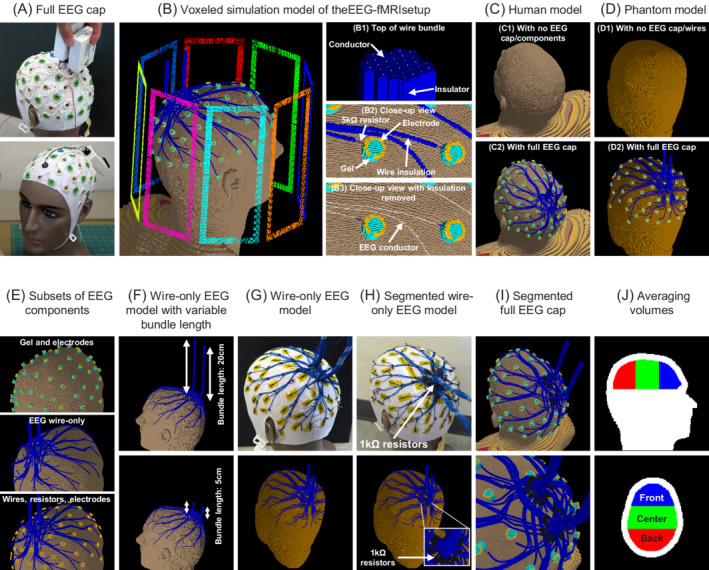
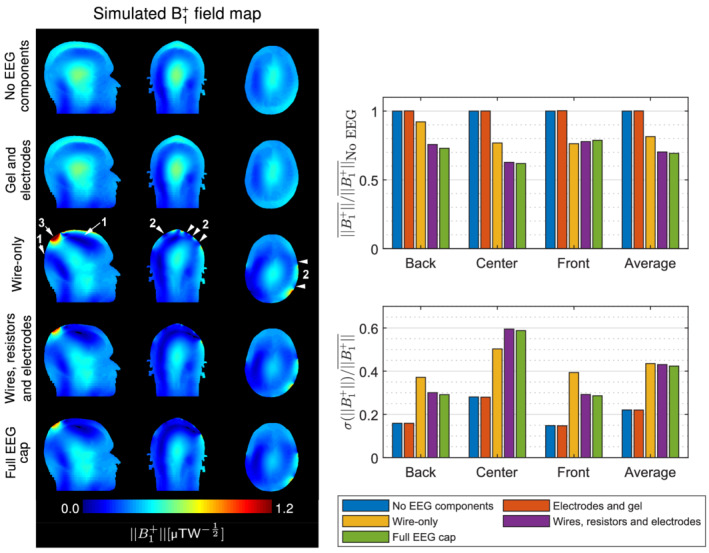
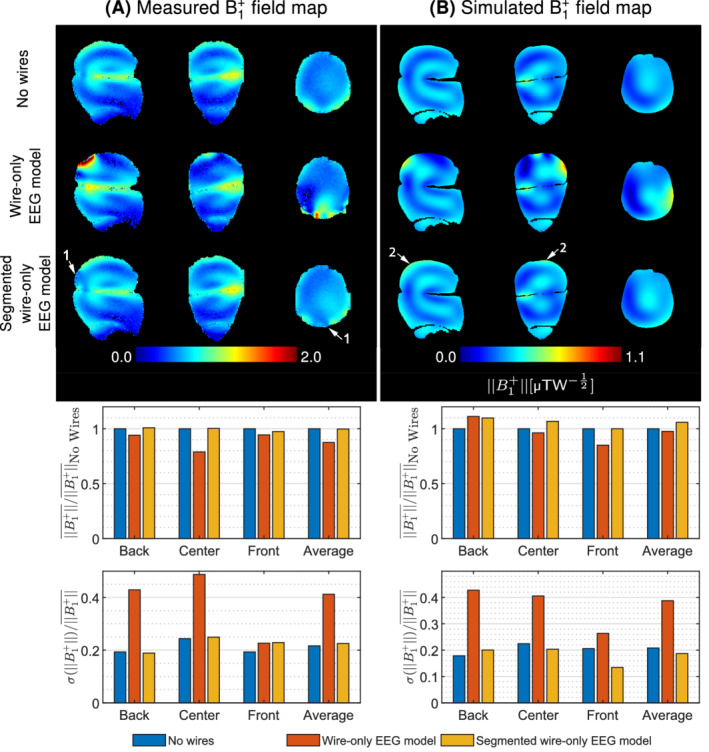
Methods: Electromagnetic field simulations and MR measurements assessed the shielding effect of the EEG setup, more specifically the EEG wiring. The effectiveness of segmenting the wiring with resistors to reduce the transmit field disruption was evaluated on a wire-only EEG model and a simulation model of the EEG cap.

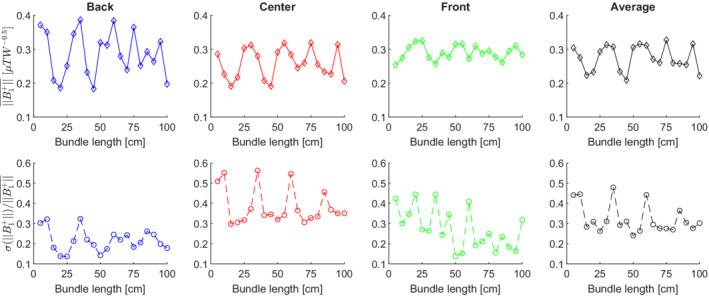
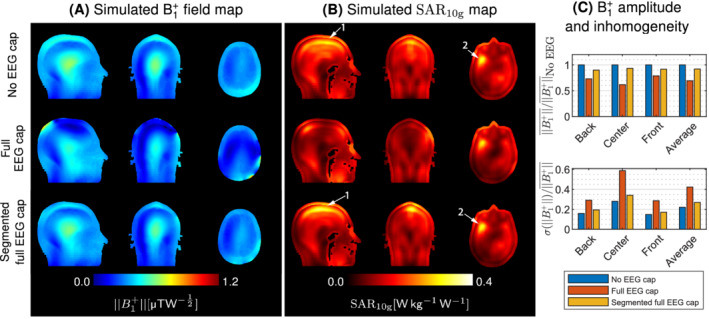
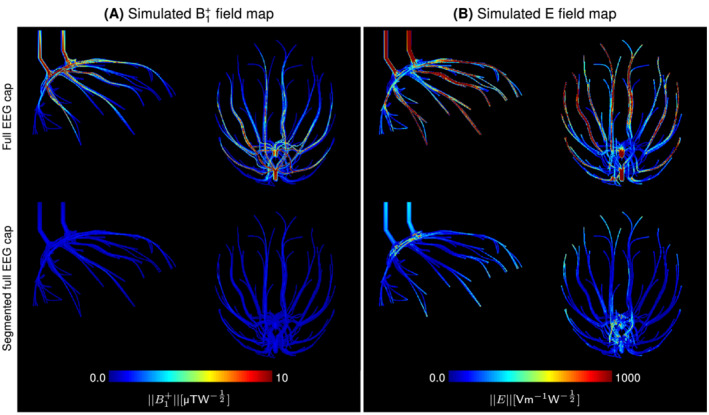
Results: The EEG wiring was found to exert a dominant effect on the disruption of the transmit field, whose intensity varied periodically as a function of the wire length. Breaking the electrical continuity of the EEG wires into segments shorter than one quarter RF wavelength in air (25 cm at 7 T) reduced significantly the RF shielding artifacts. Simulations of the EEG cap with segmented wires indicated similar improvements for a moderate increase of the power deposition.

Conclusion: We demonstrated that segmenting the EEG wiring into shorter lengths using commercially available nonmagnetic resistors is effective at reducing RF shielding artifacts in simultaneous EEG-fMRI. This prevents the formation of RF-induced standing waves, without substantial specific absorption rate (SAR) penalties, and thereby enables benefiting from the functional sensitivity boosts achievable at ultra-high field.

Keywords: 7T; EEG cap; EEG-fMRI; electromagnetic simulations; shielding artifacts; ultra-high field.


Figures

FIGURE 1
FIGURE 1
Experimental setups and simulation models. (A) commercial 64‐channel full electroencephalography (EEG) cap. (B) Voxeled simulation model of the EEG‐functional magnetic resonance imaging (fMRI) setup, including the 8‐loop RF coil, 64‐channel EEG cap and realistic human model. (B1) All EEG wires individually converge in two bundles located above the head. (B2) Electrodes are open‐ended and in electrical contact with the skin using a cylinder of conductive gel. A 5‐kΩ current‐limiting resistor connects the wire to the electrode. (B3) Within the wire insulation, each wire is modeled as a line of perfect electric conductor. (C,D) Simulation models without/with the full EEG cap on the human/phantom models. (E) Subsets of the EEG cap. (F) Simulation models with variable wire bundle length. The latter was measured between the scalp and the end of the EEG wires. (G) Wire‐only EEG model for the phantom measurement/simulation. (H) Segmented wire‐only EEG models. Each wire was split at the base of the wire bundle by a 1‐kΩ resistor and insulated with heat‐shrink tubing. (I) Segmented full EEG cap for electromagnetic simulations. (J) Regions of interest used for averaging the transmit field. Volumes were defined with the same thickness on the posterior‐anterior axis.
FIGURE 2
FIGURE 2
Transmit field maps measured in the human volunteer (A) and simulated in the human model (B) with and without the full electroencephalography (EEG) cap. For MR measurements, the transmit field was expressed as a fraction of the nominal flip angle, while electromagnetic simulation results are normalized to 1‐W input power. For visualization purposes, the scale for simulation results was arbitrarily adjusted such that the same color is applied to the B1+field value simulated at the center of the human model without EEG compared to the fraction of flip angle measured at the center of the human volunteer without EEG. The lower limit for both scales is zero. An identical colorscale was applied to both no EEG and EEG cases. In overall, a similar transmit field attenuation pattern was observed between measurements and simulations. Shielding artifacts were mostly visible in superior (arrows 1) and posterior (arrows 2) regions of the head, while the frontal region was less affected due to its lower wire density. Furthermore, local dropout regions are observed close to wires and electrodes (arrows 3). A strong B1+ is depicted close to the wire bundles (arrows 4). Overall, the B1+amplitude decreased by 24% and 31% with EEG in measurements and simulations respectively, while the inhomogeneity increased by 41% and 93% respectively, mostly affecting the back and center of the subject.
FIGURE 3
FIGURE 3
Transmit field maps measured and simulated in the agar‐gel phantom (A) and (B). Measured maps are expressed as a fraction of the nominal flip angle. For visualization purposes, the scale for simulation results was arbitrarily adjusted such that the same color is applied to the B1+field value simulated at the center of the agar‐gel phantom without electroencephalography (EEG) compared to the fraction of flip angle measured at the center of the agar‐gel phantom without EEG. The color scale remained identical between the results without and with EEG. Radiofrequency shielding artifacts mostly appear in superior (arrows 1) and posterior (arrows 2) regions of the phantom. In addition, EEG components cause localized dropout regions (arrows 3), as well as a strong B1+ close to the wire bundles (arrows 4). With EEG, the overall B1+amplitude decreased by 19% and 10% in measurements and simulations respectively, while the inhomogeneity increased by 50% and 65%, respectively.
FIGURE 4
FIGURE 4
Transmit field maps simulated with different subsets of electroencephalography (EEG) components normalized to 1‐W input power. An identical color scale was applied to all results. The averages were normalized to the values obtained without EEG components. No shielding artifacts were observed when the gel and electrodes were present alone. The EEG wiring alone produced most of radiofrequency shielding artifacts, particularly in posterior and superior regions of the head (arrows 1), local dropout regions near the scalp (arrows 2), and an amplified B1+at the base of the wire bundles (arrow 3). These artifacts became stronger upon addition of the current‐limiting resistors and electrodes.
FIGURE 5
FIGURE 5
In the wire‐only electroencephalography (EEG) model, the transmit field amplitude and inhomogeneity followed a periodic pattern as a function of the length of the wire bundle. The amplitude of the oscillation was strongest at the back of the head, where the wire density was highest, while no clear pattern was observed at the front with a lower wire density. The periodicity of the oscillations was approximately 25 cm, corresponding to a quarter of the radiofrequency wavelength at 7 T.
FIGURE 6
FIGURE 6
Transmit field maps acquired and simulated in the agar‐gel phantom with the wire‐only and segmented wire‐only electroencephalography (EEG) models. Measured maps are expressed as a fraction of the nominal flip angle. For visualization purposes, the scale for simulation results was arbitrarily adjusted to match the color at the center of the agar‐gel phantom between the measurement without EEG and the simulation without EEG. The color scale remained identical between the results with all three configurations. Strong B1+attenuation was observed in the presence of the wire‐only EEG model. Most of the shielding artifacts disappeared in the segmented wire‐only model, where each conductor was split by a 1‐kΩ resistor. In MR measurements, only slight shielding effects are remaining in superior and posterior regions (arrows 1), while a slightly stronger B1+is observed at the upper surface in simulations compared to no wires (arrows 2).
FIGURE 7
FIGURE 7
(A) B1+amplitude and SAR10g maps simulated in the human model, and normalized to 1‐W input power. With the segmented electroencephalography (EEG) cap, minor shielding artifacts were observed close to the scalp. (B) Most of the power deposition occurred in superior and anterior regions of the head (arrows 1 and 2), and slightly increased in the presence of the segmented EEG cap. (C) The segmented EEG cap model attenuated the B1+amplitude by only 8% in average compared to 31% with the original EEG cap.
FIGURE 8
FIGURE 8
Maximum intensity projection of the transmit field amplitude (A) and the electric field amplitude (B) within the electroencephalography (EEG) wiring insulation, in the simulations with both versions of the EEG cap. With the original EEG cap design, strong transmit and electric field was observed around the longest wires. After segmenting the wires, the transmit field amplitude within the wire insulation decreased from 1.43±2.33 to 0.27±0.27 μTW12, while the electric field amplitude was reduced from 321±531 to 73±94 Vm1W12.

Similar articles

Cited by

References

    1. Ogawa S, Lee TM, Kay AR, Tank DW. Brain magnetic resonance imaging with contrast dependent on blood oxygenation. Proc Natl Acad Sci. 1990;87:9868‐9872. - PMC - PubMed
    1. Debener S, Ullsperger M, Siegel M, Engel AK. Single‐trial EEG‐fMRI reveals the dynamics of cognitive function. Trends Cogn Sci. 2006;10:558‐563. - PubMed
    1. Herrmann CS, Debener S. Simultaneous recording of EEG and BOLD responses: a historical perspective. Int J Psychophysiol. 2008;67:161‐168. - PubMed
    1. Lemieux L, Salek‐Haddadi A, Josephs O, et al. Event‐related fMRI with simultaneous and continuous EEG: description of the method and initial case report. Neuroimage. 2001;14:780‐787. - PubMed
    1. Rosenkranz K, Lemieux L. Present and future of simultaneous EEG‐fMRI. MAGMA. 2010;23:309‐316. - PubMed

Publication types