

Using Facebook language to predict and describe excessive alcohol use
- PMID: 35575955
- PMCID: PMC9179895
- DOI: 10.1111/acer.14807
Using Facebook language to predict and describe excessive alcohol use
Abstract
Background: Assessing risk for excessive alcohol use is important for applications ranging from recruitment into research studies to targeted public health messaging. Social media language provides an ecologically embedded source of information for assessing individuals who may be at risk for harmful drinking.
Methods: Using data collected on 3664 respondents from the general population, we examine how accurately language used on social media classifies individuals as at-risk for alcohol problems based on Alcohol Use Disorder Identification Test-Consumption score benchmarks.
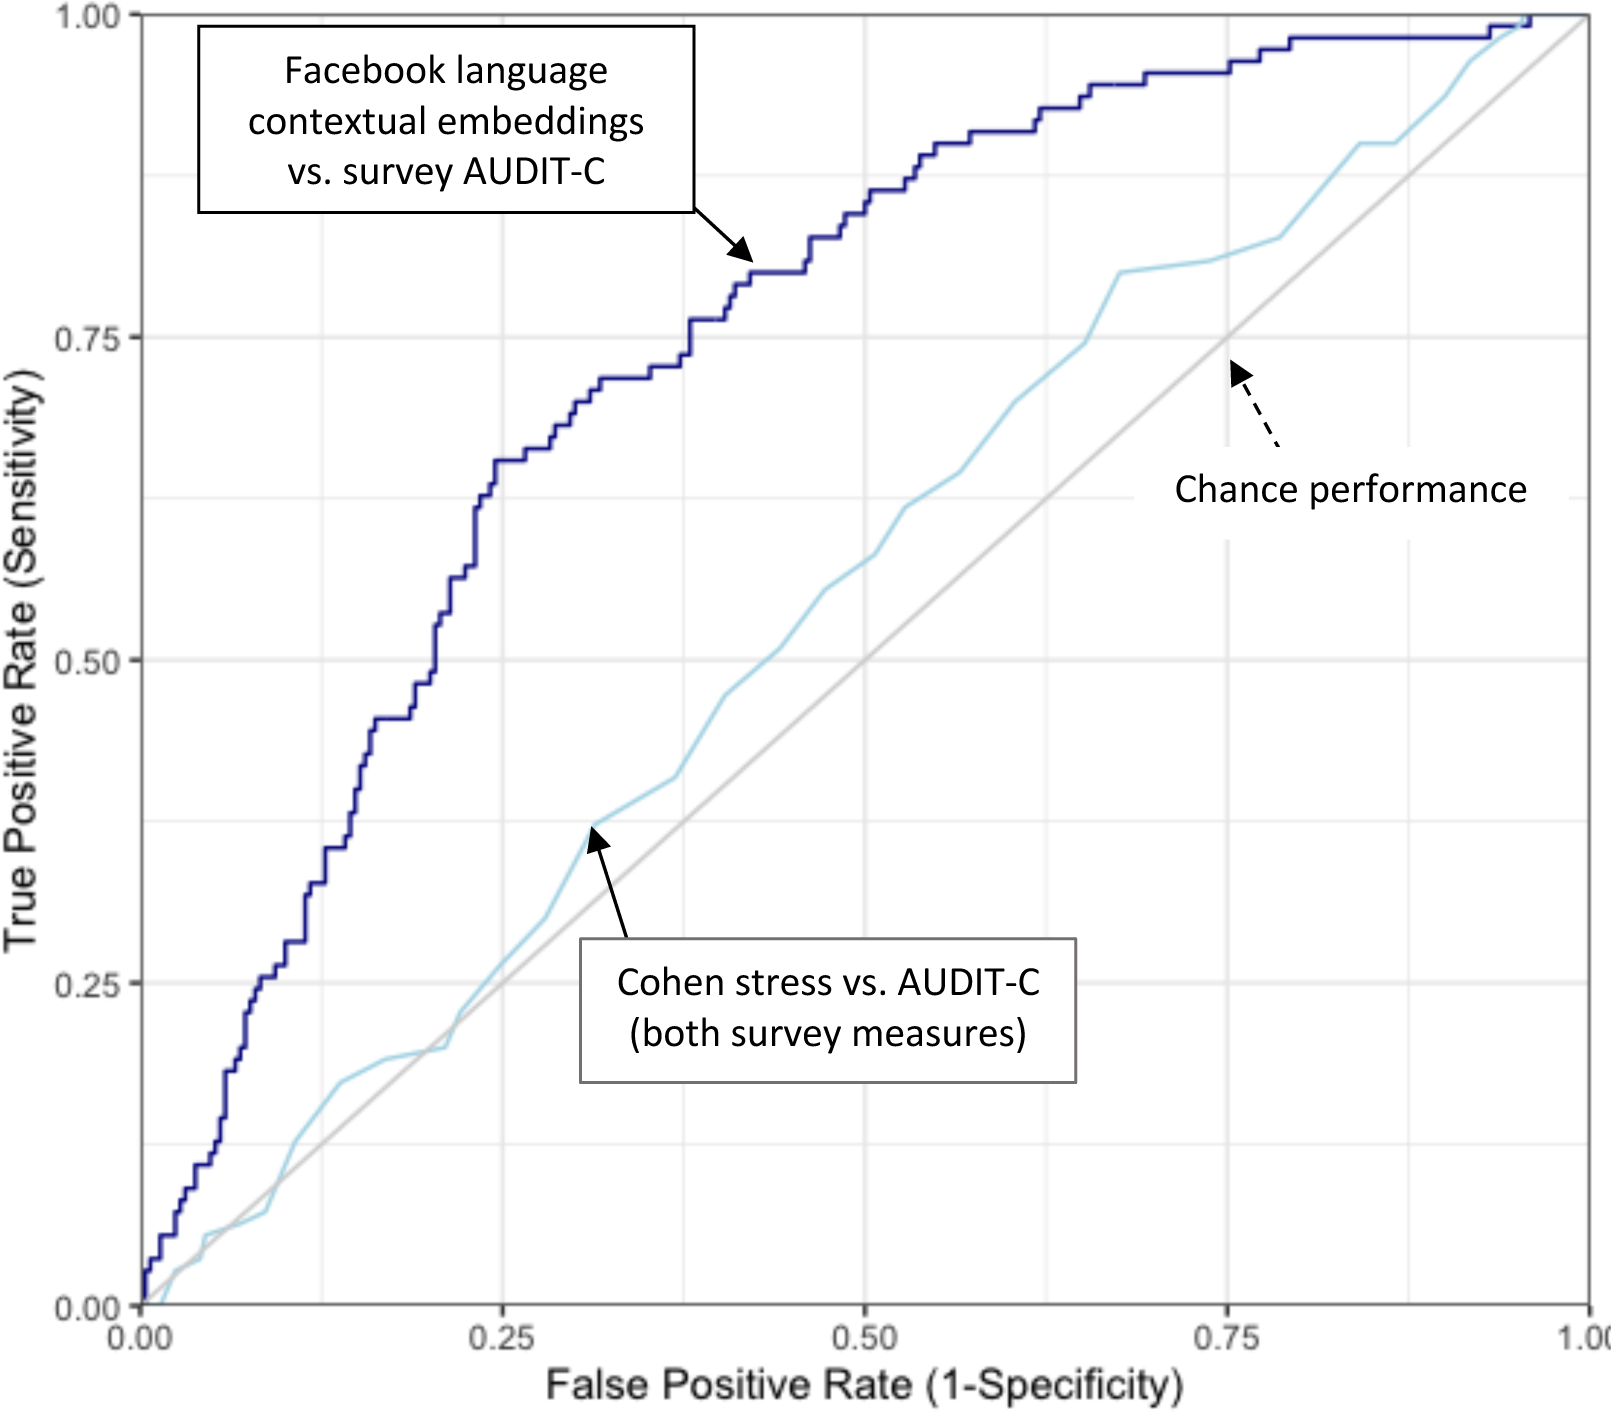
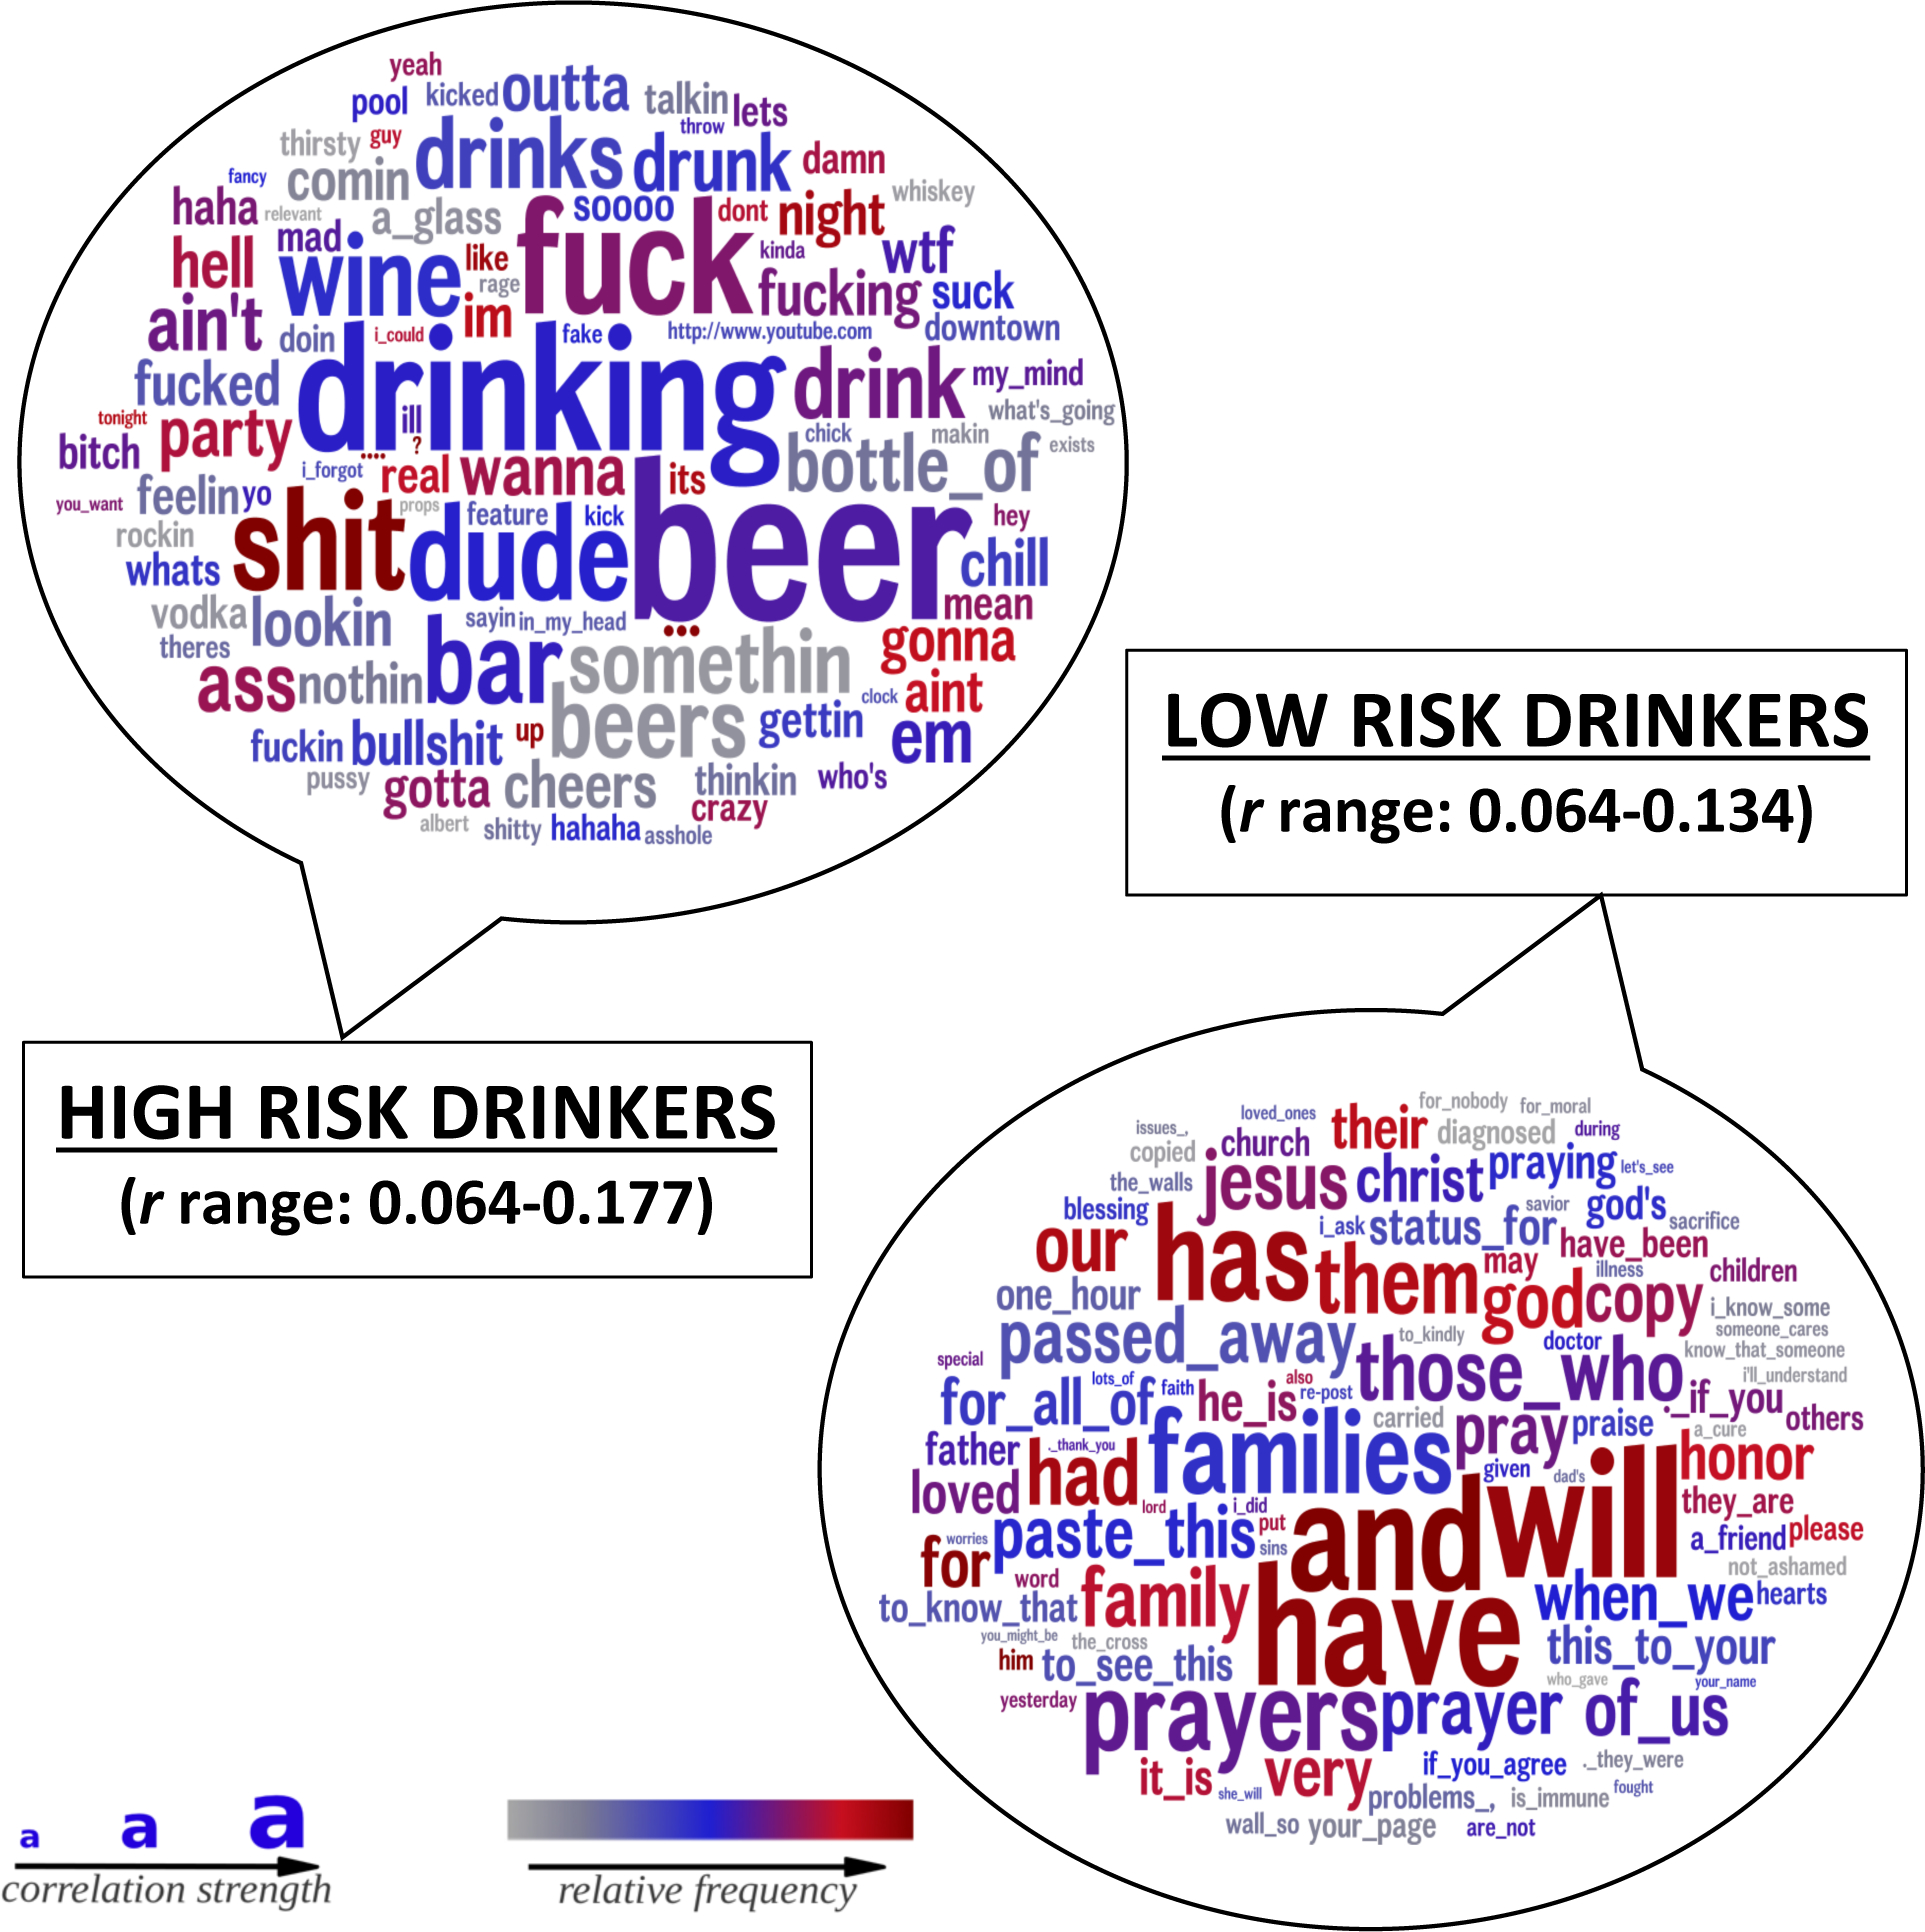
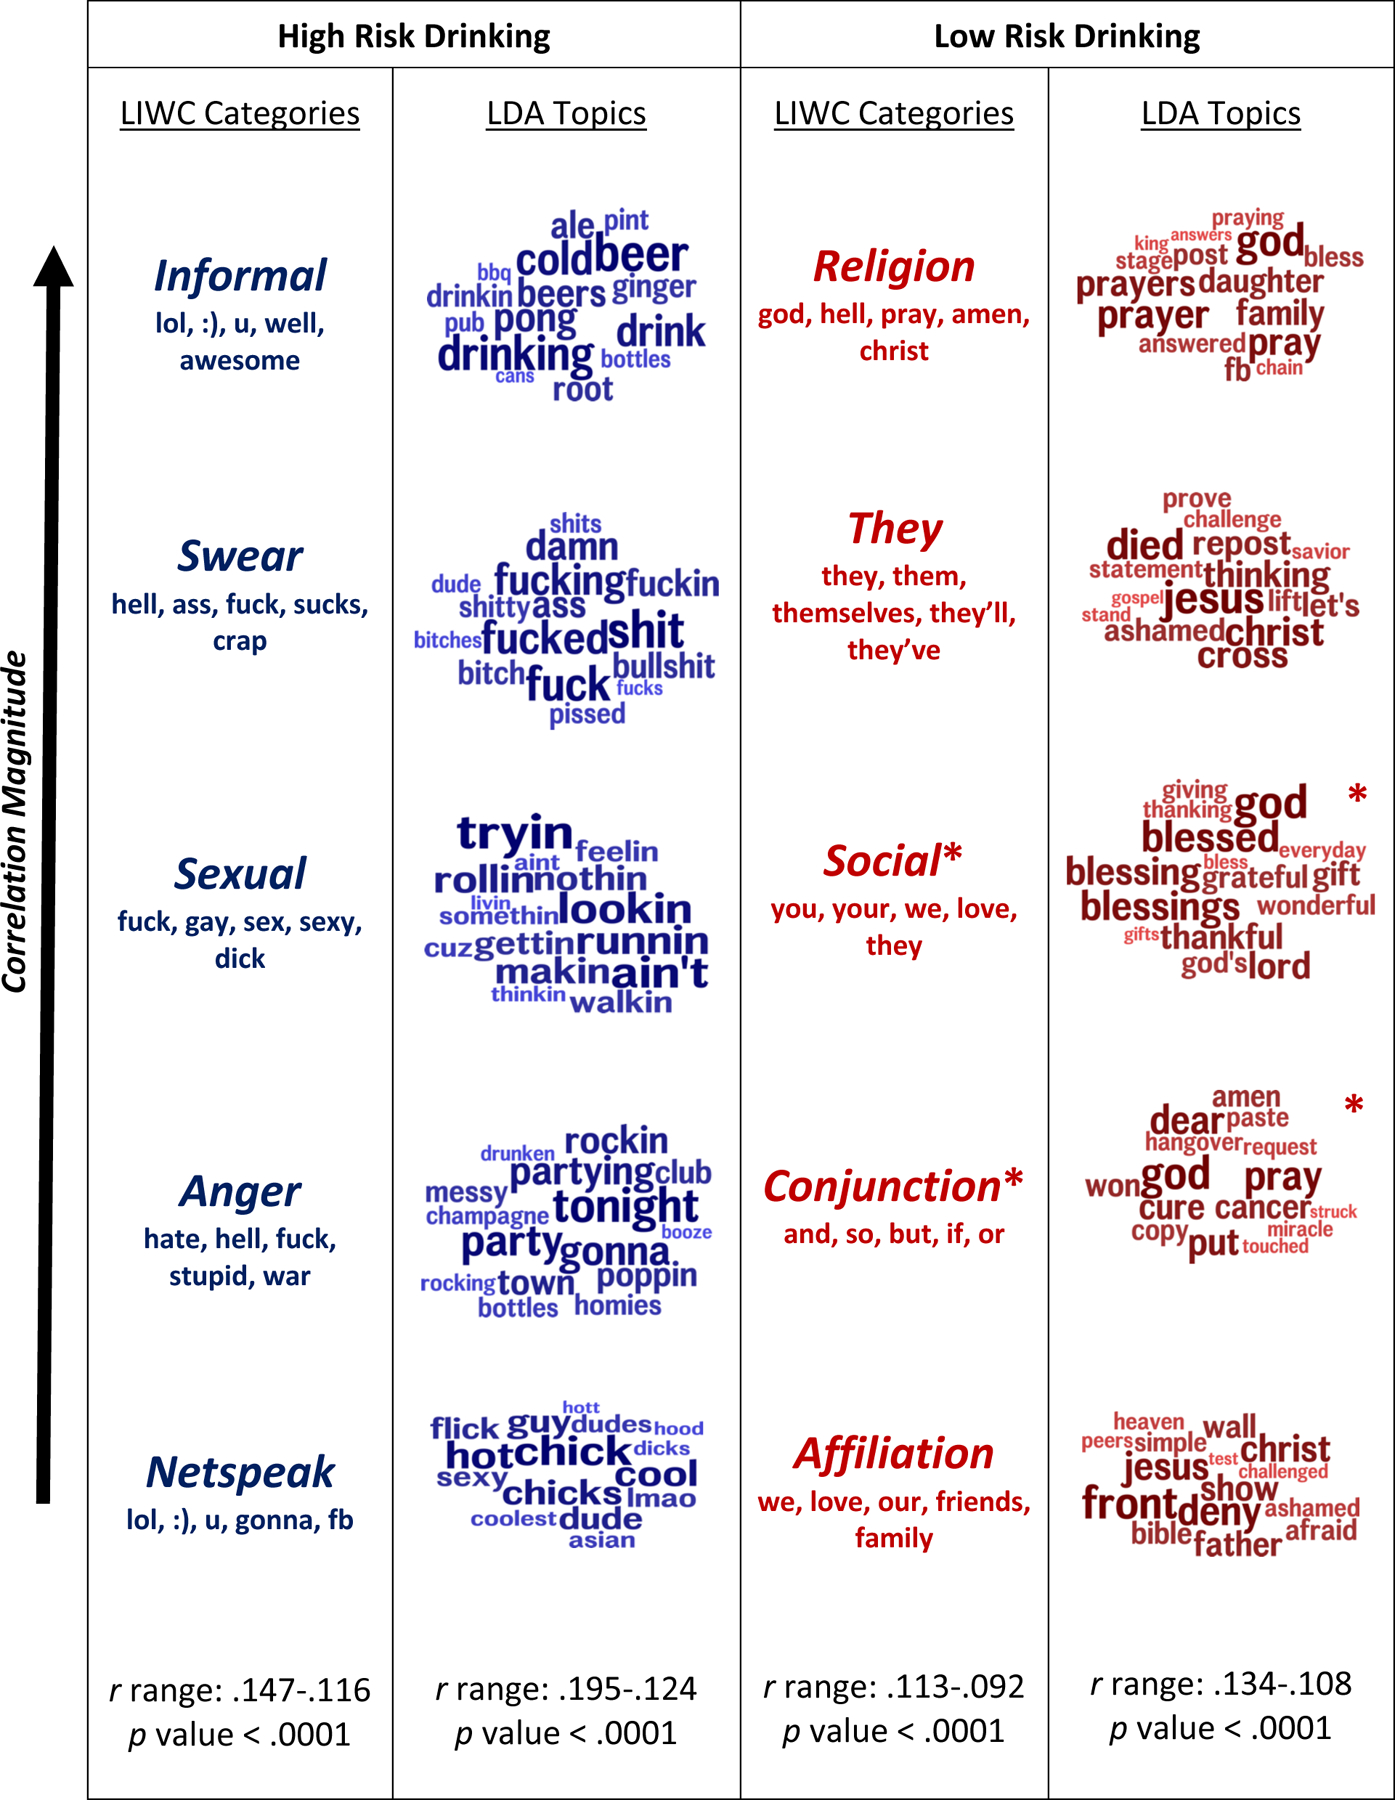
Results: We find that social media language is moderately accurate (area under the curve = 0.75) at identifying individuals at risk for alcohol problems (i.e., hazardous drinking/alcohol use disorders) when used with models based on contextual word embeddings. High-risk alcohol use was predicted by individuals' usage of words related to alcohol, partying, informal expressions, swearing, and anger. Low-risk alcohol use was predicted by individuals' usage of social, affiliative, and faith-based words.
Conclusions: The use of social media data to study drinking behavior in the general public is promising and could eventually support primary and secondary prevention efforts among Americans whose at-risk drinking may have otherwise gone "under the radar."
Keywords: excessive alcohol use; natural language processing; social media; subclinical drinking.
© 2022 by the Research Society on Alcoholism.
Figures
Similar articles
-
Meta-Analysis of the Association of Alcohol-Related Social Media Use with Alcohol Consumption and Alcohol-Related Problems in Adolescents and Young Adults.Alcohol Clin Exp Res. 2018 Jun;42(6):978-986. doi: 10.1111/acer.13642. Epub 2018 May 22. Alcohol Clin Exp Res. 2018. PMID: 29786874 Free PMC article.
-
Prevalence and characteristics of hazardous and harmful drinkers receiving general practitioners' brief advice on and support with alcohol consumption in Germany: results of a population survey.BMJ Open. 2022 Sep 27;12(9):e064268. doi: 10.1136/bmjopen-2022-064268. BMJ Open. 2022. PMID: 36167398 Free PMC article.
-
Can Twitter be used to predict county excessive alcohol consumption rates?PLoS One. 2018 Apr 4;13(4):e0194290. doi: 10.1371/journal.pone.0194290. eCollection 2018. PLoS One. 2018. PMID: 29617408 Free PMC article.
-
Resilience to Hazardous Drinking Among Never-Deployed Male United States Army Reserve and National Guard Soldiers.Alcohol Clin Exp Res. 2021 Mar;45(3):566-576. doi: 10.1111/acer.14561. Epub 2021 Feb 20. Alcohol Clin Exp Res. 2021. PMID: 33503277 Free PMC article.
-
Scoping review of assessment tools for, magnitudes of and factors associated with problem drinking in population-based studies.BMJ Open. 2024 Mar 8;14(3):e080657. doi: 10.1136/bmjopen-2023-080657. BMJ Open. 2024. PMID: 38458797 Free PMC article.
Cited by
-
Language-based EMA assessments help understand problematic alcohol consumption.PLoS One. 2024 Mar 6;19(3):e0298300. doi: 10.1371/journal.pone.0298300. eCollection 2024. PLoS One. 2024. PMID: 38446796 Free PMC article.
-
How developments in natural language processing help us in understanding human behaviour.Nat Hum Behav. 2024 Oct;8(10):1877-1889. doi: 10.1038/s41562-024-01938-0. Epub 2024 Oct 22. Nat Hum Behav. 2024. PMID: 39438680 Review.
-
The Relationship Between Alcohol-Related Content on Social Media and Alcohol Outcomes in Young Adults: A Scoping Review.Alcohol Res. 2025 Mar 27;45(1):04. doi: 10.35946/arcr.v45.1.04. eCollection 2025. Alcohol Res. 2025. PMID: 40171547 Free PMC article.
-
GPT is an effective tool for multilingual psychological text analysis.Proc Natl Acad Sci U S A. 2024 Aug 20;121(34):e2308950121. doi: 10.1073/pnas.2308950121. Epub 2024 Aug 12. Proc Natl Acad Sci U S A. 2024. PMID: 39133853 Free PMC article.
-
Predicting U.S. county opioid poisoning mortality from multi-modal social media and psychological self-report data.Sci Rep. 2023 Jun 3;13(1):9027. doi: 10.1038/s41598-023-34468-2. Sci Rep. 2023. PMID: 37270657 Free PMC article.
References
-
- Akbik A, Bergmann T, Vollgraf R (2019) Pooled contextualized embeddings for named entity recognition, in: Proceedings of the 2019 Conference of the North American Chapter of the Association for Computational Linguistics: Human Language Technologies. pp. 724–728.
-
- Baan R, Straif K, Grosse Y, Secretan B, El Ghissassi F, Bouvard V, Altieri A, Cogliano V (2007) Carcinogenicity of alcoholic beverages. Lancet Oncol 8:292–293. - PubMed
-
- Blank G, Lutz C (2017) Representativeness of social media in Great Britain: Investigating Facebook, LinkedIn, Twitter, Pinterest, Google+, and Instagram. Am Behav Sci 61:741–756.
-
- Blei DM, Ng AY, Jordan MI (2003) Latent Dirichlet Allocation. J Mach Learn Res 3:993–1022.
MeSH terms
Grants and funding
LinkOut - more resources
Full Text Sources
Medical
