. 2022 May 16;20(5):e3001636.
doi: 10.1371/journal.pbio.3001636. eCollection 2022 May.

The structural context of posttranslational modifications at a proteome-wide scale

Affiliations

The structural context of posttranslational modifications at a proteome-wide scale

Isabell Bludau et al. PLoS Biol. .

Abstract

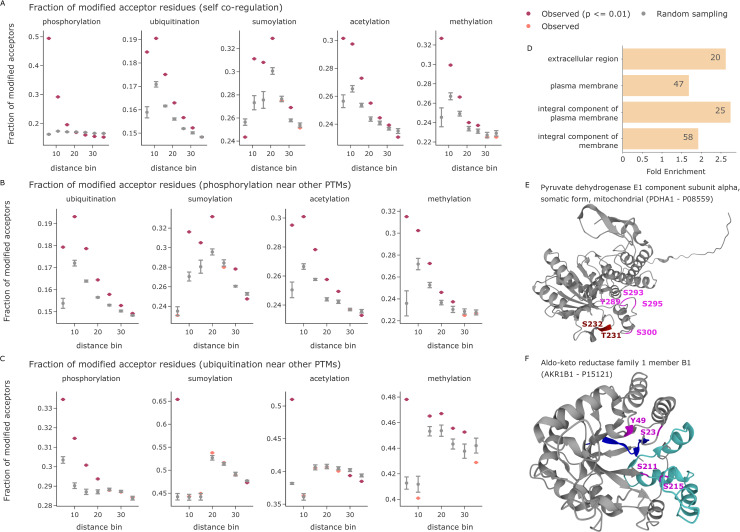
The recent revolution in computational protein structure prediction provides folding models for entire proteomes, which can now be integrated with large-scale experimental data. Mass spectrometry (MS)-based proteomics has identified and quantified tens of thousands of posttranslational modifications (PTMs), most of them of uncertain functional relevance. In this study, we determine the structural context of these PTMs and investigate how this information can be leveraged to pinpoint potential regulatory sites. Our analysis uncovers global patterns of PTM occurrence across folded and intrinsically disordered regions. We found that this information can help to distinguish regulatory PTMs from those marking improperly folded proteins. Interestingly, the human proteome contains thousands of proteins that have large folded domains linked by short, disordered regions that are strongly enriched in regulatory phosphosites. These include well-known kinase activation loops that induce protein conformational changes upon phosphorylation. This regulatory mechanism appears to be widespread in kinases but also occurs in other protein families such as solute carriers. It is not limited to phosphorylation but includes ubiquitination and acetylation sites as well. Furthermore, we performed three-dimensional proximity analysis, which revealed examples of spatial coregulation of different PTM types and potential PTM crosstalk. To enable the community to build upon these first analyses, we provide tools for 3D visualization of proteomics data and PTMs as well as python libraries for data accession and processing.


Conflict of interest statement

The authors have declared that no competing interests exist.

Figures

Fig 1
Fig 1. Estimation of amino acid side chain exposure and IDRs.
(A) AlphaFold predicted structure of MAPK3 colored by prediction confidence (pLDDT, left), colored by our pPSE metric using a radius of 12 Å and an angle of 70° (center), and colored by our prediction of structured regions and IDRs (right). (B) ROC curve for predicting IDRs based on IUPred2 in comparison to the smoothed pLDDT confidence scores from AlphaFold, the smoothed RSAs, and the pPSE with (+) and without (w/o) considering the PAE (radius = 24 Å, angle = 70°). (C) Corresponding AUC values and the TPRs at a 5% FPR. The numbers in square brackets behind each metric indicate the smoothing windows that were used; see S1 Fig for a comprehensive parameter screen. Source data for (B) and (C) are available at Github. AUC, area under the curve; FPR, false positive rate; IDR, intrinsically disordered region; MAPK3, mitogen-activated protein kinase 3; PAE, predicted aligned error; pPSE, prediction-aware part-sphere exposure; ROC, receiver operating characteristice; RSA, relative solvent accessible surface area; TPR, true positive rate.
Fig 2
Fig 2. Enrichment analysis of PTMs in IDRs.
(A) Enrichment of different PTMs annotated in the PhosphoSitePlus database in IDRs (left). Enrichment of ubiquitinated lysines annotated in PhosphoSitePlus versus ubiquitinations detected in a dataset treated with proteasome inhibitor or untreated (right) [4]. PTMs are abbreviated as follows: phosphorylations (p), ubiquitinations (ub), sumoylations (sm), acetylations (ac), methylations (m), and the glycosylations O-GlcNAc (gl) and O-GalNAc (ga). Source data are available at Github. (B) Overview of datasets that contribute ubiquitination sites to PhosphoSitePlus. Publications reporting >1,000 ubiquitination sites are listed separately and are colored based on their use of proteasome inhibitors. The additional 677 studies that contribute fewer ubiquitination sites were aggregated to a gray bar irrespective of their use of proteasome inhibitors. Source data are available at Github. (C) AlphaFold predicted structure of Ras GTPase-activating protein-binding protein 2 (G3BP2) colored by structured regions (blue) and predicted IDRs (gray) as well as ubiquitination sites annotated in PhosphoSitePlus (yellow). IDR, intrinsically disordered region; PTM, posttranslational modification.
Fig 3
Fig 3. Exploiting the 3D context of kinase phosphorylation motifs.
(A) Enrichment of phosphorylation events in kinase motifs compared to all possible STY sites. PSP stands for PhosphoSitePlus. Source data are available at Github. (B) Enrichment of phosphorylations in kinase motifs within IDRs compared to all possible kinase motif occurrences. Source data are available at Github. (C) Enrichment of phosphorylations in IDRs compared to all possible STY sites. The phosphosites reported by Sugiyama and colleagues [26] were filtered for sites also reported in PSP or by Stukalov and colleagues [25]. Source data are available at Github. (D) Sequence logos for different kinases in context of the dataset from Sugiyama and colleagues [26]. Motifs for phosphosites of high exposure (pPSE ≤ 5) are shown on the left and phosphosites of low exposure (pPSE > 5) are shown on the right. The PSSMSearch tool [27] was used with a log odds scoring method [28]. IDR, intrinsically disordered region; pPSE, prediction-aware part-sphere exposure; PSP, PhosphoSitePlus.
Fig 4
Fig 4. Regulatory PTMs accumulate in short IDRs.
(A) Enrichment analysis of proteins with short IDRs. Source data are available at Github. (B) Enrichment of regulatory phosphosites from PSP in short IDRs compared to all other IDRs. Source data are available at Github and Github, respectively. (C) Sequence plot showing the N- to C-terminus of different proteins colored by whether the amino acid is part of a structured region (blue) or an IDR (gray). All phosphosites annotated in PSP are indicated by circles. Regulatory sites are colored in dark red and stand out higher than nonregulatory sites (salmon). Regions of short IDRs including a 5-amino acid extension are indicated in light green below the sequence. Annotated kinase activation loops (A-loops) from KinaseMD are indicated in dark green above the sequence. The predicted structures of RIPK2 (D) and MAP4K1 (E) are colored by structured regions (blue) and predicted IDRs (gray) as well as known regulatory phosphosites annotated in PSP (dark red). Specific regions of interest are highlighted by an orange circle. (F) The predicted structure of SLC22A6 is colored by structured regions (blue) and predicted IDRs (gray) as well as known regulatory ubiquitination sites annotated in PSP (yellow). (G) Overview of phosphorylations (left) and other PTMs (right) that lie within short disordered regions or their flanking 5 AAs. Source data are available at Github. AA, amino acid; IDR, intrinsically disordered region; MAP4K1, mitogen-activated protein kinase kinase kinase kinase 1; PSP, PhosphoSitePlus; PTM, posttranslational modification; RIPK2, receptor-interacting serine/threonine-protein kinase 2.
Fig 5
Fig 5. PTM proximity analysis in 3D.
(A) The fraction of modified PTM acceptor residues is shown as a function of the 3D distance to a given modified amino acid in Å. Observed values (indicated in red when statistically significant and colored in salmon otherwise) are compared to the mean of 5 random samples including the same number of modified PTM sites (gray). Error bars indicate one standard deviation. The x-axes are divided in distance bins ranging from each previous bin to the indicated cutoff in Å. Source data are available at Github. (B) The fraction of modified phospho-acceptor residues is shown as function of the 3D distance to a given modified amino acid in Å. Source data are available at Github. (C) The fraction of ubiquitinated lysines is shown as function of the 3D distance to a given modified amino acid in Å. The smallest bin shows competition for the same central lysine residue. Source data are available at Github. (D) Enrichment analysis of proteins with 3D phospho- and/or ubiquitination clusters (FDR ≤ 0.01). Source data are available at Github. (E) The predicted structure of PDHA1. Phosphorylations on the phospho-loop A are indicated in dark red (T231 and S232). The phosphorylations on phospho-loop B are indicated in magenta (Y289, S293, S295, and S300) [36]. (F) The predicted structure of AKR1B1. Residues annotated as NADP binding sites are highlighted in blue (amino acids 10 to 19) and turquoise (amino acids 211 to 273). Phosphorylations are indicated in magenta. AKR1B1, aldo-keto reductase family 1 member B1; PDHA1, pyruvate dehydrogenase E1 component subunit alpha; PTM, posttranslational modification.

Comment in

References

    1. Aebersold R, Mann M. Mass spectrometry-based proteomics. Nature. 2003;422:198. doi: 10.1038/nature01511 - DOI - PubMed
    1. Aebersold R, Mann M. Mass-spectrometric exploration of proteome structure and function. Nature. 2016;537:347. doi: 10.1038/nature19949 - DOI - PubMed
    1. Bekker-Jensen DB, Bernhardt OM, Hogrebe A, Martinez-Val A, Verbeke L, Gandhi T, et al.. Rapid and site-specific deep phosphoproteome profiling by data-independent acquisition without the need for spectral libraries. Nat Commun. 2020;11. doi: 10.1038/s41467-020-14609-1 - DOI - PMC - PubMed
    1. Hansen FM, Tanzer MC, Brüning F, Bludau I, Stafford C, Schulman BA, et al.. Data-independent acquisition method for ubiquitinome analysis reveals regulation of circadian biology. Nat Commun. 2021;12. doi: 10.1038/s41467-020-20509-1 - DOI - PMC - PubMed
    1. Sharma K, D’Souza RCJ, Tyanova S, Schaab C, Wiśniewski JR, Cox J, et al.. Ultradeep human phosphoproteome reveals a distinct regulatory nature of Tyr and Ser/Thr-based signaling. Cell Rep. 2014;8:1583–94. doi: 10.1016/j.celrep.2014.07.036 - DOI - PubMed

Publication types