. 2022 May 24;119(21):e2116169119.
doi: 10.1073/pnas.2116169119. Epub 2022 May 16.

Estimating eviction prevalence across the United States

Affiliations

Estimating eviction prevalence across the United States

Ashley Gromis et al. Proc Natl Acad Sci U S A. .

Abstract

SignificanceSeveral negative effects of forced displacement have been well documented, yet we lack reliable measurement of eviction risk in the national perspective. This prevents accurate estimations of the scope and geography of the problem as well as evaluations of policies to reduce housing loss. We construct a nationwide database of eviction filings in the United States. Doing so reveals that 2.7 million households, on average, are threatened with eviction each year; that the highest eviction filing rates are not concentrated solely in high-cost urban areas; and that state-level housing policies are strongly associated with county-level eviction filing risk. These data facilitate an expanded research agenda on the causes and consequences of eviction lawsuits in the United States.

Keywords: eviction; housing policy; residential inequality.


Conflict of interest statement

The authors declare no competing interest.

Figures
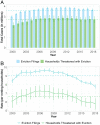
Fig. 1.
Fig. 1.
Prevalence of eviction filings and households threatened with eviction in the United States, 2000 to 2018. (A) Annual eviction case filings and households that received at least one eviction filing and (B) rates of filings and households threatened with eviction per renting households. n = 3,143 counties annually; 59,717 total county years. Error bars show 95% credible interval. Respective averages across years are shown by dotted lines. Number of renting households are estimated using linear interpolation between 2000 and 2010 censuses and 2016 Environmental Systems Research Institute (ESRI) Business Analyst. Similar trends were observed when using 1-y American Community Survey tenure estimates (SI Appendix, Fig. S2).
Fig. 2.
Fig. 2.
Percentage change in eviction filings and number of renting households by state, 2018. Percentage change in cases filed and renting households calculated in comparison to their respective numbers in 2000. The data point for the United States (shown in purple) reflects the longitudinal trend in Fig. 1A; filing counts increased 21.5% from 2000 to 2018, but the number of renting households increased 31.5% during the same period (SI Appendix, Fig. S3). This explains why the total number of filings has increased between 2000 and 2018 but the 2018 filing rate is lower than that reported for 2000 (Fig. 1B). For demonstration of these changes across the 2000 to 2018 period, annual case filings are plotted against number of renting households for the United States in SI Appendix, Fig. S4.
Fig. 3.
Fig. 3.
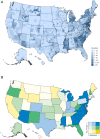
Geography of eviction filings, 2018. (A) County-level filing rates demonstrated noticeable disparities across state lines, with the highest rates clustered in the Southeast. (B) Most states are located on the diagonal of the bivariate association between filings adjusted for sociodemographic conditions and repeated filings against the same household (shown by tertiles), demonstrating the strong association between repeated filings and increased state-level risk of filings. Adjusted filing counts for a comparable county in each state are shown in SI Appendix, Fig. S10 and percent repeated filings against households is shown in SI Appendix, Fig. S11.
Fig. 4.
Fig. 4.
Percentage reduction in eviction filing rate associated with length of notice required before eviction filing for nonpayment of rent. (A) The first model (“County Demographics”) includes the county-level sociodemographic covariates used in the Bayesian model to estimate case filings (n = 3,074 county years). (B) The second model (“County Demographics and State Policy”) includes the county-level covariates plus three additional controls for state-level policy environment (n = 3,074 county years). (C) The third model (“Located on the State Border”) includes the county- and state-level covariates, but restricts the sample to counties located directly on the state border (n = 2,329 county years). (D) The fourth model (“Within 25 Miles of State Border”) includes the county- and state-level covariates, but restricts the sample to counties with population centers located within 25 miles of the state border (n = 2,551 county years). Coefficients used to generate the figure are shown in SI Appendix, Table S9.

References

    1. Hartman C., Robinson D., Evictions: The hidden housing problem. Hous. Policy Debate 14, 461–501 (2003).
    1. Greenberg D., Gershenson C., Desmond M., Discrimination in evictions: Empirical evidence and legal challenges. Harv. C.R.-C.L. L. Rev. 51, 115–158 (2016).
    1. Weitzman B. C., Knickman J. R., Shinn M., Pathways to homelessness among New York City families. J. Soc. Issues 46, 125–140 (1990).
    1. Desmond M., Kimbro R. T., Eviction’s fallout: Housing, hardship, and health. Soc. Forces 94, 295–324 (2015).
    1. Fowler K. A., Gladden R. M., Vagi K. J., Barnes J., Frazier L., Increase in suicides associated with home eviction and foreclosure during the US housing crisis: Findings from 16 National Violent Death Reporting System States, 2005-2010. Am. J. Public Health 105, 311–316 (2015). - PMC - PubMed

Publication types

LinkOut - more resources