. 2022 May;42(5):220-234.
doi: 10.1089/jir.2021.0214.

Immune-Related Biomarkers Associated with Lung Metastasis from the Colorectal Cancer Microenvironment

Affiliations

Immune-Related Biomarkers Associated with Lung Metastasis from the Colorectal Cancer Microenvironment

Wang Da et al. J Interferon Cytokine Res. 2022 May.

Abstract

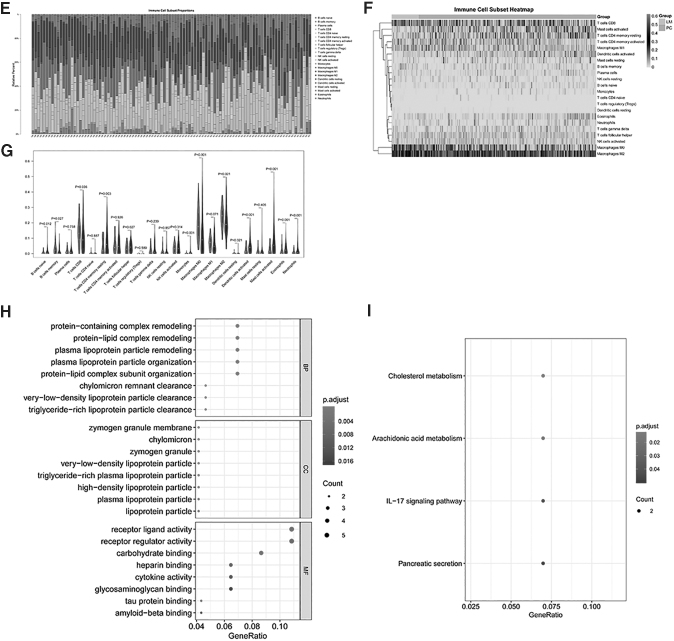
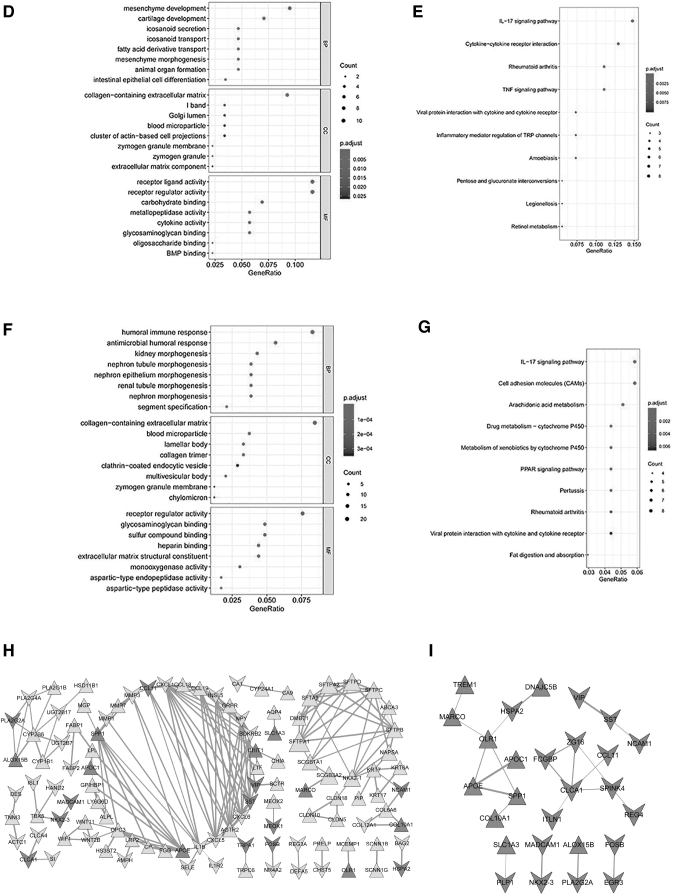
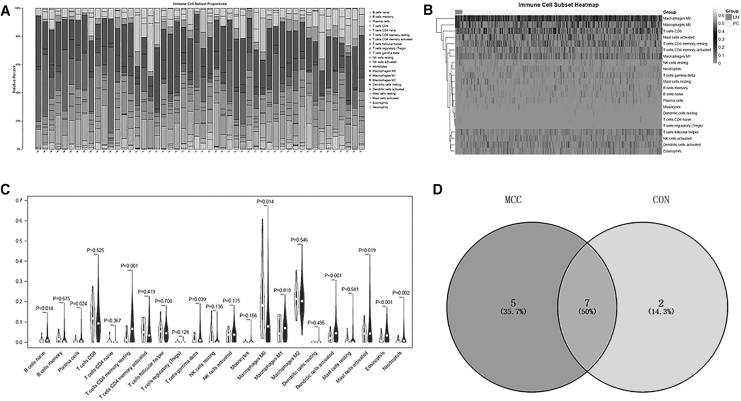
Immune-associated biomarkers can predict lung metastases from colorectal cancer. Differentially expressed genes (DEGs) were screened from sample data extracted from gene expression omnibus (GEO) database. The DEGs were screened from the lung metastasis (LM) and primary cancer (PC) groups of the Moffitt Cancer Center cohort dataset. Then, the tumor immune microenvironment and abundance of immune cell infiltration analyses were performed, and the immune-related DEGs were retrieved. In addition, the transcription factor (TF)-miRNA-mRNA network was constructed and enrichment analyses of the immune-related DEGs and upregulated and downregulated DEGs were carried out. Then, the protein-protein interaction (PPI) network was conducted and the drug-gene interaction was predicted. A total of 268 DEGs were screened. The Immune_Score of samples in the LM group was significantly higher compared with the PC group. The infiltration ratio of M0 macrophages and M2 macrophages of samples was higher than others. A total of 54 immune-related DEGs in M0 macrophages were screened. Moreover, the TF-miRNA-mRNA network was constructed among 8 miRNA-mRNA and 50 TF-mRNA, and the secreted phosphoprotein 1 was regulated by 12 TFs, and the oxidized low-density lipoprotein receptor 1 was regulated by 3 miRNAs and 3 TFs. The TF SAM pointed domain containing ETS TF was also a downregulated DEG. The Kyoto Encyclopedia of Genes and Genomes pathway analysis showed that the DEGs in the TF-miRNA-mRNA network were mainly involved in the interleukin-7 signaling pathway and cell adhesion molecules. In total, 23 protein interactions in this PPI network of M0 macrophage cells were involved in 27 mRNAs. There were 38 drug-gene interactions of immune-related DEGs of M0 macrophage cells predicted to contain 34 small molecule drugs and 8 mRNAs. Finally, the CON cohort dataset verified that the infiltration ratio of M0 and M2 macrophages of the samples was higher.

Keywords: colorectal cancer; differentially expressed genes; drug–gene interaction; immune cell infiltration; immune-related differentially expressed genes; lung metastasis.


Conflict of interest statement

No competing financial interests exist.

Figures

FIG. 1.
FIG. 1.
The flow chart of this study.
FIG. 2.
FIG. 2.
The DEGs between the LM and PC groups of the MCC cohort dataset. GSE131418 from the GEO database was extracted. The sample data of the MCC cohort were extracted as the discovery group and the sample data of the CON cohort were extracted as the verify group. To observe the distribution of the expression and grouping of samples, a box plot and principal component analysis diagram were constructed through the FactoMineR package of R language. The classical Bayesian modified T-test and provided limma package of R language were applied to screen the DEGs between the LM and PC groups, and the screening criteria were |logFC| > 1 and P < 0.05. A total of 268 DEGs were obtained, containing 173 upregulated and 95 downregulated DEGs. (A) The box plot of samples of the MCC cohort dataset; (B) the box plot of samples of the CON cohort dataset; (C) the principal component analysis diagram of the samples of the MCC cohort dataset; (D) the principal component analysis diagram of the samples of the CON cohort dataset; (E) the principal component analysis diagram of the total samples. (F) Heat map of the DEGs; (G) volcano plot of the DEGs. CON, Consortium; DEGs, differentially expressed genes; GEO, Gene Expression Omnibus; LM, lung metastasis; MCC, Moffitt Cancer Center; PC, primary cancer.
FIG. 3.
FIG. 3.
Immune score calculation and immune cytolysis activity score of the MCC cohort dataset. The Stromal_score, Immune_Score, and ESTIMATE_score of all samples were calculated with the ESTIMATE arithmetic, and a box plot was drawn through the ggpubr package of R language. The DEGs and infiltrating abundance of the differentially immune cell subsets of the LM and PC groups were subjected to a Spearman's correlation test through the corrplot package of R language. DEGs with a threshold value of |r| > 0.3 and P < 0.05 were considered immune related. According to the immune-related DEGs, the clusterProfiler package of R language was used to perform GO and KEGG pathway enrichment analyses with the cutoff of P < 0.05 and count ≥2. (A) The box plot of the Stromal_score among the LM and PC groups; (B) the box plot of the Immune_Score among the LM and PC groups; (C) the box plot of the ESTIMATE_score among LM and PC groups; (D) the box plot of the cytolysis activity score. (E) Landscape of the immune cell infiltration of the 57 PCs and 43 LM cancers samples; (F) heat map of the 22 types of immune cell infiltration; (G) violin plot of the 22 types of immune cell infiltration; (H) the top 8 terms of GO analysis of immune-related DEGs; (I) the top 8 terms of KEGG analysis of immune-related DEGs. BP, biological processes; CCs, cellular components; GO, gene ontology; KEGG, Kyoto Encyclopedia of Genes and Genomes; MF, molecular function.
FIG. 3.
FIG. 3.
Immune score calculation and immune cytolysis activity score of the MCC cohort dataset. The Stromal_score, Immune_Score, and ESTIMATE_score of all samples were calculated with the ESTIMATE arithmetic, and a box plot was drawn through the ggpubr package of R language. The DEGs and infiltrating abundance of the differentially immune cell subsets of the LM and PC groups were subjected to a Spearman's correlation test through the corrplot package of R language. DEGs with a threshold value of |r| > 0.3 and P < 0.05 were considered immune related. According to the immune-related DEGs, the clusterProfiler package of R language was used to perform GO and KEGG pathway enrichment analyses with the cutoff of P < 0.05 and count ≥2. (A) The box plot of the Stromal_score among the LM and PC groups; (B) the box plot of the Immune_Score among the LM and PC groups; (C) the box plot of the ESTIMATE_score among LM and PC groups; (D) the box plot of the cytolysis activity score. (E) Landscape of the immune cell infiltration of the 57 PCs and 43 LM cancers samples; (F) heat map of the 22 types of immune cell infiltration; (G) violin plot of the 22 types of immune cell infiltration; (H) the top 8 terms of GO analysis of immune-related DEGs; (I) the top 8 terms of KEGG analysis of immune-related DEGs. BP, biological processes; CCs, cellular components; GO, gene ontology; KEGG, Kyoto Encyclopedia of Genes and Genomes; MF, molecular function.
FIG. 4.
FIG. 4.
Construction of the TF-miRNA-mRNA and PPI network network of immune-related DEGs of M0 macrophage cells. To analyze the TF-miRNA-mRNA network, the miRNAs of the immune-related DEGs were predicted. To analyze the interactions between proteins and proteins encoded by DEGs, the STRING database was utilized to analyze their interactions. (A) The TF-miRNA-mRNA network; (B) the top 8 terms of the GO analysis of upregulated DEGs; (C) the top 8 terms of the KEGG pathway analysis of upregulated DEGs; (D) the top 8 terms of the GO analysis of downregulated DEGs; (E) the top 10 terms of the KEGG pathway analysis of downregulated DEGs; (F) the top 8 terms of the GO analysis of all DEGs; (G) the top 10 terms of the KEGG pathway analysis of all DEGs; (H) the PPI network of the upregulated and downregulated DEGs; (I) the PPI network of the 54 immune-related DEGs of M0 macrophage cells.; MCODE: Molecular Complex Detection; PPI, protein–protein interaction; STRING, Search Tool for the Retrieval of Interacting Genes; TF, transcription factor.
FIG. 4.
FIG. 4.
Construction of the TF-miRNA-mRNA and PPI network network of immune-related DEGs of M0 macrophage cells. To analyze the TF-miRNA-mRNA network, the miRNAs of the immune-related DEGs were predicted. To analyze the interactions between proteins and proteins encoded by DEGs, the STRING database was utilized to analyze their interactions. (A) The TF-miRNA-mRNA network; (B) the top 8 terms of the GO analysis of upregulated DEGs; (C) the top 8 terms of the KEGG pathway analysis of upregulated DEGs; (D) the top 8 terms of the GO analysis of downregulated DEGs; (E) the top 10 terms of the KEGG pathway analysis of downregulated DEGs; (F) the top 8 terms of the GO analysis of all DEGs; (G) the top 10 terms of the KEGG pathway analysis of all DEGs; (H) the PPI network of the upregulated and downregulated DEGs; (I) the PPI network of the 54 immune-related DEGs of M0 macrophage cells.; MCODE: Molecular Complex Detection; PPI, protein–protein interaction; STRING, Search Tool for the Retrieval of Interacting Genes; TF, transcription factor.
FIG. 5.
FIG. 5.
Verification analysis through the CON dataset. The differentially immune cells screened were verified through the CON dataset. The results of the CIBERSORT calculations showed that 434 of the 562 samples were valid (P < 0.05), including 419 PCs and 15 lung metastatic cancers. (A) The landscape of the 35 patients with PC and 15 with lung metastatic cancer; (B) heat map of immune cell infiltration; (C) violin plot of immune cell infiltration; (D) venn diagram of differential immune cells.

References

    1. Agarwal V, Bell GW, Nam JW, Bartel DP. 2015. Predicting effective microRNA target sites in mammalian mRNAs. eLife 4:e05005. DOI: 10.7554/eLife.05005. - DOI - PMC - PubMed
    1. Amatya N, Garg AV, Gaffen SL. 2017. IL-17 Signaling: the Yin and the Yang. Trends Immunol 38(5):310–322. - PMC - PubMed
    1. Ashburner M, Ball CA, Blake JA, Botstein D, Butler H, Cherry JM, Davis AP, Dolinski K, Dwight SS, Eppig JT, Harris MA, Hill DP, Issel TL, Kasarskis A, Lewis S, Matese JC, Richardson JE, Ringwald M, Rubin GM, Sherlock G. 2000. Gene Ontology: tool for the unification of biology. Nucleic Acids Res 27(1):29–34. - PMC - PubMed
    1. Bader GD, Hogue CW. 2003. An automated method for finding molecular complexes in large protein interaction networks. BMC Bioinformatics 4(1):2. - PMC - PubMed
    1. Barrett T, Troup DB, Wilhite SE, Ledoux P, Rudnev D, Evangelista C, Kim IF, Soboleva A, Tomashevsky M, Edgar R. 2007. NCBI GEO: mining millions of expression profiles—database and tools. Nucleic Acids Res 33(Database issue):D562–D566. - PMC - PubMed

Publication types