. 2022 Jul;607(7917):169-175.
doi: 10.1038/s41586-022-04842-7. Epub 2022 May 16.

OCA-T1 and OCA-T2 are coactivators of POU2F3 in the tuft cell lineage

Affiliations

OCA-T1 and OCA-T2 are coactivators of POU2F3 in the tuft cell lineage

Xiaoli S Wu et al. Nature. 2022 Jul.

Abstract

Tuft cells are a rare chemosensory lineage that coordinates immune and neural responses to foreign pathogens in mucosal tissues1. Recent studies have also revealed tuft-cell-like human tumours2,3, particularly as a variant of small-cell lung cancer. Both normal and neoplastic tuft cells share a genetic requirement for the transcription factor POU2F3 (refs. 2,4), although the transcriptional mechanisms that generate this cell type are poorly understood. Here we show that binding of POU2F3 to the uncharacterized proteins C11orf53 and COLCA2 (renamed here OCA-T1/POU2AF2 and OCA-T2/POU2AF3, respectively) is critical in the tuft cell lineage. OCA-T1 and OCA-T2 are paralogues of the B-cell-specific coactivator OCA-B; all three proteins are encoded in a gene cluster and contain a conserved peptide that binds to class II POU transcription factors and a DNA octamer motif in a bivalent manner. We demonstrate that binding between POU2F3 and OCA-T1 or OCA-T2 is essential in tuft-cell-like small-cell lung cancer. Moreover, we generated OCA-T1-deficient mice, which are viable but lack tuft cells in several mucosal tissues. These findings reveal that the POU2F3-OCA-T complex is the master regulator of tuft cell identity and a molecular vulnerability of tuft-cell-like small-cell lung cancer.


Conflict of interest statement

Competing interests C.R.V. has received consulting fees from Flare Therapeutics, Roivant Sciences and C4 Therapeutics; has served on the advisory boards of KSQ Therapeutics, Syros Pharmaceuticals and Treeline Biosciences; has received research funding from Boehringer-Ingelheim and Treeline Biosciences; and owns a stock option from Treeline Biosciences. M.E. is a member of the research advisory board for brensocatib for Insmed; a member of the scientific advisory board for Vividion Therapeutics; and a consultant for Protalix. J.S. has received research funding from Abbvie and Pfizer and licensed a patent (11046763 to Stanford University) to Forty Seven/Gilead on the use of CD47-blocking strategies in SCLC.

Figures

Extended Data Fig. 1 |
Extended Data Fig. 1 |. C11orf53, COLCA2, and POU2F3 are expressed in murine and human tuft cells.
(a)-(f) Summary of scRNA-seq data. The plots depict the average expression of indicated genes in the indicated cell types. COLCA2: mouse gene name Gm684. (a) mTEC: medullary thymic epithelial cells; TEC: thymic epithelial cells; VSMC: vascular smooth muscle cell; cTEC: cortical thymic epithelial cells. (b) ILCs: innate lymphoid cells; TA: transit amplifying. (d) NK: natural killer; ETP: early thymic progenitor. NMP: neutrophil-myeloid progenitor. (e) PNEC: pulmonary neuroendocrine cells. (f) APCS: antigen presenting cells; BG: Bergmann glial cell; OLGs: oligodendrocytes; OPCs: oligodendrocyte precursor cell; MSC: mesenchymal stem cell; MuSC: muscle satellite stem cell; AdMSC: adipose mesenchymal stem cell; PTECs: proximal tubular epithelial cells; LSESc: Liver sinusoidal endothelial cells; MPCs: multipotent progenitor cell; CLP: common lymphoid progenitor cells; GMP: granulocyte monocyte progenitor cell; HSC: hematopoietic precursor cell; MEP: megakaryocyte-erythroid progenitor cell; Treg: regulatory T cells; DN1 pro-T: double negative 1 progenitor T cells. (g) Summary of C11orf53 and Colca2 isoform expression in sorted murine tuft cells. (h) mRNA levels of POU2F3 and COLCA2 across 1,379 human cancer cell lines from CCLE database. Data are obtained from the Cancer Dependency Map (DepMap) portal (21Q2). Source of each single-cell or bulk RNA-seq dataset as well as plotting is indicated in method section.
Extended Data Fig. 2 |
Extended Data Fig. 2 |. Evaluation of Pou2f3, C11orf53, and Colca2 mRNA level through RNA-FISH in different tissues.
(a)-(c) Representative RNA-FISH analysis of Pou2f3, C11orf53, and Colca2 expression in mouse small intestine (a), trachea (b), and stomach tissue of wild-type mice (c, top). (c, bottom) RNA-FISH analysis Pou2f3, C11orf53, and Colca2 expression in the stomach of C11orf53−/− (KO) mice (one independent experiment from three different mice). All scale bar represents 10 μM.
Extended Data Fig. 3 |
Extended Data Fig. 3 |. Isoform analysis of human C11orf53 and COLCA2.
(a) Isoform information of C11orf53 and COLCA2 extracted from the Ensemble and NCBI databases. (b) RT-qPCR analysis of RNA from SCLC-P cell lines using the primers indicated in (a), that quantify either the short isoform of C11orf53 or all isoforms. (c) RT-qPCR analysis of COLCA2 isoforms in NCI-H1048 cells using primers indicated in (a). for (b) and (c), mRNA level (Ct value) of isoform indicated is normalized to the level of B2M. Bar graph represents the mean of normalized mRNA level from three biological replicates with each replicate depicted as individual dot. Primers are provided in Supplementary Table 6.
Extended Data Fig. 4 |
Extended Data Fig. 4 |. C11orf53, COLCA2, and OCA-B share a conserved peptide that corresponds the known binding site of OCA-B with POU2F1/OCT1.
(a) and (c) Predicted intrinsic disorder for C11orf53 and COLCA2. PONDR (Predictor of Natural Disordered Regions) VLXT scores and IUPred2A (Intrinsically Unstructured Proteins Prediction) scores are shown on the y axis, and the amino acid positions are shown on the x axis. (b) and (d) The conservation analysis of C11orf53 and COLCA2 protein sequences across species with Bayesian method on ConSurf Server. The purple region is the conserved peptide (residues 10–32 for C11orf53 and 5–27 for COLCA2). (e) C11orf53, COLCA2, and Pou2af1/OCA-B gene cluster in the mouse genome (mm10). (f) Architecture and conservation of POU homeodomains of POU2F1/OCT1, POU2F2/OCT2, and POU2F3/OCT11. (g) Summary of residues involved in protein-DNA and protein-protein close contacts (<4.0 Å) for OCA-B with POU2F1, C11orf53 with POU2F3, and COLCA2 with POU2F3. The crystal structure of OCA-B and POU2F1DBD (PDB: 1CQT25) was used as a model for predicting the structure of C11orf53 or COLCA2 with POU2F3DBD on an octamer motif (ATGCAAAT) in PyMOL.
Extended Data Fig. 5 |
Extended Data Fig. 5 |. Additional biochemical evidence that C11orf53/OCA-T1 and COLCA2/OCA-T2 are paralogues of OCA-B.
(a) GST-pulldown with western blot of endogenous POU2F3 from NCI-H211 nuclear extracts with indicated constructs (n = 1). (b) Co-IP testing the interaction of HA-C11orf53 (HEK293T whole cell lysates, n = 2) or HA-COLCA2 (NCI-H1048 nuclear extract, n = 1) with FLAG-POU2F1, FLAG-POU2F2, and FLAG-POU2F3. (c) Co-IP testing the interaction of HA-C11orf53 or HA-COLCA2 with FLAG-POU3F4/OCT9, FLAG-POU4F3/BRN3C, FLAG-POU5F1/OCT4, and POU2F3/OCT11 in HEK293T whole cell lysates. (d) Analytical gel filtration of His6-GFP-POU2F3 with Strep2SUMO-C11orf53 or untagged C11orf53, performed in the absence of any DNA. (e) Replicate of analytical gel filtration of His6-GFP-POU2F3/Strep2SUMO-C11orf53/octamer motif A alone or in combination, accompanied by Coomassie blue staining of the peak fraction of the ternary complex (red curve). Data are representative of two biological replicates (c-e). (f) Summary of microscale thermophoresis measurements of protein binding affinity for the octamer motif A DNA. Highest protein concentration tested is 1 μM for all experiments. (g) Purity assessment of recombinant OCA-B (expressed and purified from Sf9 cells) and POU2F1/OCT1 (expressed and purified from E. coli) proteins by SDS-PAGE and Coomassie blue staining. (h) Analytical gel filtration of POU2F3, OCA-B, octamer DNA motif A assemblies. (i) Analytical gel filtration of POU2F1, C11orf53, and octamer DNA motif A assemblies. For (h) and (i), the maximum absorbance at 260 nm for each injection was normalized to 1.0 for the ease of comparison. As POU2F1 is larger in molecular weight than POU2F3, the shift in elution volume is less prominent for the ternary complex. Complex formation was validated by SDS-PAGE assessment of the peak fraction to confirm the presence of both proteins (red curve). Data are representative of two biological replicates (i-j). Source data for microscale thermophoresis assay is provided in Supplementary Table 1, uncropped gels are provided in Supplementary Fig. 1b, d–g.
Extended Data Fig. 6 |
Extended Data Fig. 6 |. Epigenomic evaluation of POU2F3, C11orf53/OCA-T1, and COLCA2/OCA-T2 in SCLC-P cell lines.
(a) Comparison of POU2F3, C11orf53, and HA-COLCA2 ChIP-seq peak overlap in the indicated cell lines. For each protein, peaks represent the ones that are consistently identified from 2–3 replicate of experiments. Detailed information is in method. (b) Annotation of POU2F3 and C11orf53 overlapping peaks NCI-H211 cells. (c) Position weight matrix of discovered motif enriched on POU2F3/C11orf53 co-binding sites by MEME from NCI-H211 cell line. (d) Western blot analysis of lentivirally overexpressed constructs used for ChIP-qPCR and gene complementation assay in NCI-H211 cells (n = 2). (e) Sequential ChIP-qPCR analysis of overexpressed HA-C11orf53 (NCI-H211) or HA-COLCA2 (NCI-H1048) co-expressed with FLAG-POU2F3 binding sites in NCI-H211 and NCI-H1048 cells respectively with anti-FLAG (1st IP) or protein G beads (1st IP) and anti-HA (2nd) antibodies. The enrichment is adjusted to the input amount. Two biological replicates are performed and represented as individual dots; the bar value represents the average enrichment over input of two biological replicates. (f) Western blot analysis of POU2F3 or C11orf53 in NCI-H211 (Cas9) cells transduced with indicated sgRNAs. Samples were collected 4 days post infection (n = 1). (g) RNA-seq analysis comparing mRNA changes following C11orf53, COLCA2, or POU2F3 knockout compared to control in three SCLC-P cells. RNA was collected five- or six-days post sgRNA infection. Each dot represents the log2fold-change of a single protein-coding genes (read outs > = 10). (h) Western blot analysis of FLAG-POU2F3, HA-C11orf53, and FLAG-GFP expression in murine YT330 SCLC cells. Data is representative of two biological replicates. Uncropped gel is provided in Supplementary Fig. 1i. Source data for gene expression changes upon knockout in different cells are provided in Supplementary Table 2. sgRNA and primer sequences are provided in Supplementary Table 6.
Extended Data Fig. 7 |
Extended Data Fig. 7 |. C11orf53/OCA-T1 and COLCA2/OCA-T2 are selective dependencies in SCLC-P lines.
(a) Two-class comparison of gene dependencies of four SCLC-P versus 986 other cancer cell lines. The average essentiality of each gene from SCLC-P is subtracted to its mean in other cell lines. This difference is moderated with an empirical Bayes method using the adaptive shrinkage method described in CRNA package - ashr. (b) Scatter plot of C11orf53, COLCA2, and POU2F3 dependency scores across a panel of human cancer cell lines. Data obtained from DepMap (21Q2). (c) Control sgRNAs (2 negative controls or one sgCDK1) for the competition-based proliferation assays (related to Fig. 4a), (n = 3). Mean ± s.d. is plotted. (d) BrdU incorporation assays following CRISPR-based targeting of POU2F3, C11orf53, or COLCA2 or negative control in the indicated Cas9+ cell lines. Two technical replicates with two independent sgRNAs for each gene as biological replicates. Adjusted P value was calculated with two-way ANOVA with Tukey’s multiple comparison tests. (e-f) Tumour weights and imaging at the terminal timepoint of the xenograft experiments shown in Fig. 4b. Mean ± s.e.m. is plotted for (d-e). P-values are derived from two-tailed unpaired student’s t-test with Welch’s correction. (g) Controls for NCI-H211 gene complementation assay shown in Fig. 4c. (n = 3). Mean ± s.d. is plotted. (h) Competition-based proliferation assays in NCI-H1048 cells cotransduced with indicated cDNAs and sgRNAs lentivirally to assess functionality of indicated mutants. cDNAs were engineered to be resistant to Cas9/sgRNA-mediated cutting. Mean ± s.d. of normalized GFP percentage is plotted (n = 3). (i) anti-HA western blot of the indicated cDNAs from (h). Data are representative of two biological replicates. Source data for all GFP depletion assays, BrdU assays and tumour weights are provided in Supplementary Table 3–4, gating strategy for BrdU assay is provided in Supplementary Figure 2, sgRNA sequences are provided in Supplementary Table 4, uncropped gels are provided in Supplementary Fig. 1j.
Extended Data Fig. 8 |
Extended Data Fig. 8 |. Similar weights, morphology, and organ histology of C11orf53+/+ and C11orf53−/− mice. WT: C11orf53+/+ mice, KO: C11orf53−/− mice.
(a) Body weights of C11orf53 F2 mice of each genotype (2 female WT mice, 4 male WT mice; 3 female KO mice, 4 male KO mice; 5 HET male and female mice were included in the experiment with 6–10 weeks old littermate mice). (b) Representative images of C11orf53+/+ and C11orf53−/− mice F2 mice (representative image of four mice). (c) H&E analysis of representative organs from age- and sex-matched C11orf53+/+ and C11orf53−/− littermate mice (one female and one male mice for both genotypes were included in the experiment). All scale bars represent 200 μm. Source data for mice body weight is provided in Supplementary Table 5.
Extended Data Fig. 9 |
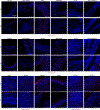
Extended Data Fig. 9 |. Representative immunofluorescence staining of POU2F3 and DCLK1 in tissues of C11orf53+/+ and C11orf53−/− mice.
WT: C11orf53+/+ mice, KO: C11orf53−/− mice. For trachea staining, 5 WT, 6 KO and 10 HET mice were included, except for POU2F3 staining which 9 HET mice were included in. For small intestine, 10 WT, 10 KO, 8 HET mice were included for POU2F3 staining and 9 WT, 10 KO, 5 HET mice for DCLK1 staining were included in. For urethra, 5 mice were included. For gallbladder, 6 WT and 5 KO mice were included. For caecum, colon, tongue and nasal respiratory, 3 WT and KO mice were included. For thymus, 6 WT and KO mice were included. For stomach, 10 mice were included. Data shown are representative images of acquired for each tissue. All scale bars represent 100 μm.
Extended Data Fig. 10 |
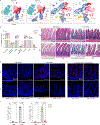
Extended Data Fig. 10 |. RNA-FISH, sSingle-cell RNA-seq, and IL-25 treatment experiments confirming in C11orf53−/− mice.
(a) t-distributed stochastic neighbour embedding (t-SNE) of small intestine epithelial cells (points), coloured by cell type assignments. Two independent replicates of single-cell RNA-seq data from C11orf53 wildtype (WT) and knockout (KO) littermate female mice. For the second replicate, cells that expressed a high level of CD45 were depleted by using CD45 microbeads before library preparation (Miltenyi Biotec, 30–052-301). TA: transient amplifying. (b) Quantification of different cell types in the intestinal epithelium from single-cell RNA-seq experiments in small intestine from two independent replicates. Bar graphs represent the mean. (c) H&E and Alcian Blue (Goblet cell) staining of intestines of C11orf53 WT and KO mice treated with PBS control or 500 ng of IL-25 for 8 days (for PBS control, four mice were included. For IL-25, five mice were included). Scale bars represent 100 μm. (d) Immunofluorescence staining of DCLK1 and POU2F3 markers in intestines of C11orf53 WT and KO mice treated with PBS control or IL-25, scale bars represent 250 μm. (e) Same as (d), but higher magnification (scale bars represent 100 μm). For DCLK1 staining, three WT mice were included in PBS control and five WT mice were included in IL-25 treatment. For POU2F3 staining, four and five WT mice were included in PBS and IL-25 treatment respectively, five KO mice were included in both PBS control and IL-25 treatment. (f) Quantification of (d). Mean ± s.e.m. is plotted. Two-tailed unpaired student’s t-test with Welch’s correction was used to evaluate significance. Source data for IF quantification is provided in Supplementary Table 3.
Fig. 1 |
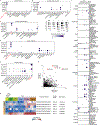
Fig. 1 |. C11orf53 is selectively expressed in normal and malignant tuft cells.
a,b, scRNA-seq analysis of the mRNA levels of Pou2f3 and C11orf53 (mouse gene name: 1810046K07Rik) in mouse trachea epithelium (a) and small intestine epithelium (b). t-Distributed stochastic neighbour embedding (t-SNE) analysis of 7,193 trachea epithelial cells (points) or 7,216 small intestine epithelial cells (points), coloured by cell type assignments or by the mRNA level (log2[transcripts per 10,000 reads (TP10K) + 1] of Pou2f3 and C11orf53). c, mRNA level of POU2F3 and C11orf53 across 1,379 human cancer cell lines from the CCLE database. Data were obtained from Cancer Dependency Map (DepMap) portal (21Q2). TPM, transcripts per million. d, Western blot analysis of C11orf53 and POU2F3 in a panel of SCLC cell lines. SCLC-P, SCLC-POU2F3high; SCLC-A, SCLC-ASCL1high; SCLC-N, SCLC-NEUROD1high. Data are representative of two independent experiments. e, mRNA levels of indicated genes from 72 patients with SCLC that are grouped on the basis of unsupervised clustering. Source data for western blots are provided in Supplementary Fig. 1a.
Fig. 2 |
Fig. 2 |. C11orf53/OCA-T1 and COLCA2/OCA-T2 form an OCA-B-like complex with POU2F3 in a DNA-dependent manner.
a, PSI-BLAST search of the conserved peptide of C11orf53 identified OCA-B and COLCA2 as having homology in this region. The arrows indicate residues that are involved in interacting with DNA or POU2F1/OCT1 based on Protein Data Bank (PDB) 1CQT (ref. ). b, The C11orf53, COLCA2 and POU2AF1/OCA-B gene cluster in the human genome (hg38). c, Immunoprecipitation (IP)–western blot analysis evaluating the interaction of HA–C11orf53 or HA–mCherry with endogenous POU2F3 in NCI-H211 cells. d, IP–western blot analysis evaluating the interaction between HA–COLCA2 and endogenous POU2F3 in NCI-H1048 cells. e, DNA pull-down assay evaluating POU2F3 and C11orf53 interactions with biotinylated octamer motif or control DNA. The octamer motif is underlined, bases in red highlight the difference between the two sequences. Immobilized DNA was incubated with cell lysates from transfected HEK293T cells. f, Purity assessment of recombinant His6–GFP–POU2F3 and Strep2SUMO–C11orf53 proteins by SDS–PAGE and Coomassie blue staining. M, marker. g, Analytical gel filtration of Strep2SUMO–C11orf53, His6–GFP–POU2F3 and octamer DNA motif A assemblies. The maximum absorbance at 260 nm for each injection was normalized to 1.0 for ease of comparison between samples. h, Microscale thermophoresis analysis of proteins mixed with octamer motif A. His6–GFP–POU2F3 and DNA were assembled first in a test tube, followed by titration of Strep2SUMO–C11orf53. n = 3. Data are mean ± s.e.m. i, Luciferase reporter assay performed in transfected HEK293T cells to evaluate the transactivation activity of indicated segments of C11orf53, COLCA2, OCA-B or POU2F3 that are fused to GAL4 DNA-binding domain (DBD). n = 3. The luciferase activity of each construct was first normalized to the empty vector and then transformed (log2[normalized luciferase activity] + 1). Data are mean ± s.d. Statistical analysis was performed using two-tailed unpaired Student’s t-tests, comparing the average of luciferase activity of C11orf53(33–288), COLCA2(28–251) and OCA-B(39–256) versus POU2F3(1–182), POU2F3(338–436) and empty vector. For the comparison to empty vector, Welch’s correction was performed before the Student’s t-test. Source data for gels are provided in Supplementary Figs. 1b,d–g and 7, and microscale thermophoresis analysis and GAL4 luciferase assay data are provided in Supplementary Table 1.
Fig. 3 |
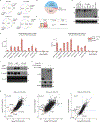
Fig. 3 |. he POU2F3–C11orf53/OCA-T1 complex drives the expression of tuft-cell-specific genes.
a, Chromatin immunoprecipitation sequencing (ChIP–seq) occupancy profiles of the indicated proteins at tuft-cell-specific loci. b, The correlation of peak tag counts of POU2F3 and C11orf53, within the genomic intervals of POU2F3 peaks (14,163) consistently identified from three replicates of POU2F3 experiments. n = 3. c, Anti-HA ChIP–quantitative PCR (qPCR) analysis of the indicated lentivirally expressed HA-tagged proteins. The ChIP–qPCR signal of each sample was normalized to its own input. Protein expression is shown in Extended Data Fig. 6d. Data are mean ± s.d. of three technical replicates. n = 1. d, RNA-seq analysis comparing mRNA changes after C11orf53 (3 sgRNAs) or POU2F3 (2 sgRNAs) knockout compared with control sgRNAs (2 sgRNAs) in NCI-H211 cells. RNA was collected 5 days after sgRNA infection. Each dot represents the log2-transformed fold change of a single protein-coding gene. Low-expressed genes were filtered out before performing DESeq2 (read count = 10 as cut-off). Knockout of each protein is shown in Extended Data Fig. 6f. e, mRNA levels of the indicated tuft cell marker genes in YT330 mouse SCLC cells lentivirally transduced with the indicated cDNA. Protein expression is shown in Extended Data Fig. 6h. n = 3 biological replicates; GFP and POU2F3 had one additional technical replicate and POU2F3 + C11orf53 had two additional technical replicates. Data are mean ± s.d. Source data for the gels are provided in Supplementary Fig. 1h,i, gene expression changes (log2-transformed fold change) after knockout or TPM of the indicated genes after overexpression are provided in Supplementary Table 2, primers and sgRNA sequences are provided in Supplementary Table 6.
Fig. 4 |
Fig. 4 |. C11orf53/OCA-T1 is essential for normal and neoplastic tuft cell development.
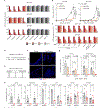
a, Competition-based proliferation assays in Cas9-expressing SCLC cells after lentiviral expression of the indicated sgRNAs (linked with GFP). Data are mean ± s.d. normalized percentage of GFP (to day 4 after infection) of two to three sgRNAs. n = 3. b, The growth kinetics of Cas9-expressing NCI-H526 and NCI-H1048 xenografts implanted in immunodeficient mice. Cells were lentivirally transduced with the indicated sgRNAs before injection into mice. n = 5, except for C11orf53, for which n = 10. Data are mean ± s.e.m. sgNEG, sgRNA targeting negative controls. P values were calculated using two-tailed unpaired Student’s t-tests with Welch’s correction. c, Competition-based proliferation assays in NCI-H211 cells cotransduced with the indicated cDNAs and sgRNAs lentivirally to assess the functionality of the indicated mutants. cDNAs were engineered to be resistant to Cas9/sgRNA-mediated cutting. Data are mean ± s.d. of GFP percentage (normalized to day 4). Expression of mutants is shown in Extended Data Fig. 6d. d, CRISPR–Cas9-induced deletion of C11orf53 to generate knockout mice. e, The ratio of different genotypes of C11orf53+/− (HET) progeny (C11orf53 F2 mice). f, Representative immunofluorescence staining of the tuft cell marker DCLK1 in the trachea and small intestine. Scale bars, 100 μm. g,h, Quantification of POU2F3-positive and DCLK1-positive cells. Data are mean ± s.e.m. The P values for the comparison of tuft cell frequencies of knockout versus WT (DCLK1/POU2F3) or HET versus WT of POU2F3 staining in small intestine, trachea, urethra, gallbladder and tongue were calculated using two-tailed unpaired Student’s t-tests with Welch’s correction; the P values for comparing tuft cell frequencies of knockout versus WT in colon, thymus and stomach, or HET versus WT of DCLK1 staining in the small intestine and trachea were calculated using ordinary unpaired two-tailed Student’s t-tests. The numbers of animals involved in f–h are provided in Extended Data Fig. 9. Source data for GFP competition and gene complementary assays are provided in Supplementary Table 3 and mouse data are provided in Supplementary Tables 4 and 5. sgRNA sequences and genotyping primers are provided in Supplementary Table 6.

References

    1. Schneider C, O’Leary CE & Locksley RM Regulation of immune responses by tuft cells. Nat. Rev. Immunol. 19, 584–593 (2019). - PMC - PubMed
    1. Huang Y-H et al. POU2F3 is a master regulator of a tuft cell-like variant of small cell lung cancer. Genes Dev. 32, 915–928 (2018). - PMC - PubMed
    1. Yamada Y et al. A tuft cell-like signature is highly prevalent in thymic squamous cell carcinoma and delineates new molecular subsets among the major lung cancer histotypes. J. Thorac. Oncol. 16, 1003–1016 (2021). - PubMed
    1. Gerbe F, Legraverend C & Jay P The intestinal epithelium tuft cells: specification and function. Cell. Mol. Life Sci. 69, 2907–2917 (2012). - PMC - PubMed
    1. Gerbe F et al. Intestinal epithelial tuft cells initiate type 2 mucosal immunity to helminth parasites. Nature 529, 226–230 (2016). - PMC - PubMed