. 2022 Jul;607(7917):119-127.
doi: 10.1038/s41586-022-04856-1. Epub 2022 May 16.

Characterization and antiviral susceptibility of SARS-CoV-2 Omicron BA.2

Collaborators, Affiliations

Characterization and antiviral susceptibility of SARS-CoV-2 Omicron BA.2

Ryuta Uraki et al. Nature. 2022 Jul.

Abstract

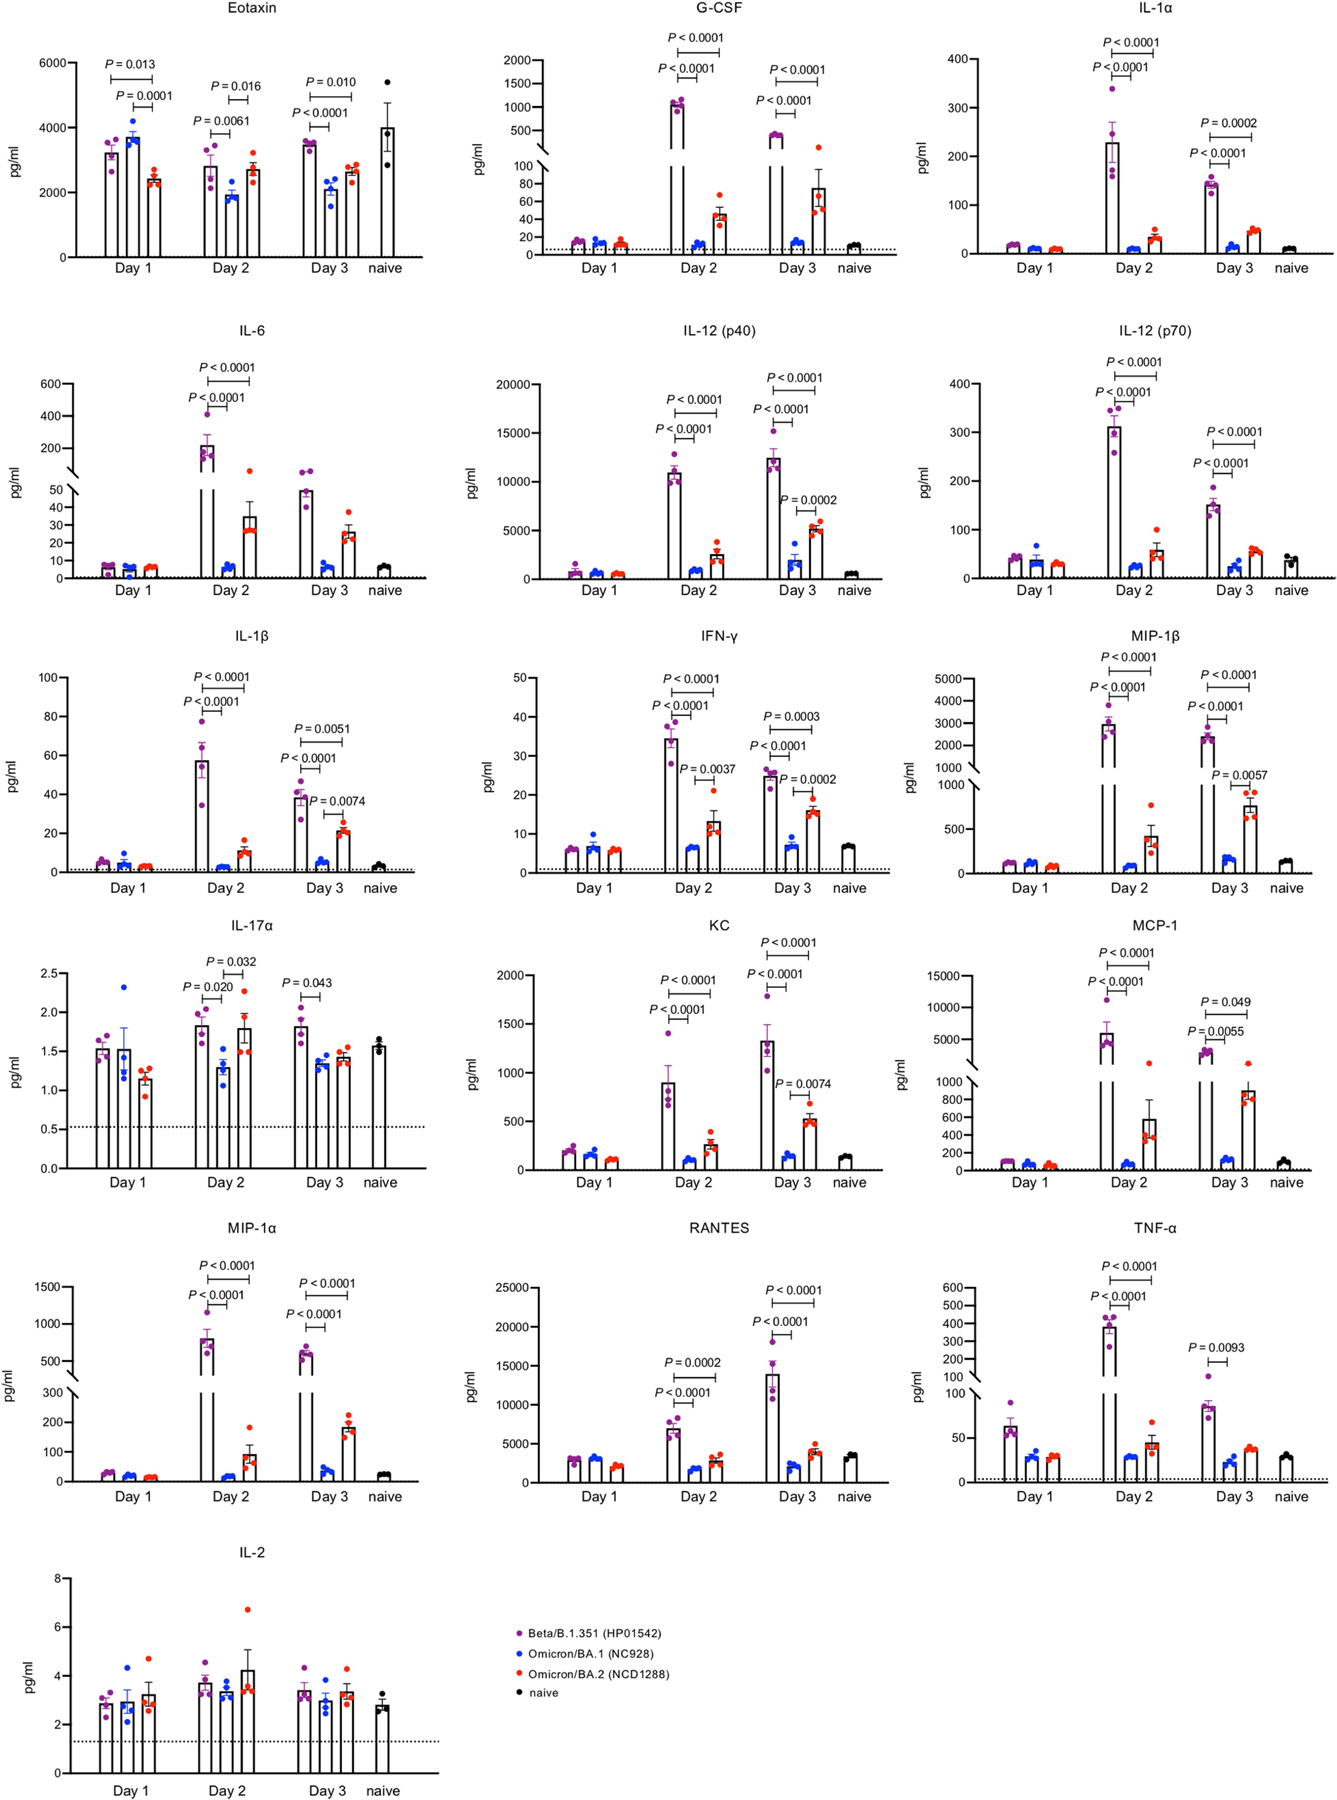
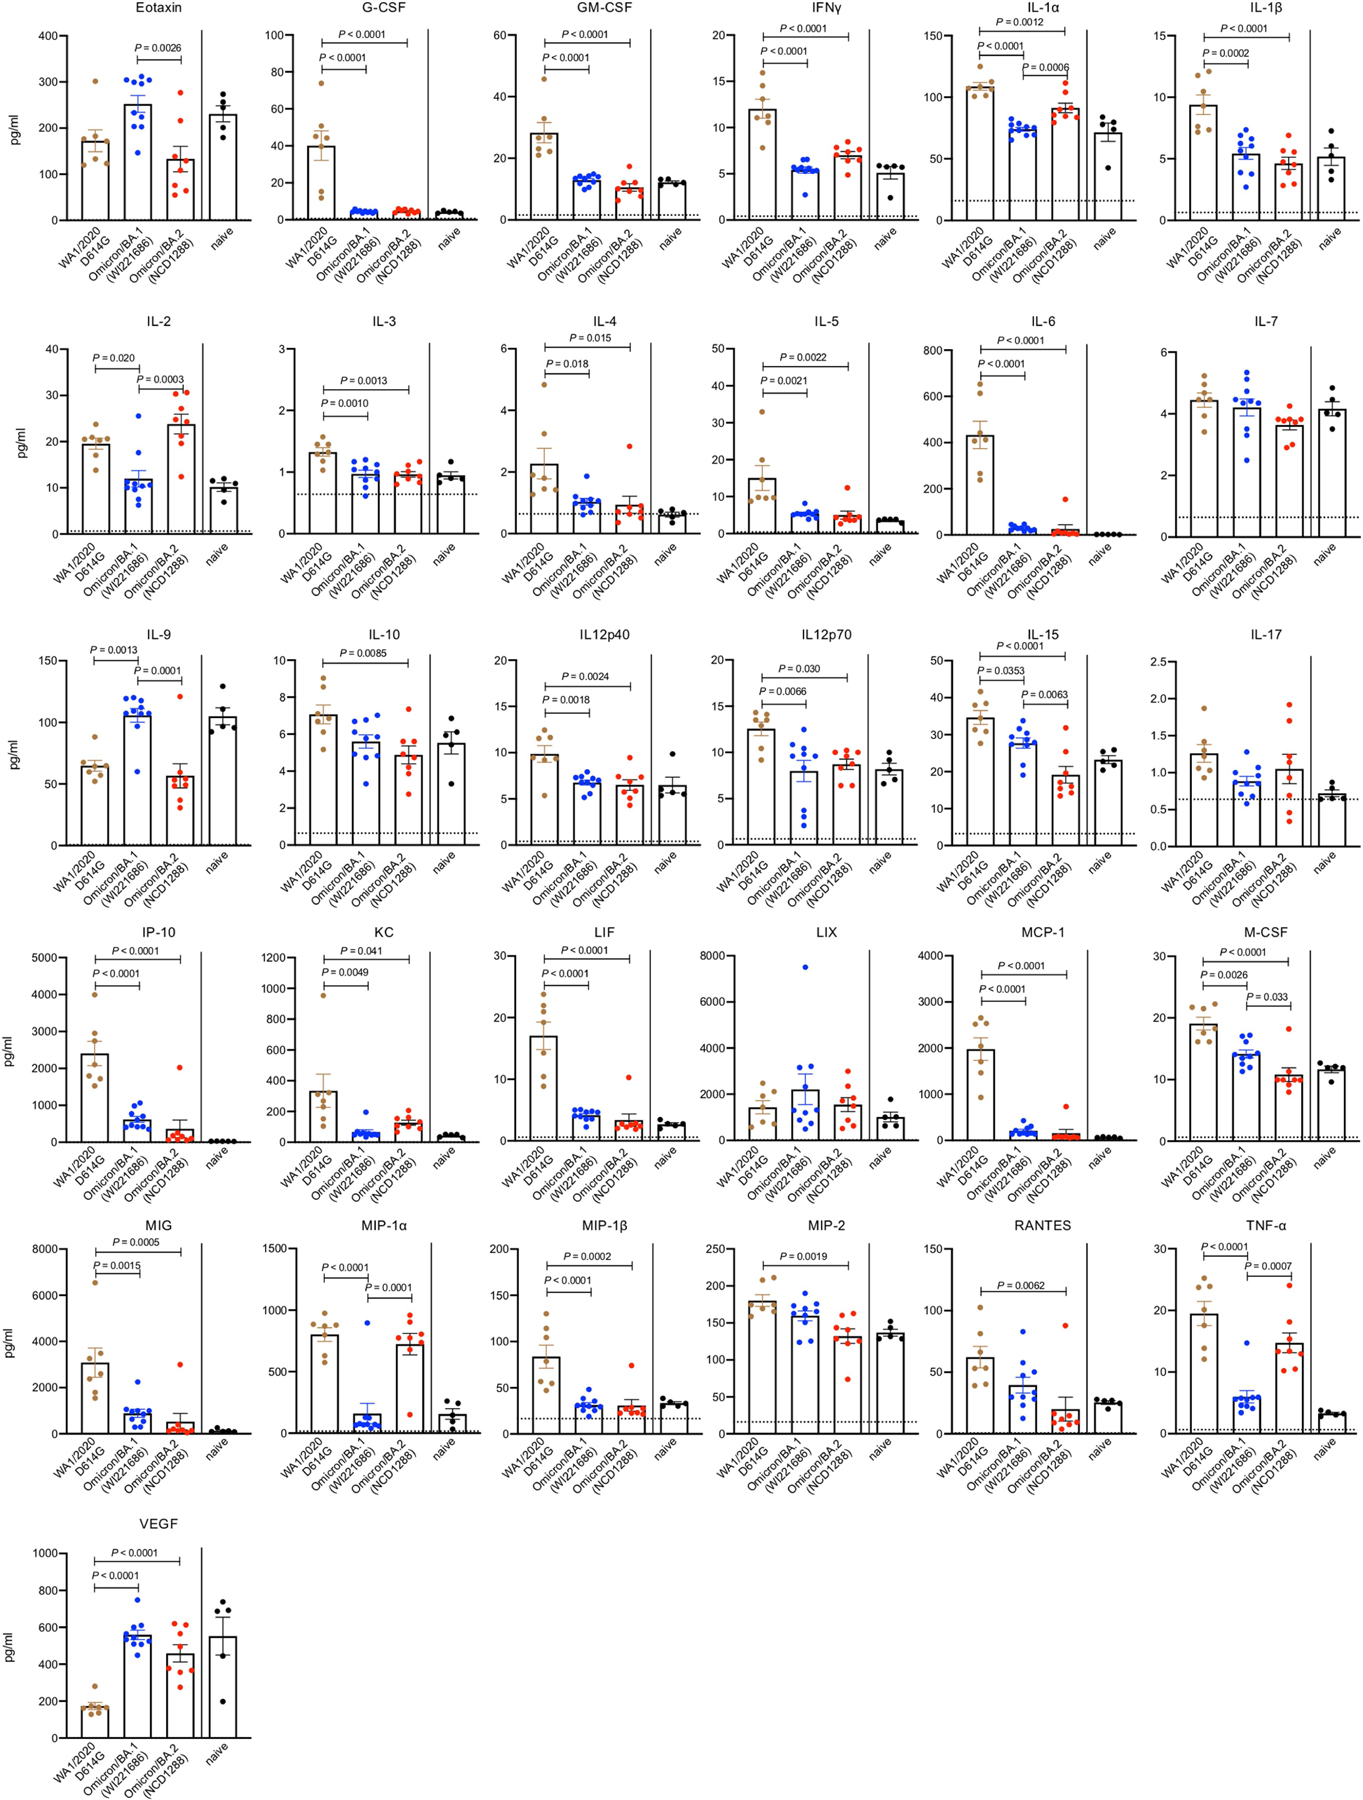
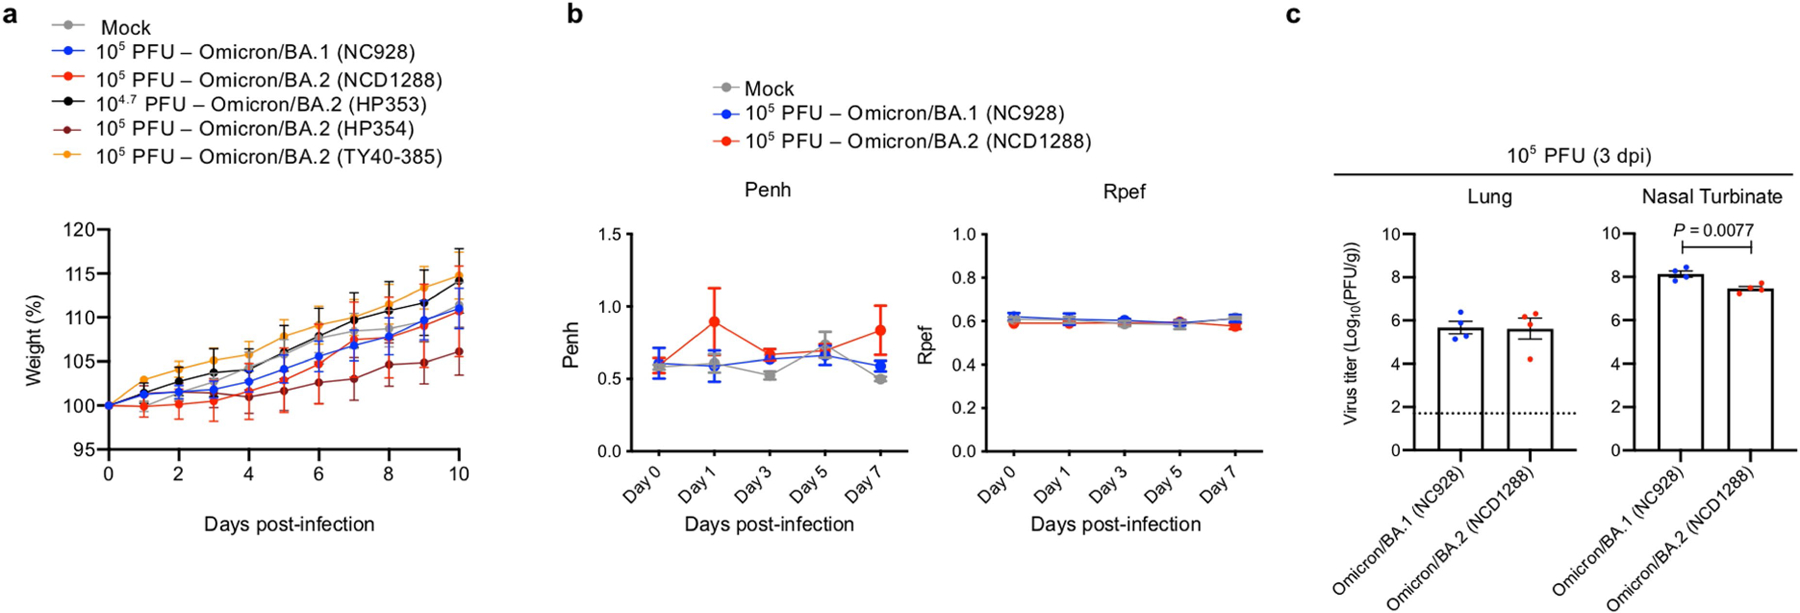
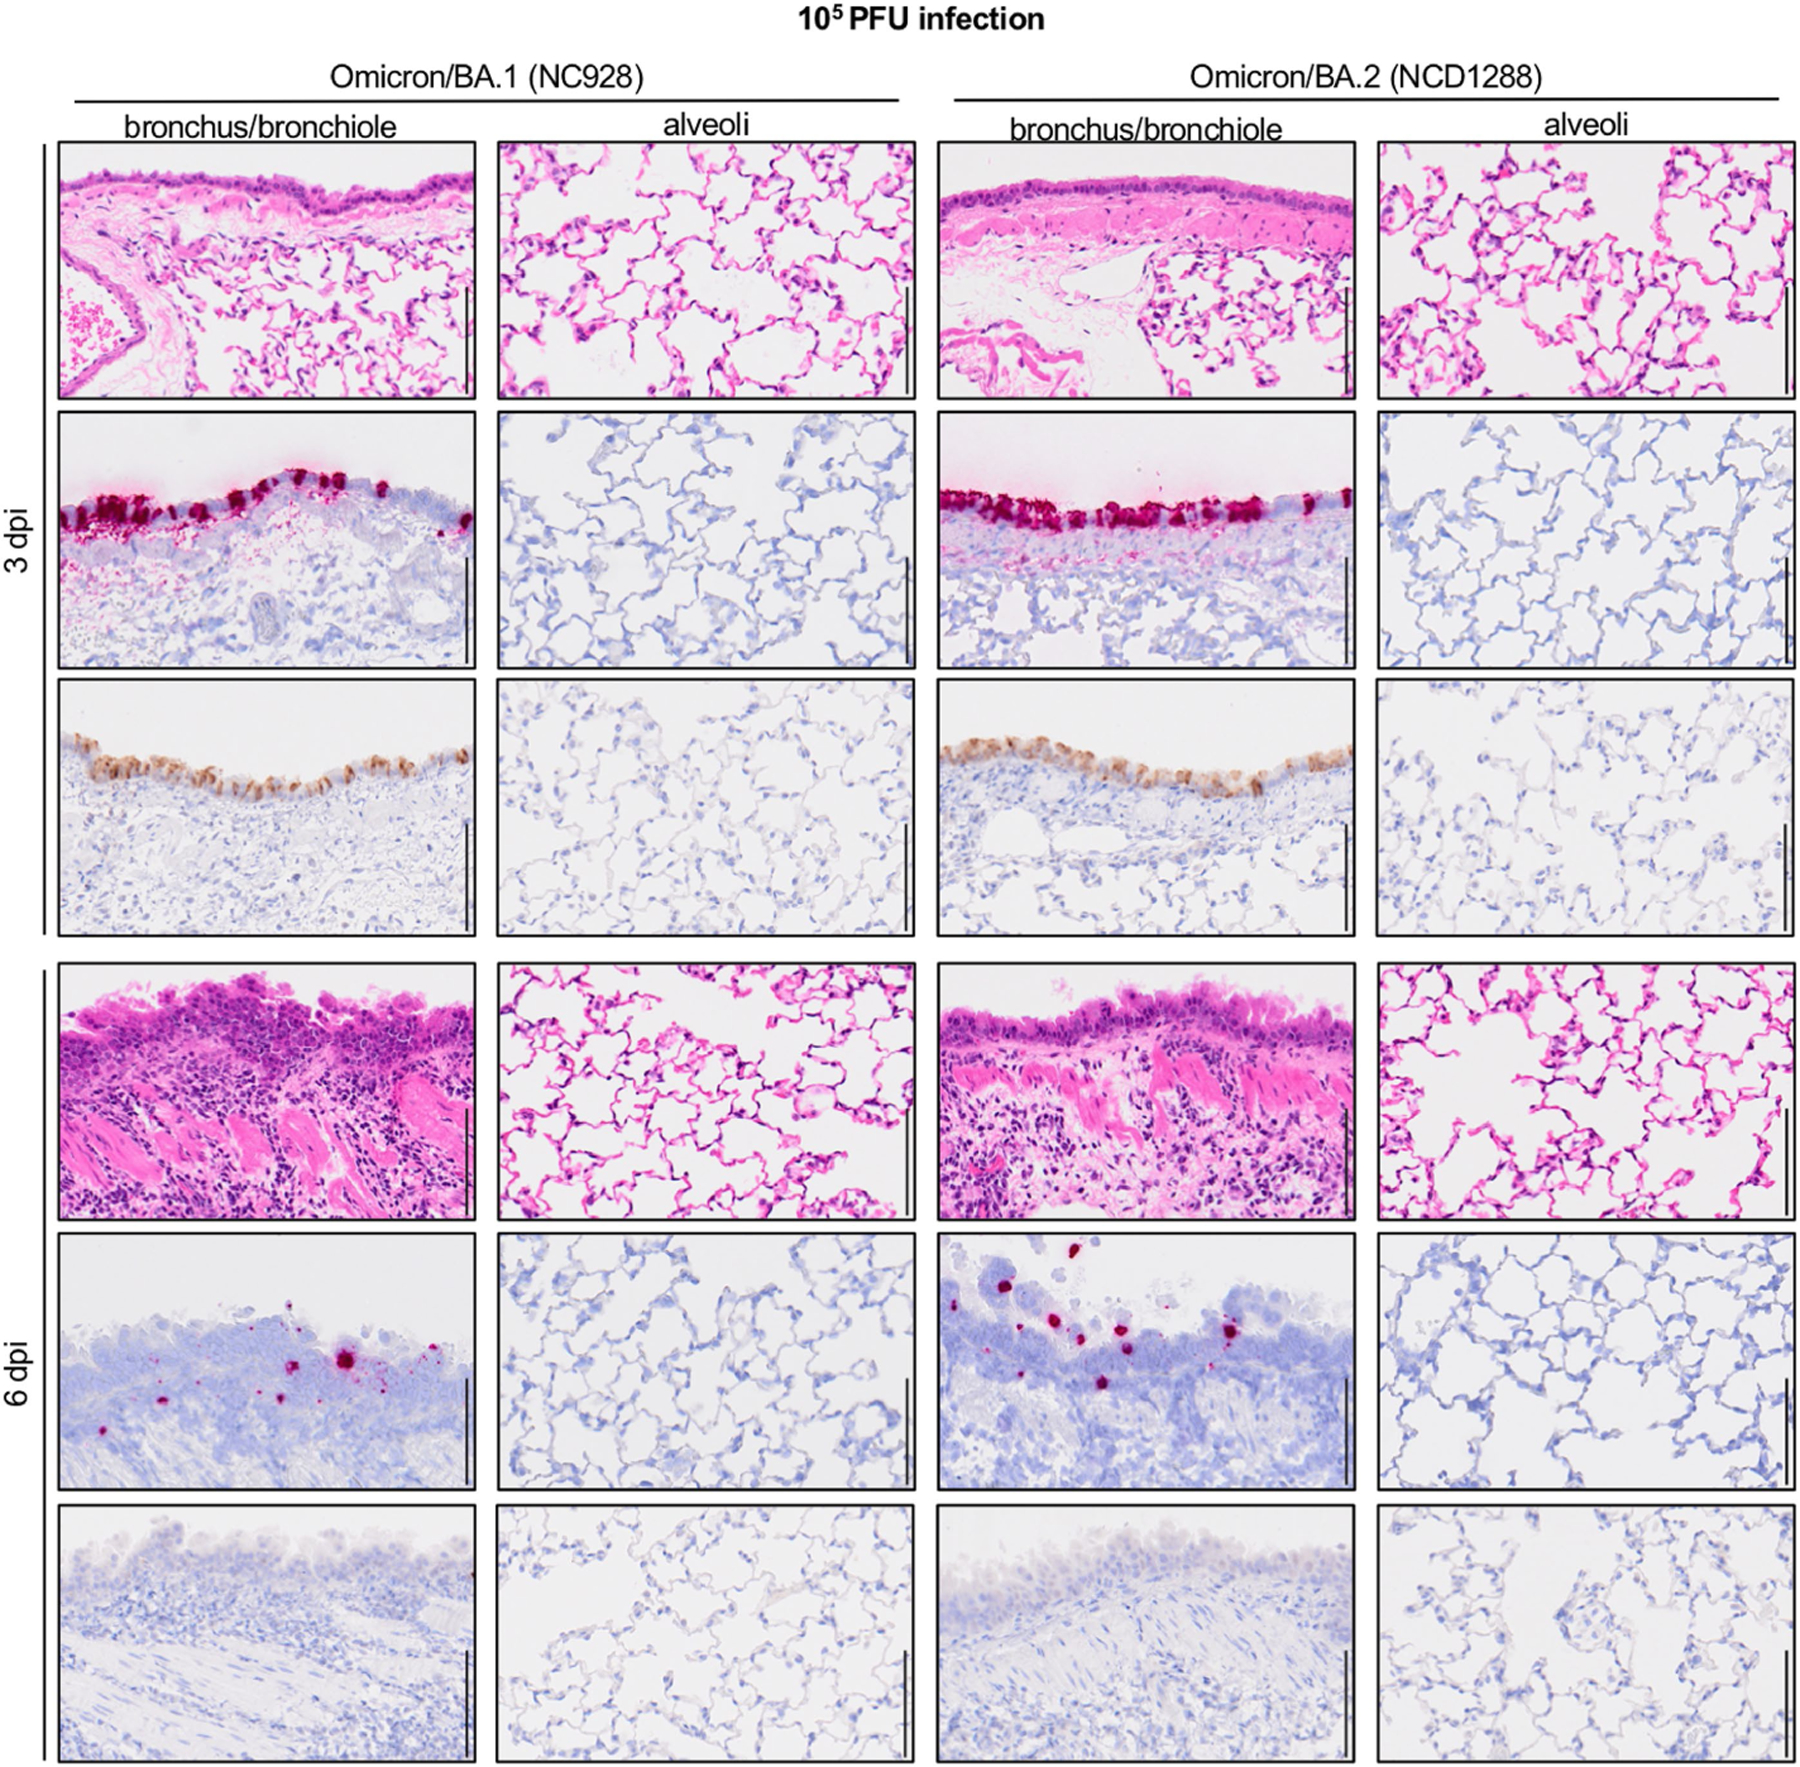
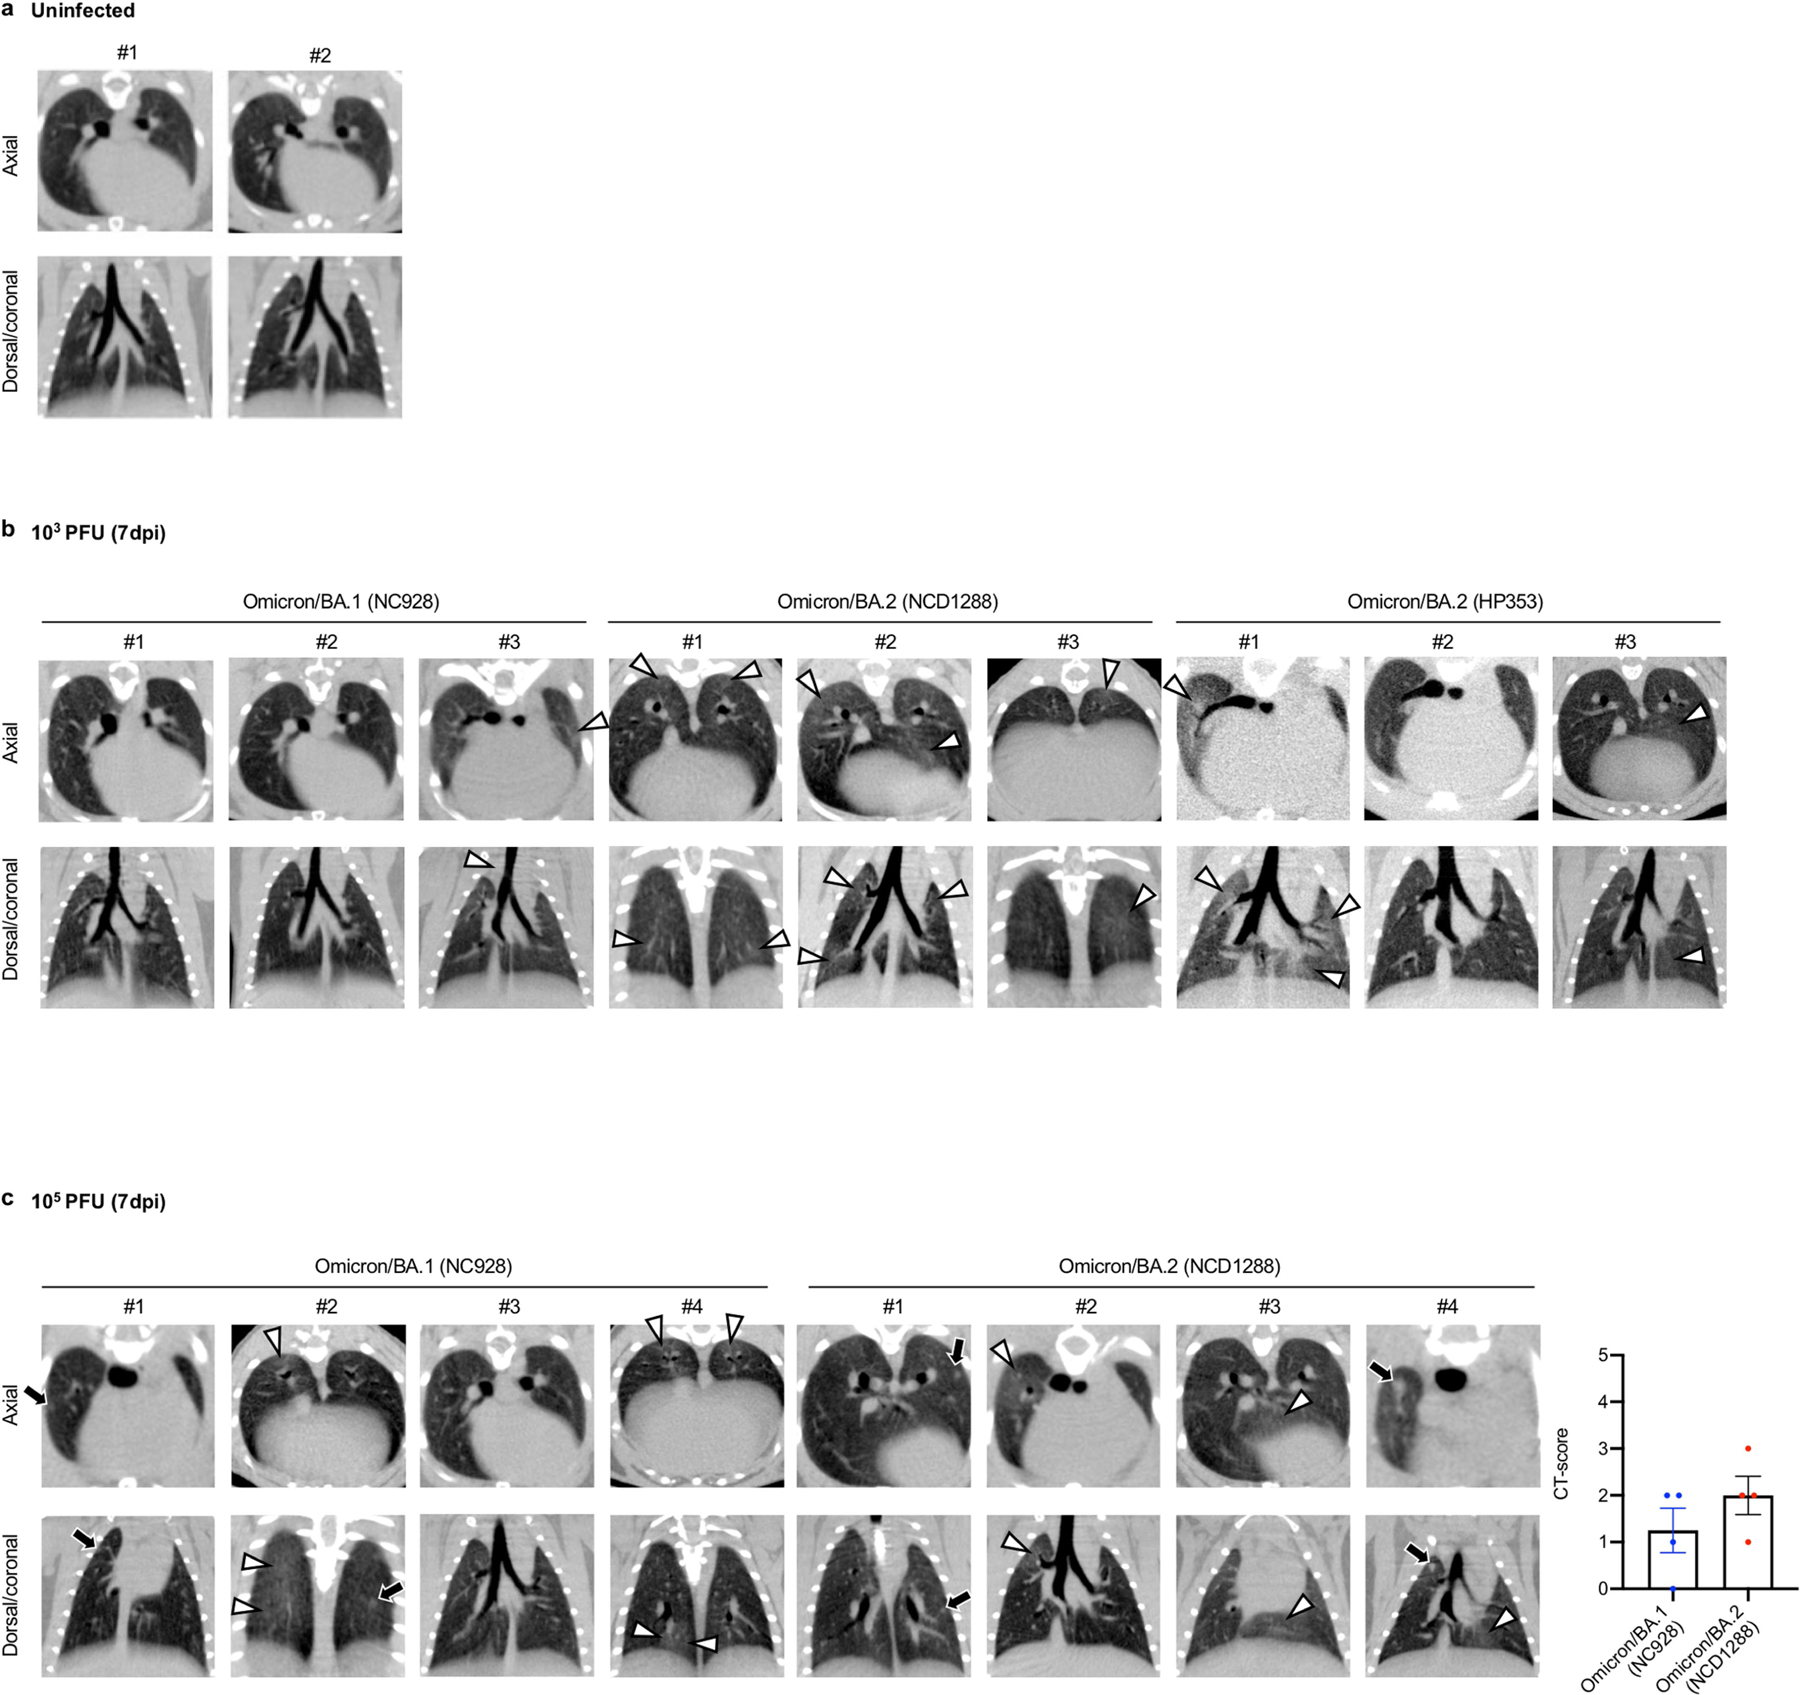
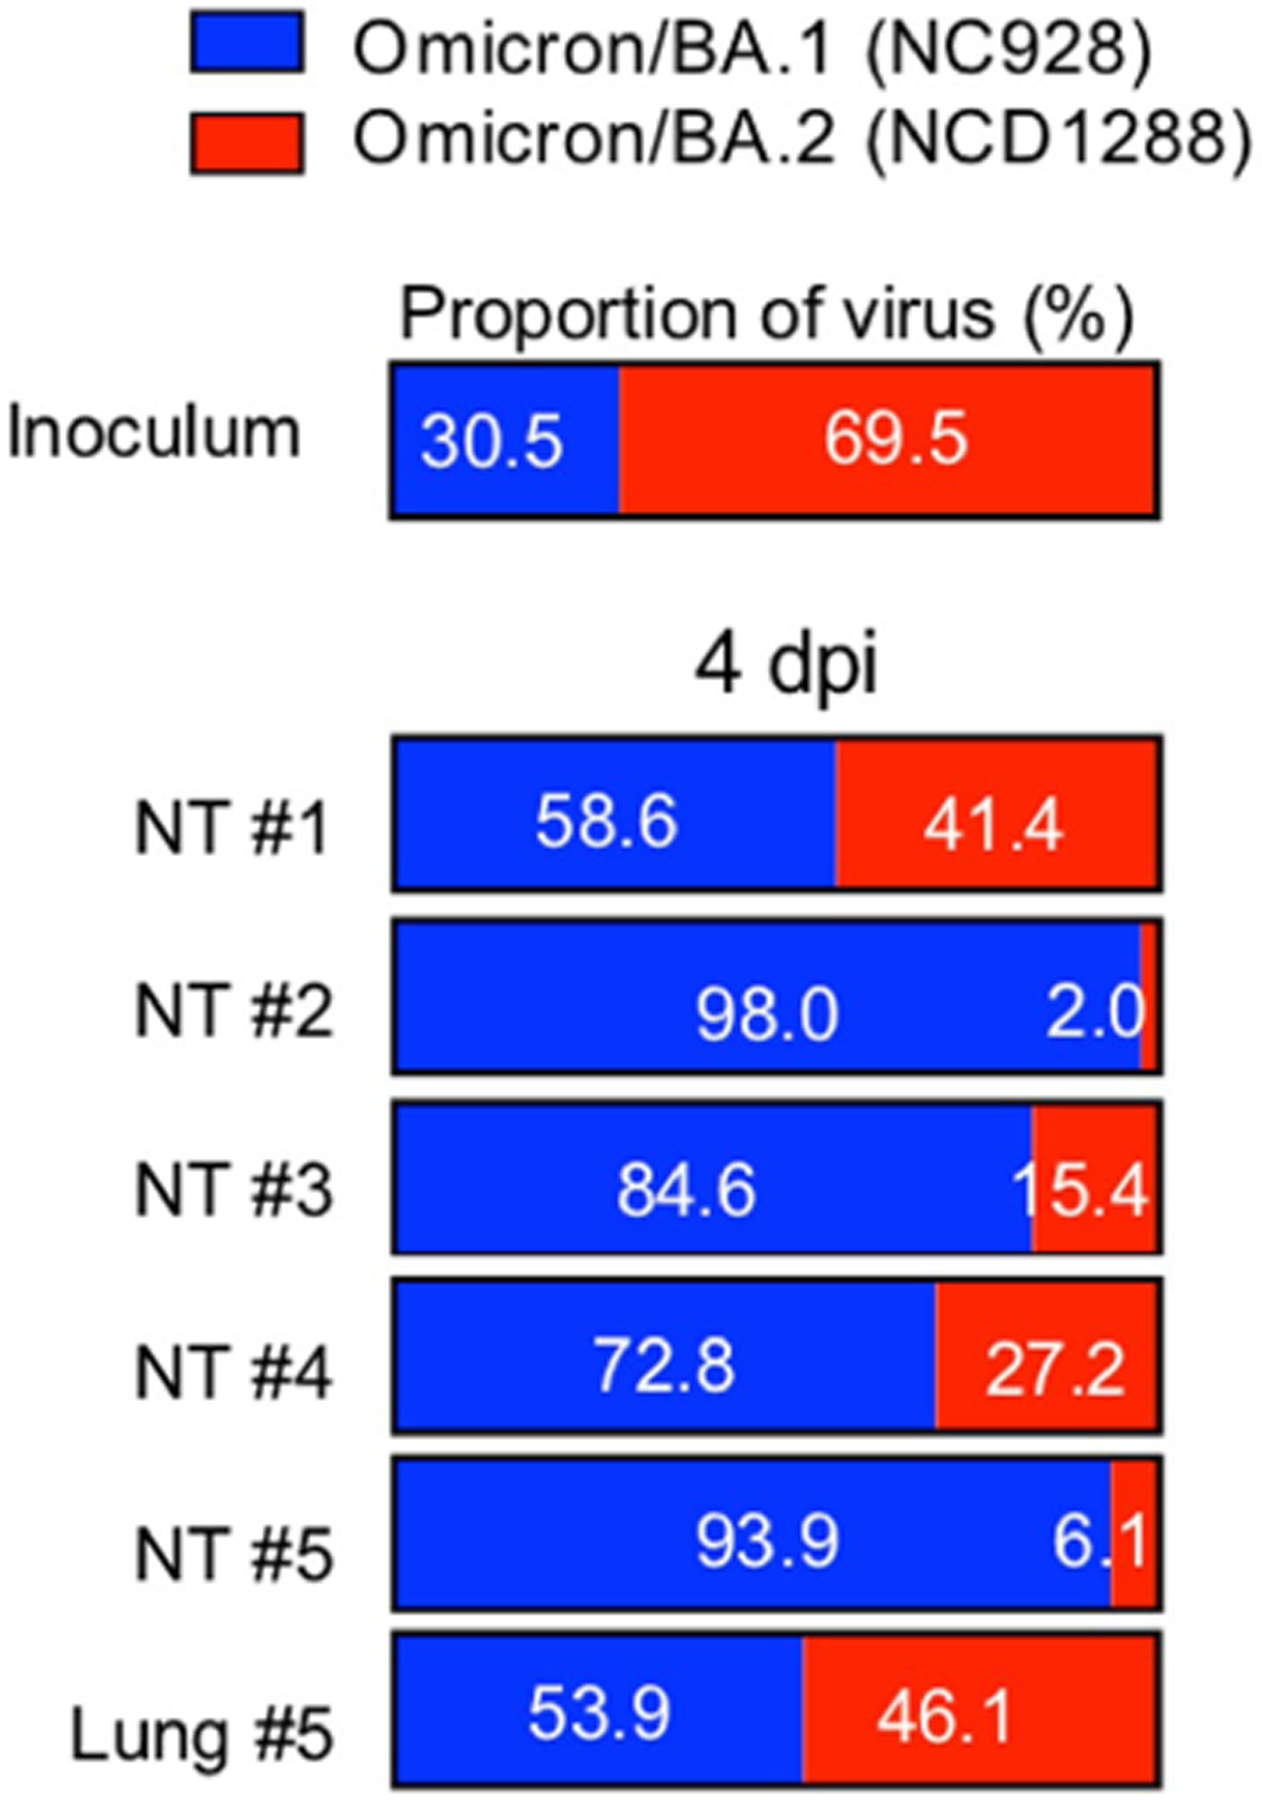
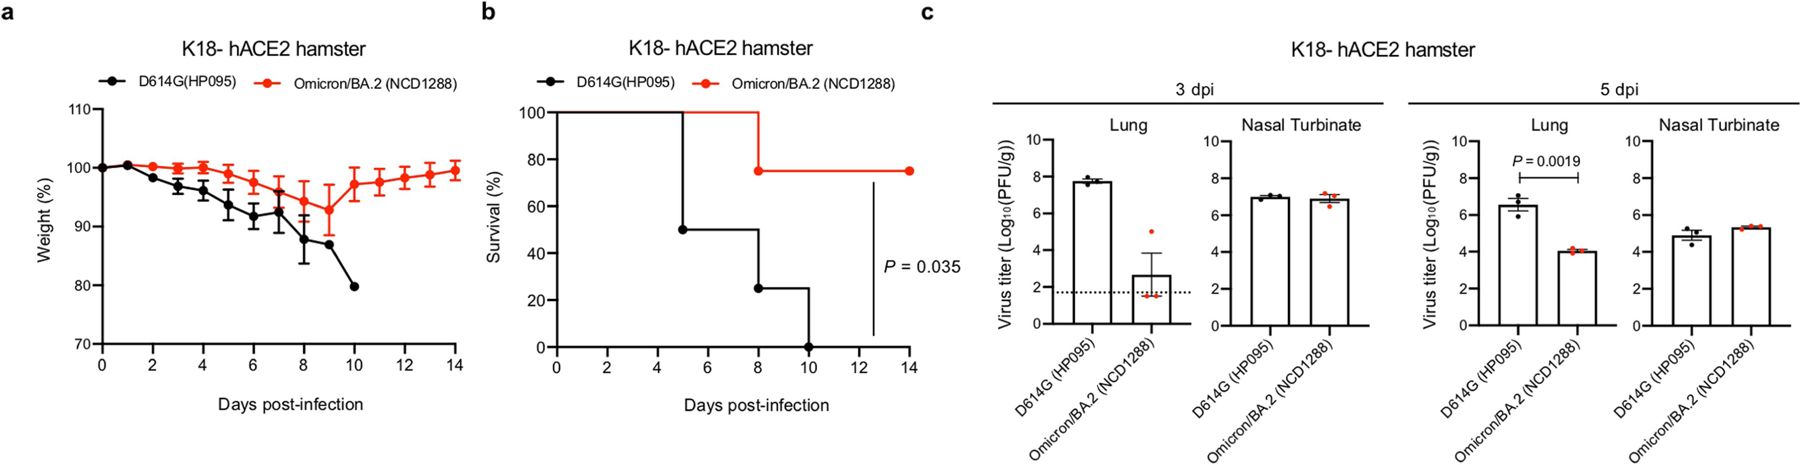
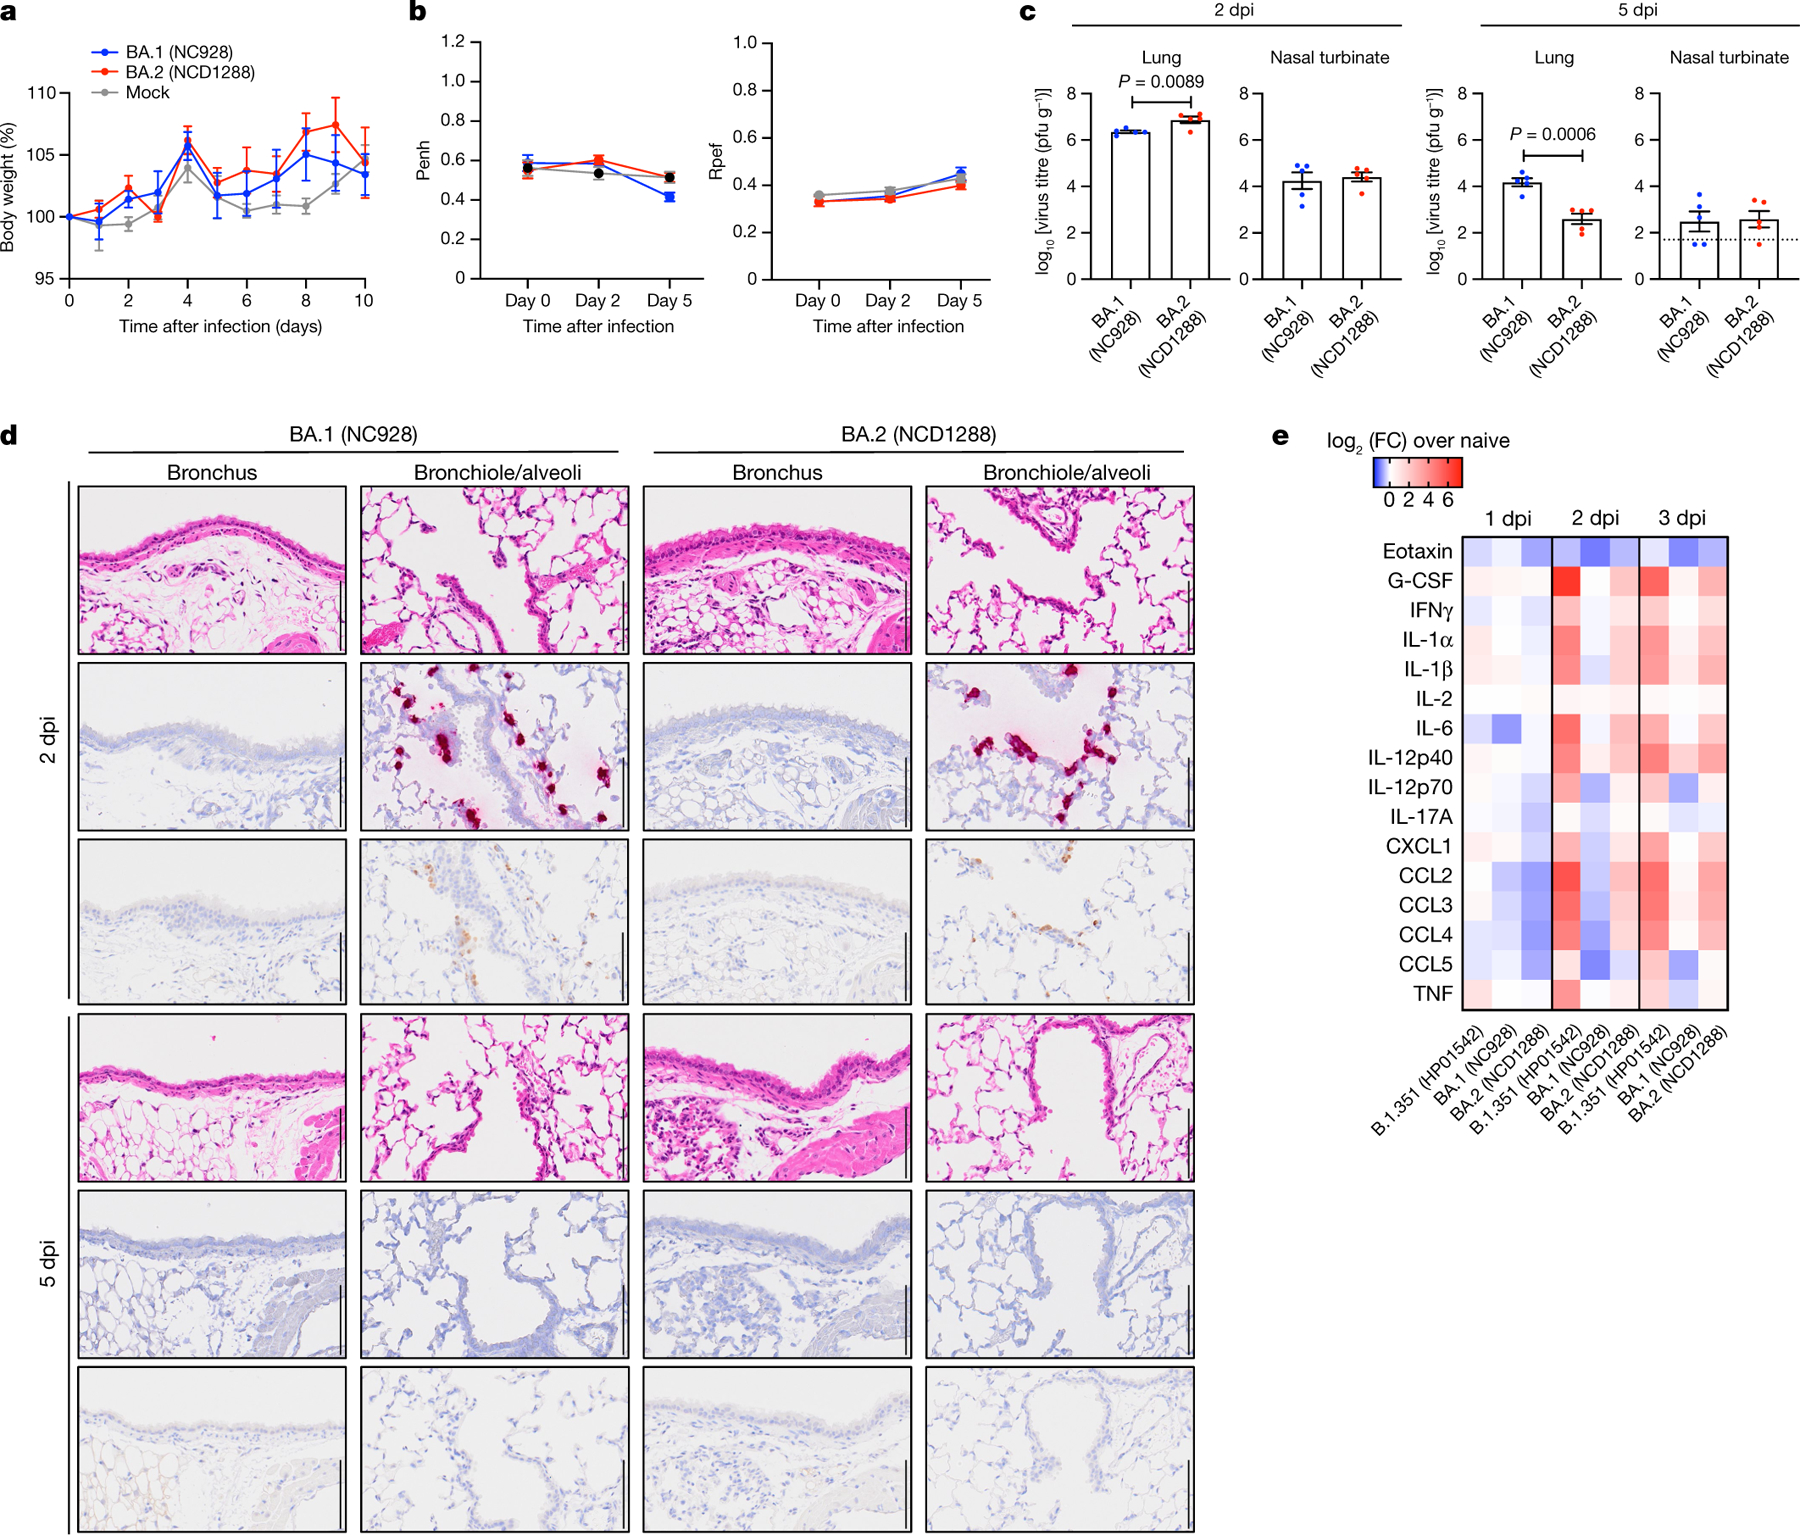
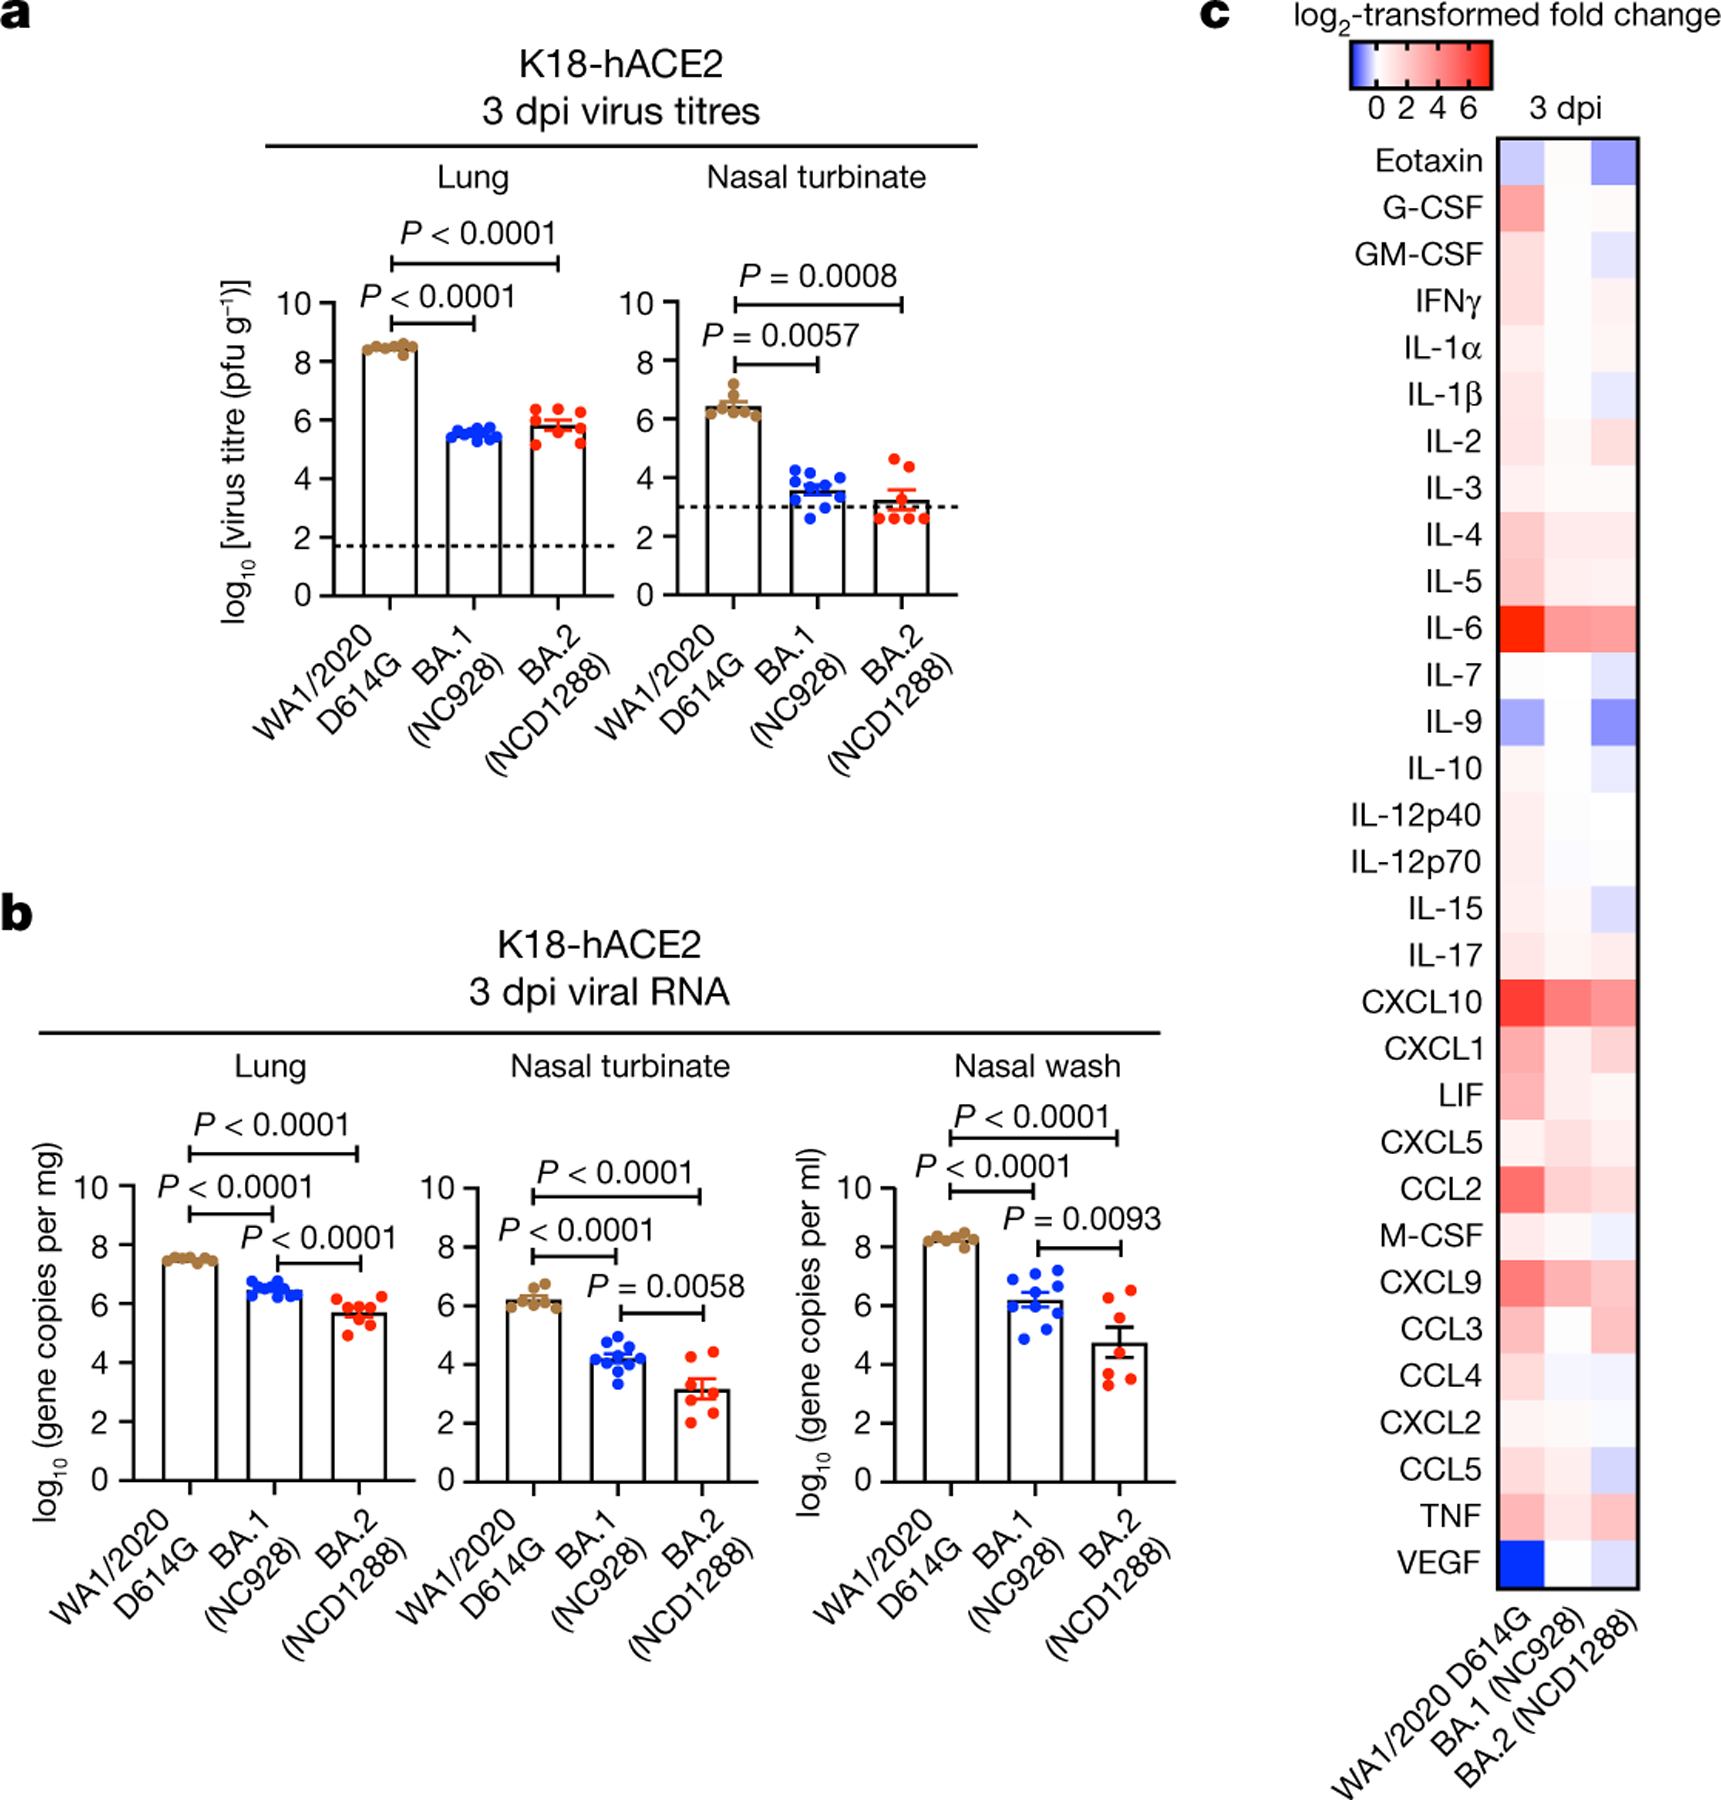
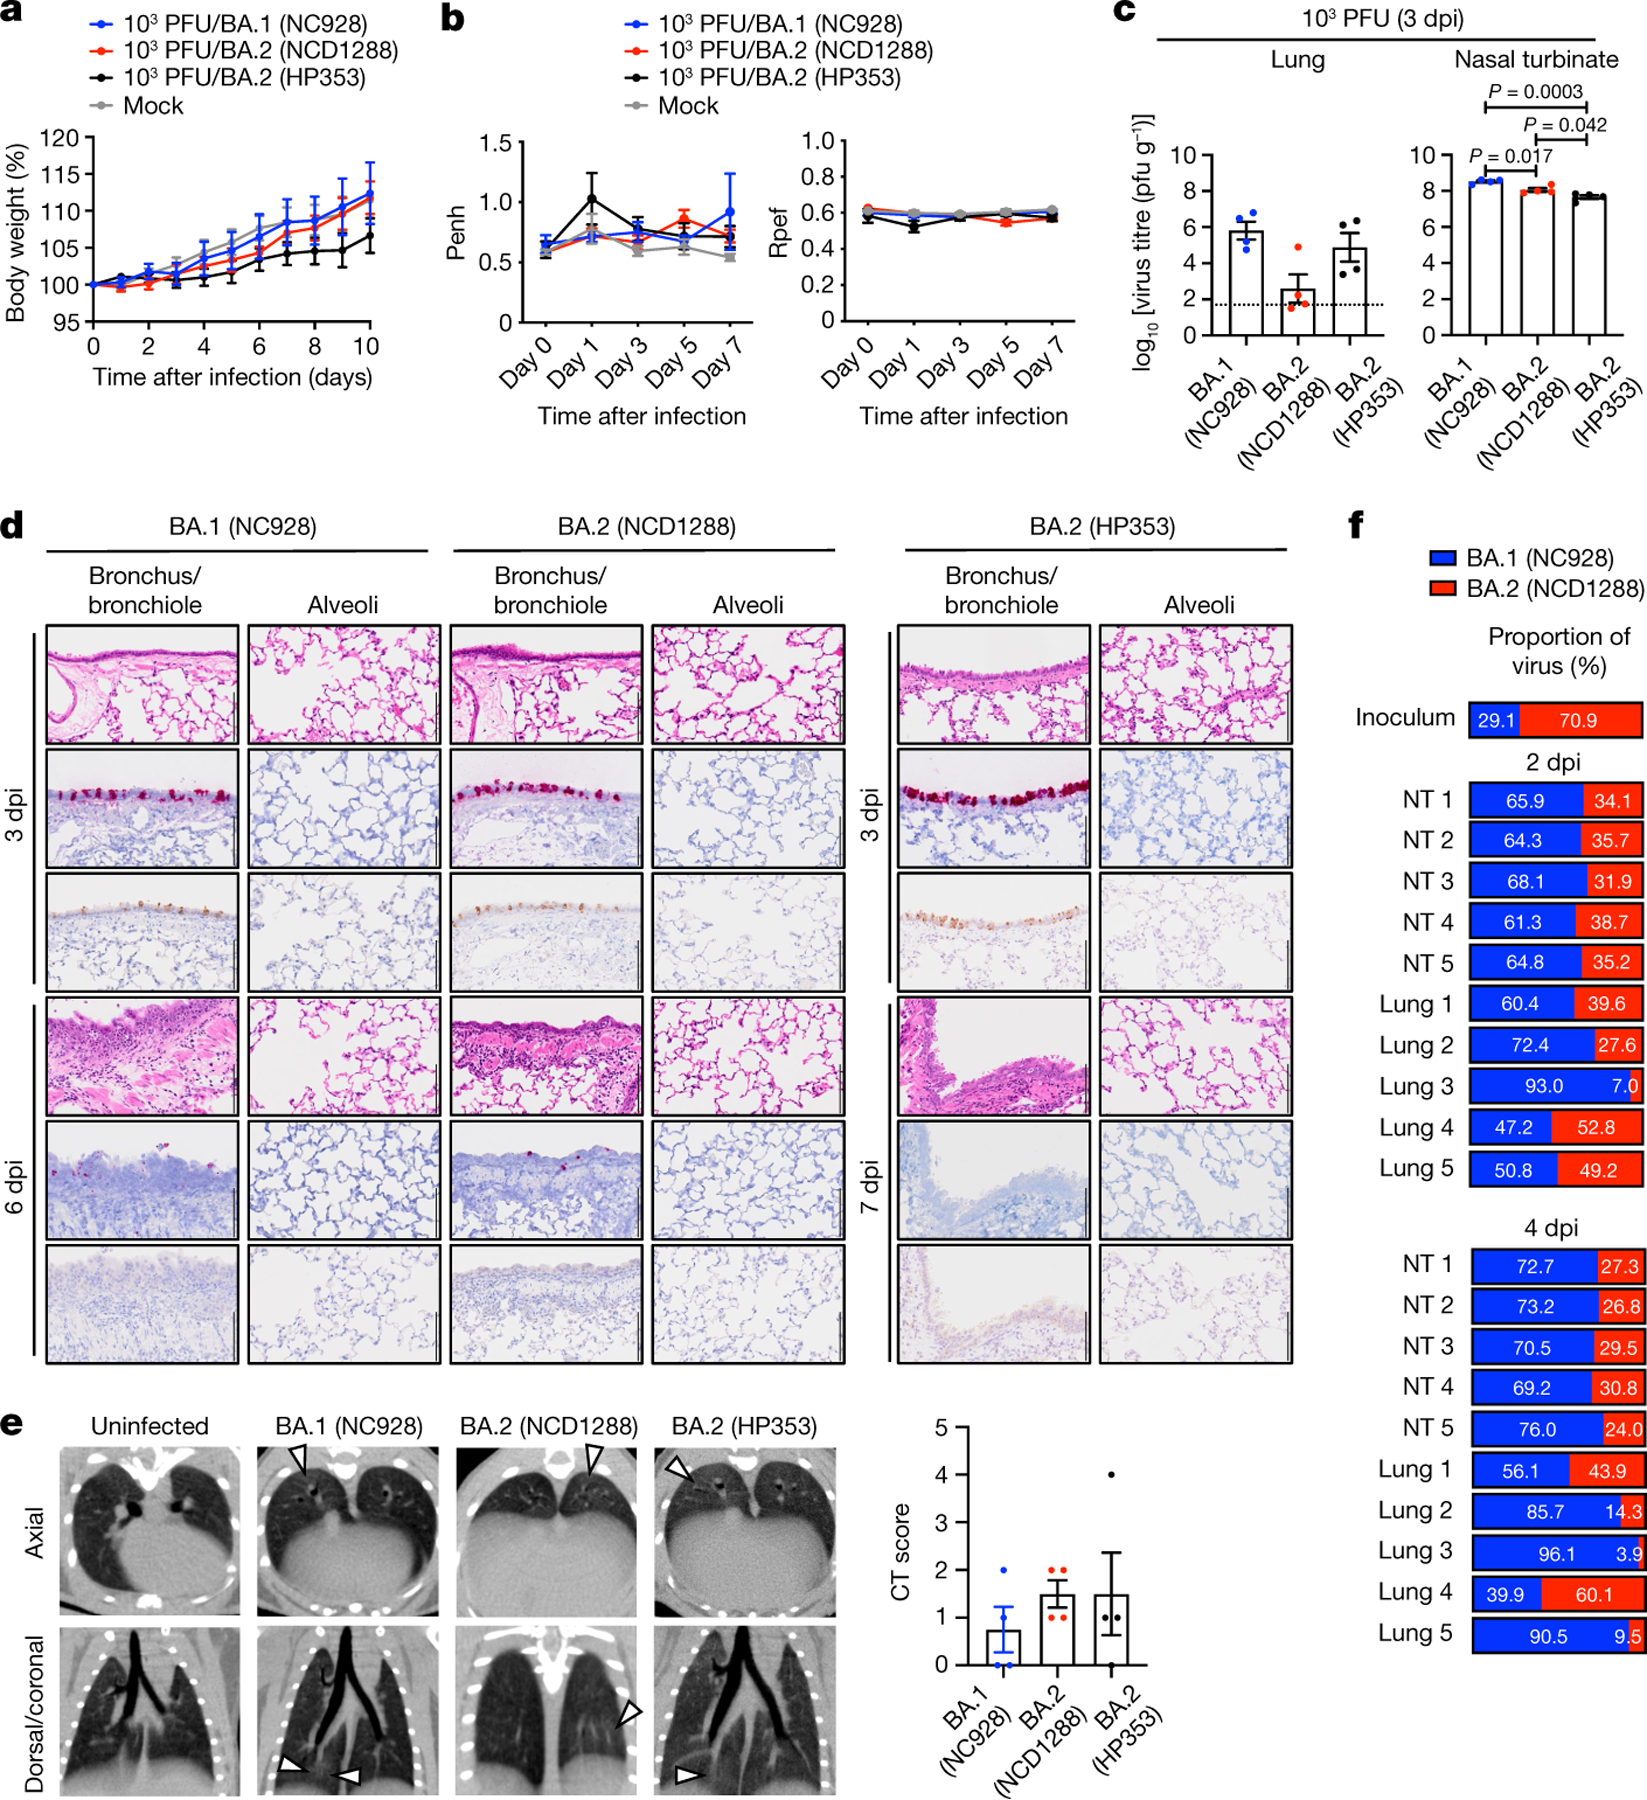
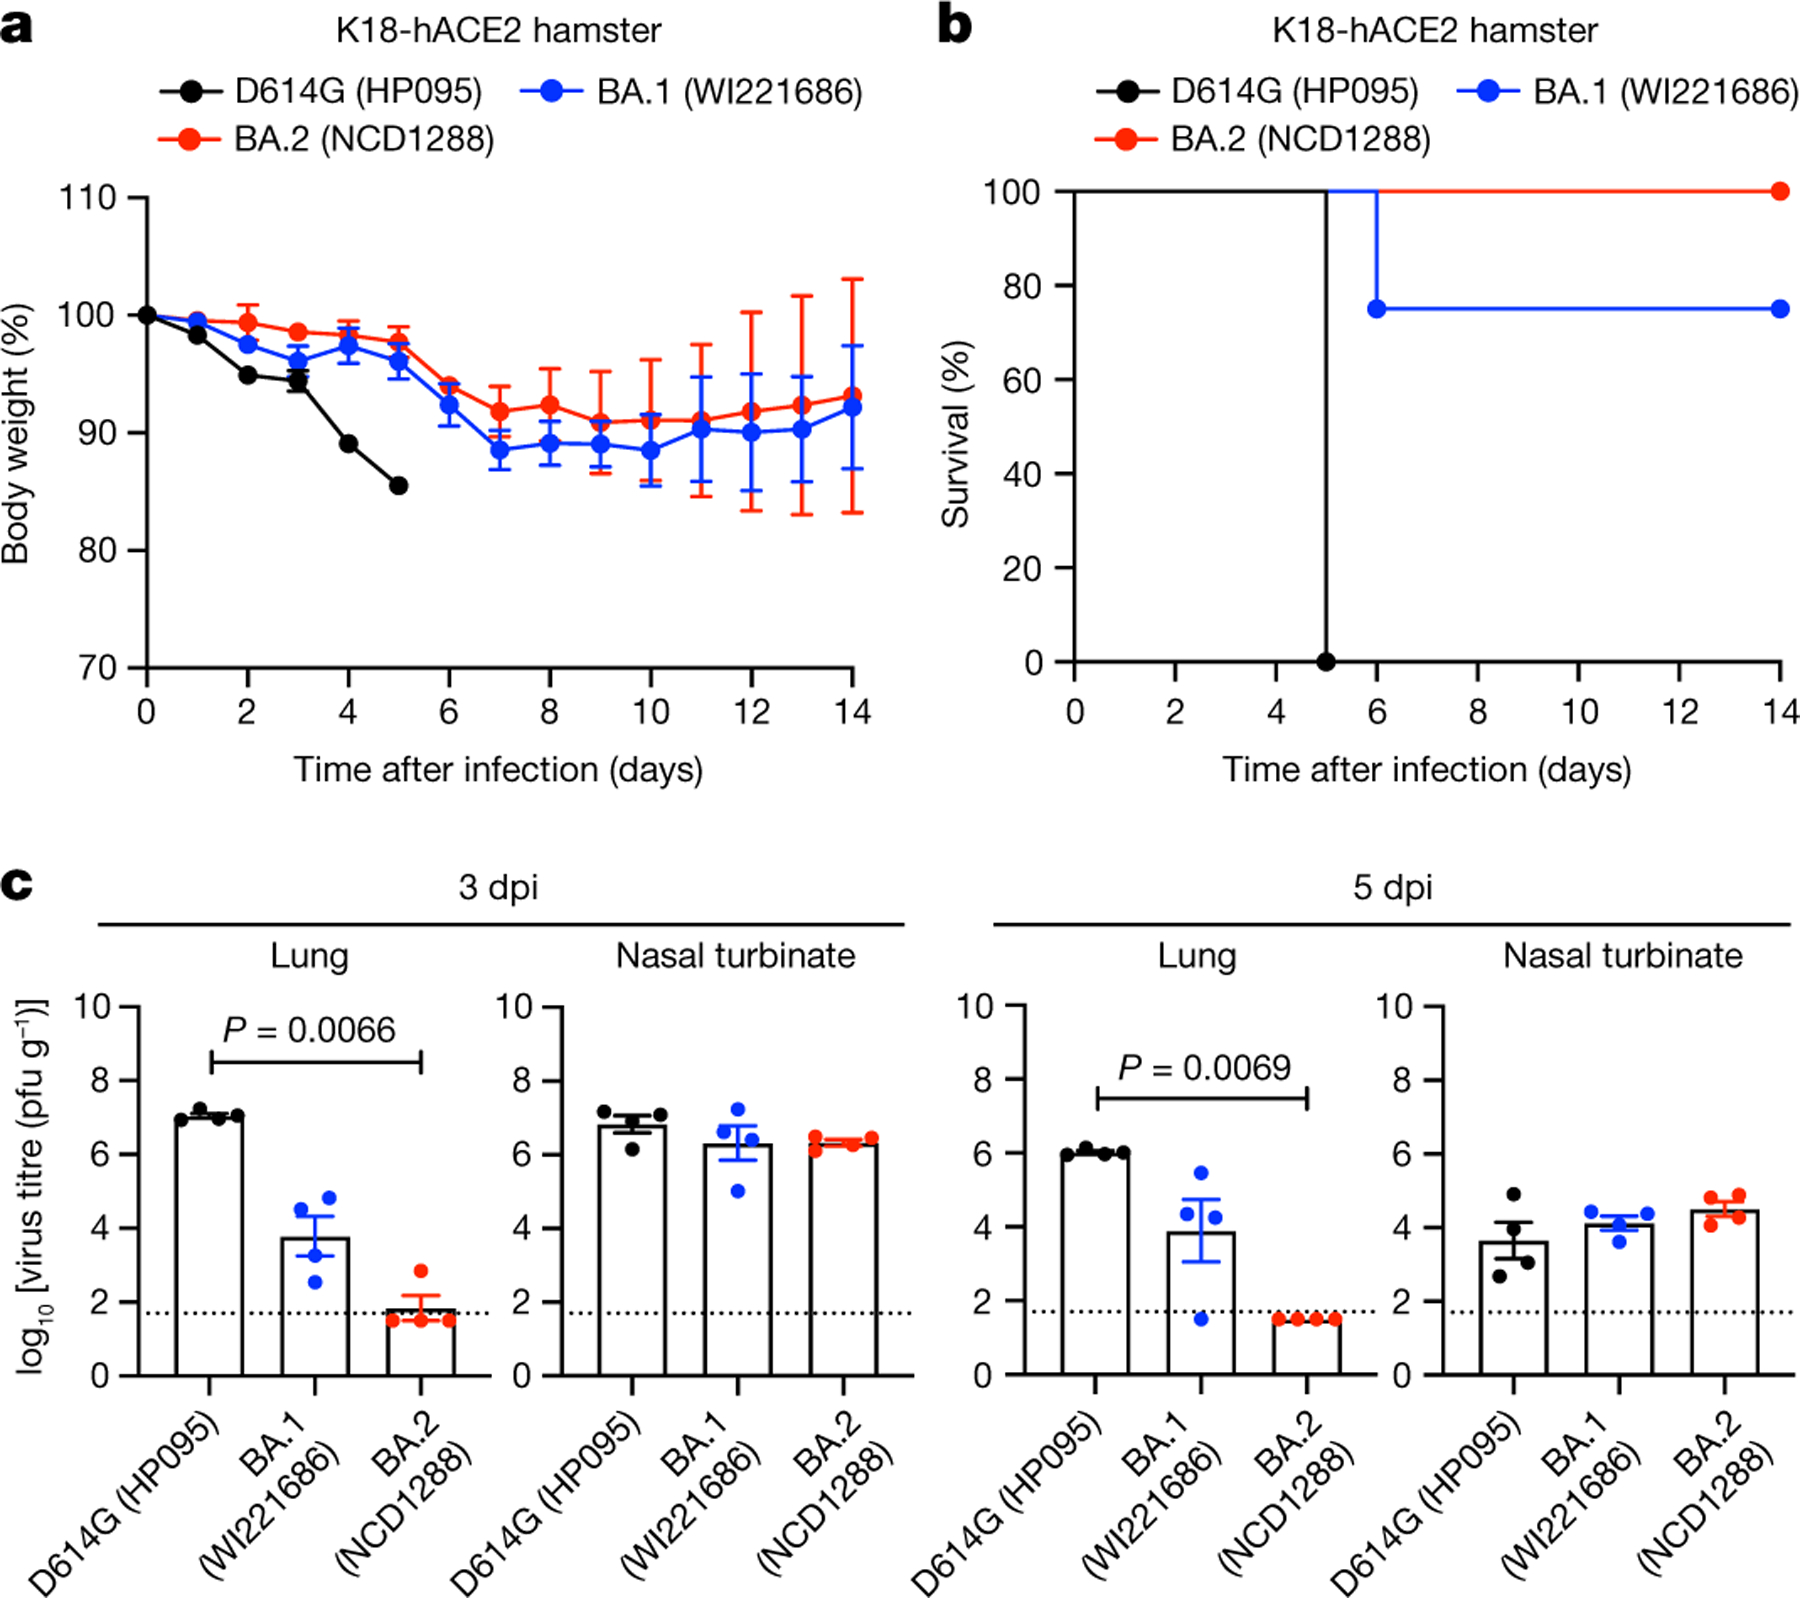
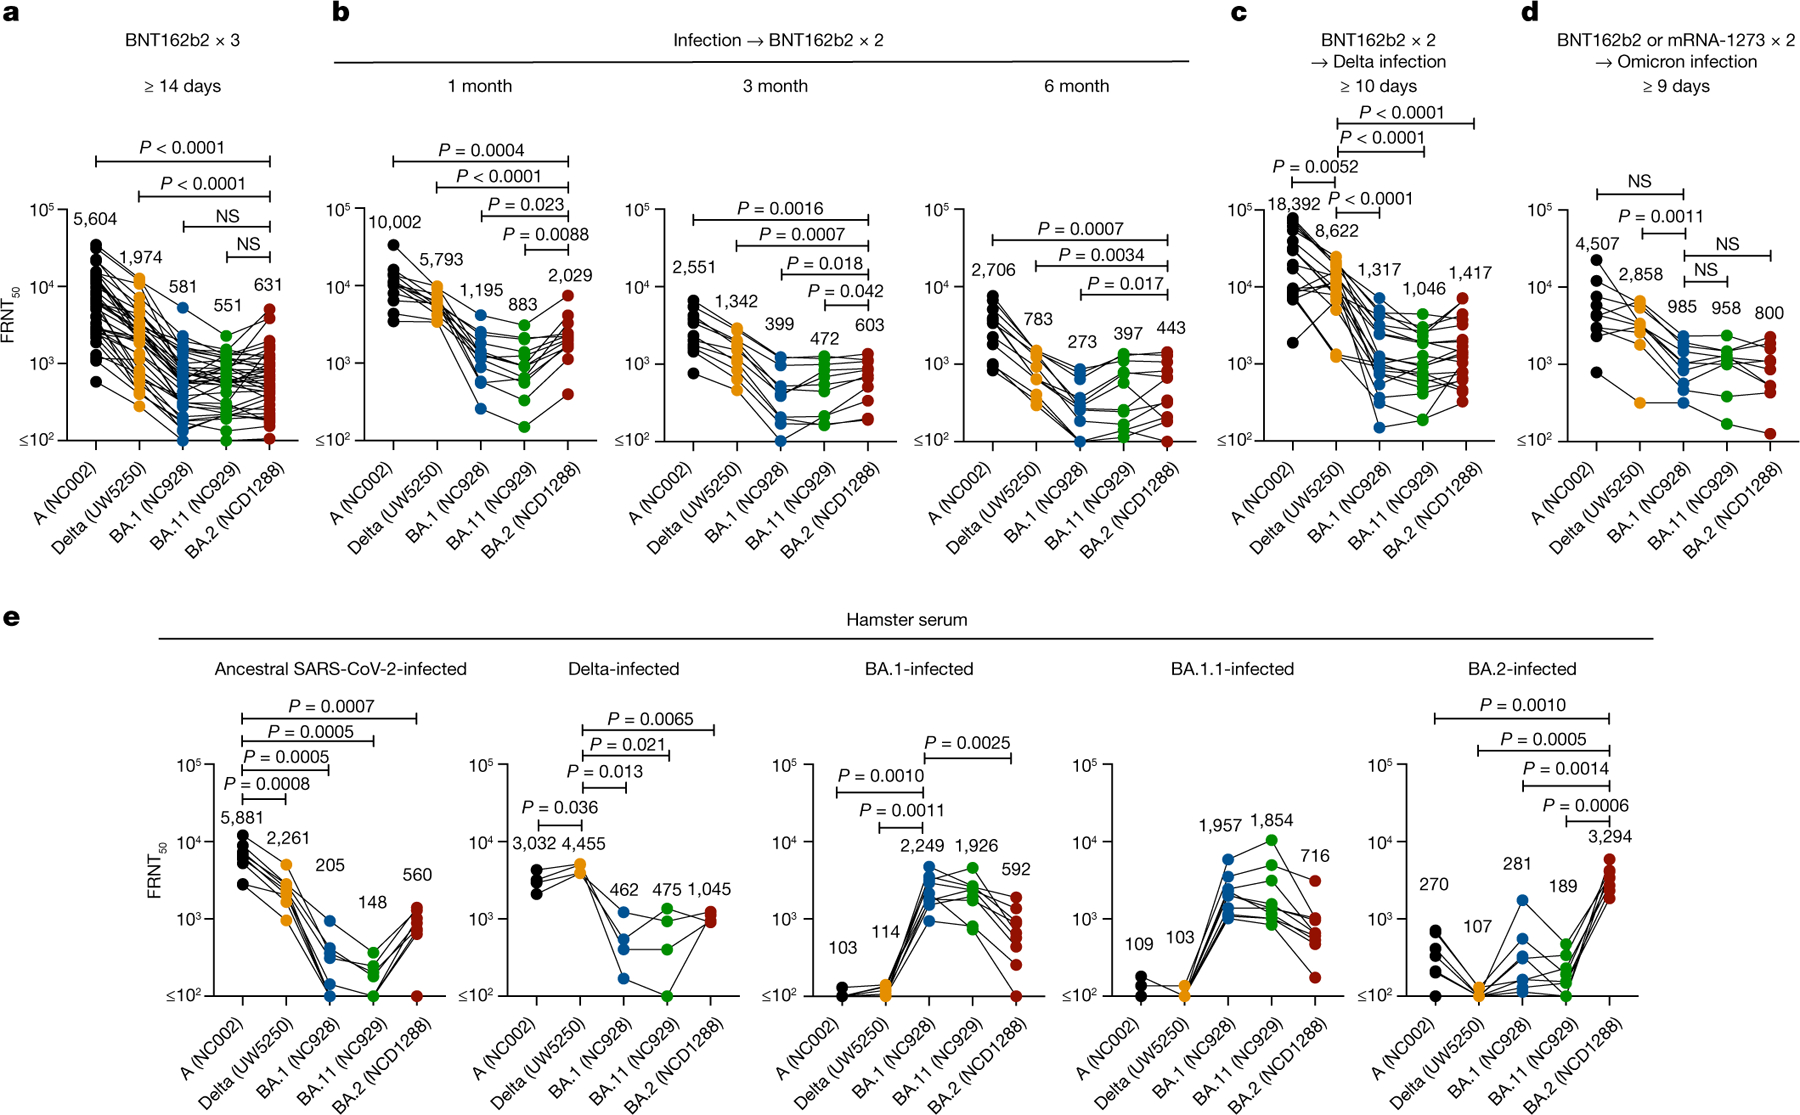
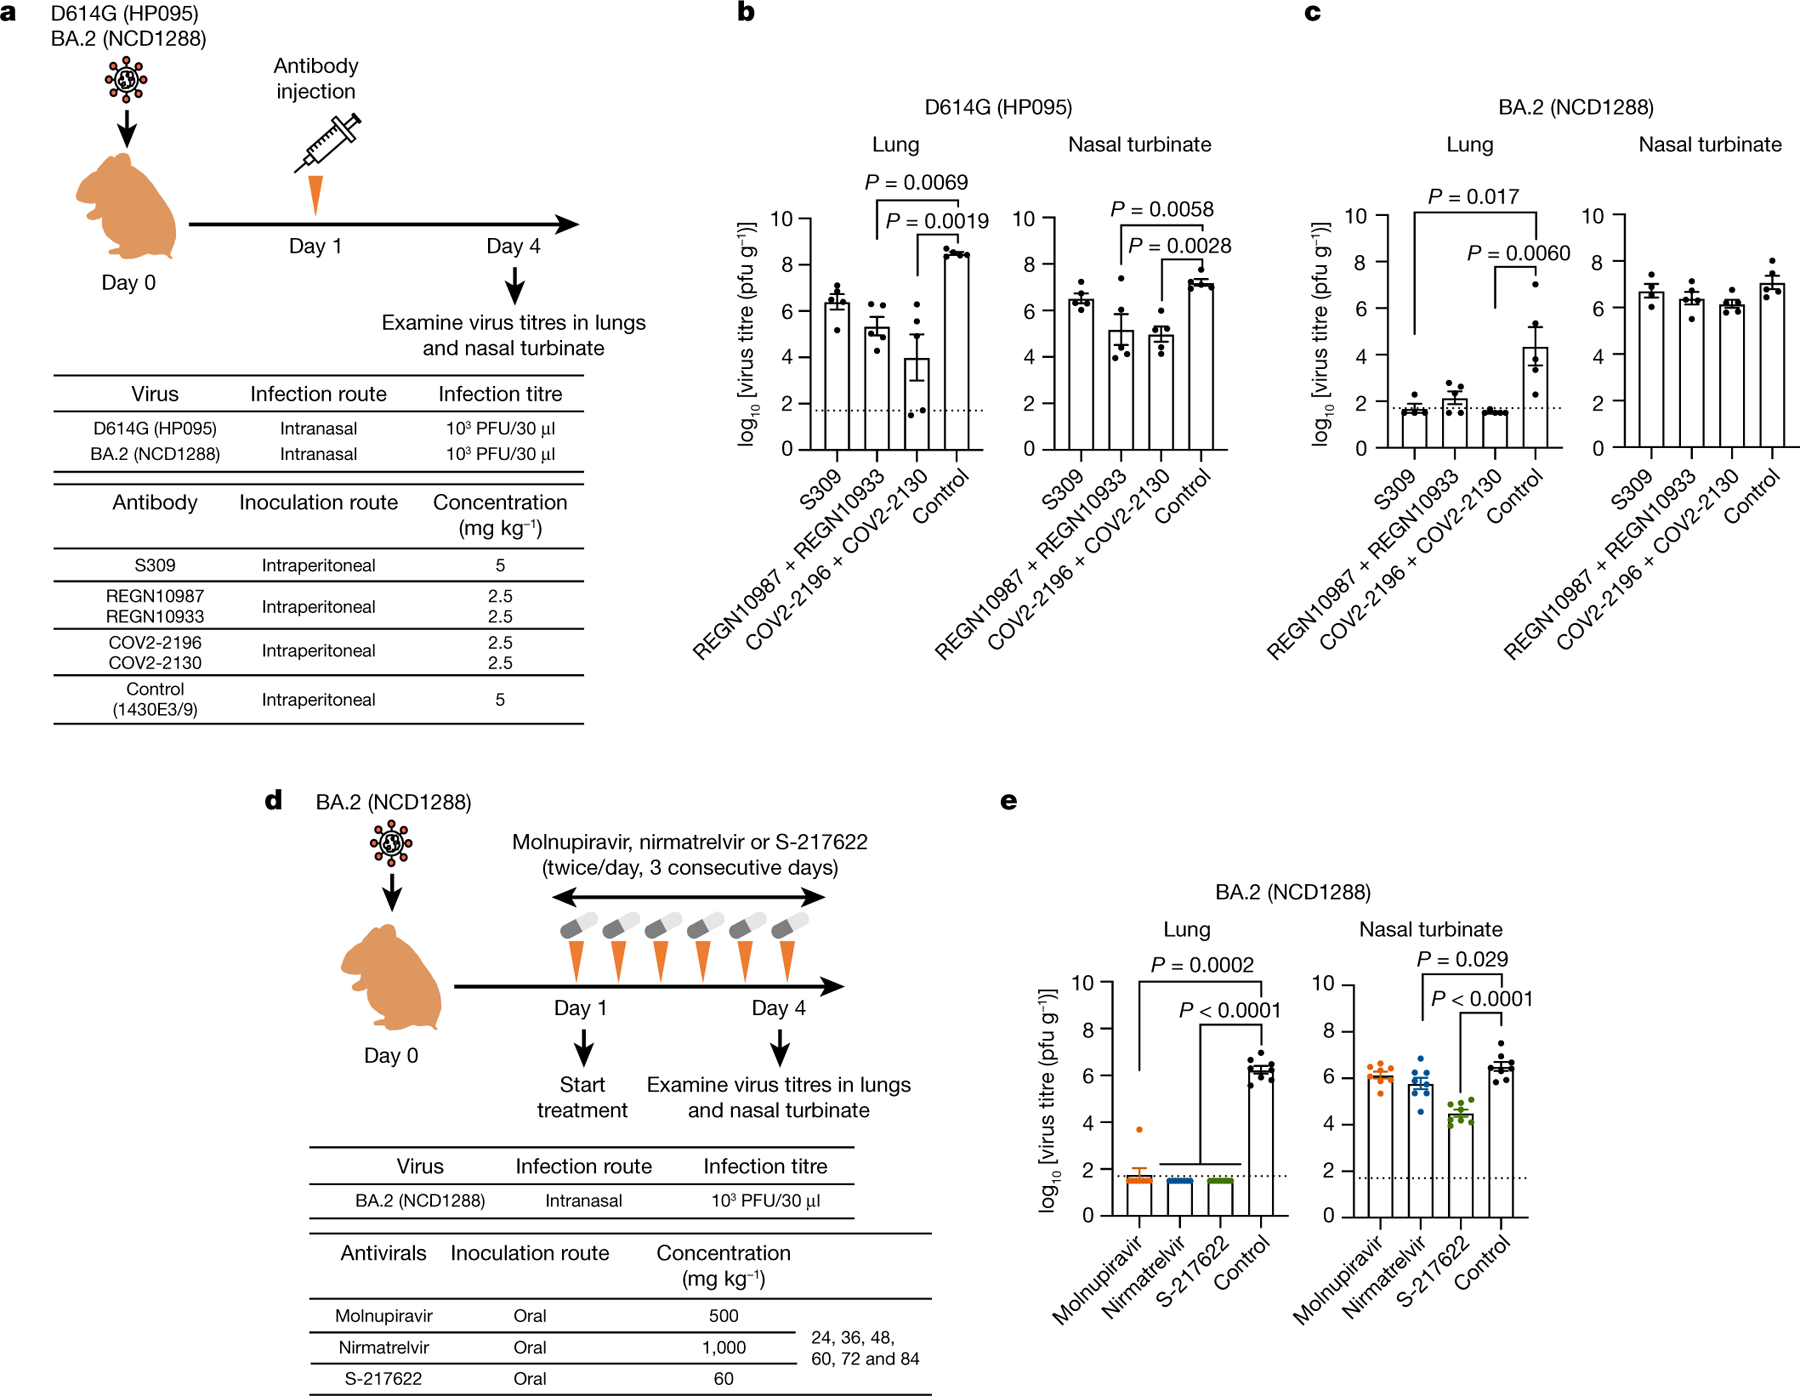
The recent emergence of SARS-CoV-2 Omicron (B.1.1.529 lineage) variants possessing numerous mutations has raised concerns of decreased effectiveness of current vaccines, therapeutic monoclonal antibodies and antiviral drugs for COVID-19 against these variants1,2. The original Omicron lineage, BA.1, prevailed in many countries, but more recently, BA.2 has become dominant in at least 68 countries3. Here we evaluated the replicative ability and pathogenicity of authentic infectious BA.2 isolates in immunocompetent and human ACE2-expressing mice and hamsters. In contrast to recent data with chimeric, recombinant SARS-CoV-2 strains expressing the spike proteins of BA.1 and BA.2 on an ancestral WK-521 backbone4, we observed similar infectivity and pathogenicity in mice and hamsters for BA.2 and BA.1, and less pathogenicity compared with early SARS-CoV-2 strains. We also observed a marked and significant reduction in the neutralizing activity of plasma from individuals who had recovered from COVID-19 and vaccine recipients against BA.2 compared to ancestral and Delta variant strains. In addition, we found that some therapeutic monoclonal antibodies (REGN10987 plus REGN10933, COV2-2196 plus COV2-2130, and S309) and antiviral drugs (molnupiravir, nirmatrelvir and S-217622) can restrict viral infection in the respiratory organs of BA.2-infected hamsters. These findings suggest that the replication and pathogenicity of BA.2 is similar to that of BA.1 in rodents and that several therapeutic monoclonal antibodies and antiviral compounds are effective against Omicron BA.2 variants.


Conflict of interest statement

Competing interests Y.K. has received unrelated funding support from Daiichi Sankyo Pharmaceutical, Toyama Chemical, Tauns Laboratories, Shionogi, Otsuka Pharmaceutical, KM Biologics, Kyoritsu Seiyaku, Shinya Corporation and Fuji Rebio. M.S.D. is a consultant for Inbios, Vir Biotechnology, Senda Biosciences and Carnival Corporation, and is on the scientific advisory boards of Moderna and Immunome. The Diamond laboratory has received unrelated funding support in sponsored research agreements from Moderna, Vir Biotechnology, Immunome and Emergent BioSolutions. The other authors declare no competing interests.

Figures

Extended Data Fig. 1 |
Extended Data Fig. 1 |. Host responses in the lungs of Balb/c mice infected with SARS-CoV-2 Omicron/BA.2, related to Fig. 1e.
Balb/c mice were intranasally infected with Beta/B.1.351 (HP01542), Omicron/BA.1 (NC928), or Omicron/BA.2 (NCD1288). Pro-inflammatory cytokine/chemokine responses in the lungs of the infected mice were assessed at 1, 2, or 3 dpi (infected mice, n = 4; naïve mice, n = 3). Vertical bars show the mean ± s.e.m. Points indicate data from individual mice. Data were analyzed by two-way ANOVA with Tukey’s multiple comparisons test. Data are from one experiment.
Extended Data Fig. 2 |
Extended Data Fig. 2 |. Host responses in the lungs of K18-hACE2 mice infected with SARS-CoV-2 Omicron/BA.2, related to Fig. 2c.
K18-hACE2 mice were intranasally inoculated with 103 PFU in 50 μL of WA1/2020 D614G, Omicron/BA.1 (NC928), or BA.2 (NCD1288). Pro-inflammatory cytokine/chemokine responses in the lungs of the infected mice were assessed at 3 dpi [WA1/2020 D614G-infected mice, n = 7; Omicron/BA.1 (NC928)-infected mice, n = 10; Omicron/BA.2 (NCD1288)-infected mice, n = 8; naïve mice, n = 5]. Vertical bars show the mean ± s.e.m. Points indicate data from individual mice. Data were analyzed by using a two-way ANOVA with Tukey’s multiple comparisons test. Cytokine and chemokine data were run in a single experiment but were obtained mice harvested in two independent experiments.
Extended Data Fig. 3 |
Extended Data Fig. 3 |. Pathogenicity in hamsters infected with SARS-CoV-2 Omicron/BA.2, related to Fig. 3a–c.
a, Syrian hamsters were intranasally inoculated with 105 PFU in 30 μL of Omicron/BA.1 (NC928), Omicron/BA.2 (NCD1288), Omicron/BA.2 (HP354), Omicron/BA.2 (TY40–385), 104.7 PFU of Omicron/BA.2 (HP353), 103 PFU of Delta/B.1.627.2 (UW5250), or PBS (mock). Body weights of virus-infected (n = 4–9) and mock-infected hamsters (n = 8, same data used in Fig. 3a) were monitored daily for 10 days. Data are presented as the mean percentages of the starting weight (± s.e.m.). b, Pulmonary function analyses in infected hamsters. Penh and Rpef were measured by using whole-body plethysmography. Mean ± s.e.m. (Omicron/BA.1 (NC928)- or Omicron/BA.2 (NCD1288)-infected hamsters, n = 4; mock-infected hamsters, n = 3). c, Virus replication in Omicron/BA.1 (NC928)- or Omicron/BA.2 (NCD1288)-infected Syrian hamsters. Hamsters (n = 4) were euthanized at 3 dpi for virus titration. Virus titers in the nasal turbinate and lungs were determined by use of plaque assays. Vertical bars show the mean ± s.e.m. Points indicate data from individual hamsters. The lower limit of detection is indicated by the horizontal dashed line. Data were analyzed by use of a one-way ANOVA with Tukey’s multiple comparisons test. Data are from one experiment.
Extended Data Fig. 4 |
Extended Data Fig. 4 |. Pathological findings in the lungs of SARS-CoV-2-infected animals, related to Fig. 3d.
Four hamsters per group were inoculated with 105 PFU of Omicron/BA.1 (NC928) or Omicron/BA.2 (NCD1288) and sacrificed at 3 or 6 dpi for histopathological examination. Representative images of the bronchi/bronchioles and alveoli of hamsters infected with BA.1 or BA.2 are shown. Upper panels, hematoxylin and eosin (H&E) staining. Middle panels, in situ hybridization targeting the nucleocapsid gene of SARS-CoV-2. Lower panels, immunohistochemistry with a rabbit polyclonal antibody that detects SARS-CoV-2 nucleocapsid protein. Scale bars, 100 μm.
Extended Data Fig. 5 |
Extended Data Fig. 5 |. micro-CT images of the lungs of SARS-CoV-2-infected Syrian hamsters, related to Figure 3e.
a-b, Syrian hamsters were intranasally inoculated with PBS (mock) (a), or with 103 PFU of Omicron/BA.1 (NC928), Omicron/BA.2 (NCD1288) or Omicron/BA.2 (HP353) (b). In addition to the images shown in Fig. 3e, the remaining representative Micro-CT images of the lungs of mock-infected hamsters (n = 2) and virus-infected hamsters (n = 3) at 7 dpi are shown. c, Representative micro-CT axial and coronal images of the lungs of four hamsters per group inoculated with 105 PFU of Omicron/BA.1 (NC928) or 105 PFU of Omicron/BA.2 (NCD1288) at 7 dpi. Lung abnormalities included minimal, patchy, ill-defined, peri-bronchial ground glass opacity (white arrowheads), and few, small, focal rounded/nodular regions (black arrows), consistent with minimal pneumonia. Coronal CT images were reformatted to optimize lesion visualization. CT severity scores for hamsters inoculated with 105 PFU of Omicron/BA.1 (n = 4) or Omicron/BA.2 (n = 4) were analyzed by using the unpaired student’s t-test. Vertical bars show the mean ± s.e.m. Points indicate data from individual hamsters. Data are from one experiment.
Extended Data Fig. 6 |
Extended Data Fig. 6 |. Comparison the relative fitness and infectivity of SARS-CoV-2 Omicron/BA.1 and Omicron/BA.2, related to Fig. 3f.
Omicron/BA.1 and Omicron/BA.2 co-infection. BA.1 (NC928) and BA.2 (NCD1288) were mixed at an equal ratio on the basis of their infectious titers, and the virus mixture (total 2 × 10³ PFU) was inoculated into five hamsters. Nasal turbinates and lungs were collected from the infected animals at 4 dpi and analyzed by using next generation sequencing (NGS). Shown are the relative proportions of BA.1 and BA.2 in the infected animals. Data are from one experiment.
Extended Data Fig. 7 |
Extended Data Fig. 7 |. Pathogenicity and replication in hACE2-expressing hamsters infected with SARS-CoV-2 Omicron/BA.2, related to Fig. 4.
a–c, hACE2-expressing Syrian hamsters (line M51) were intranasally inoculated with 103 PFU in 30 μL of D614G (HP095) or Omicron/BA.2 (NCD1288) a, b, Body weights (a) and survival (b) were monitored daily for 14 days. The values for body weights are presented as the mean percentages of the starting weight ± s.e.m. Survival data were analyzed by using the Log-rank (Mantel-Cox) test. c, Three hamsters per group were euthanized at 3 or 5 dpi for virus titration. Virus titers in the nasal turbinates and lungs were determined by use of plaque assays. Vertical bars show the mean ± s.e.m. Points indicate data from individual hamsters. The lower limit of detection is indicated by the horizontal dashed line. Data were analyzed by using the Mann-Whitney test (titers in the lungs at 3 dpi) or unpaired student’s t-test (titers in the lungs at 3 dpi, and those in the nasal turbinates at 3 and 5 dpi). Data are from one experiment.
Fig. 1 |
Fig. 1 |. BA.2 and BA.1 show similar infectivity and pathogenicity in BALB/c mice.
ac, Mice were inoculated intranasally with 105 PFU BA.1 (NC928), BA.2 (NCD1288) or PBS (mock). a, Body weights of virus-infected (n = 5) and mock-infected (n = 5) mice were monitored daily for 10 days after viral infection. Data are mean percentage ± s.e.m. of the starting weight. b, Pulmonary function analyses in virus-infected (n = 5) and mock-infected (n = 5) mice. Penh and Rpef were measured by whole-body plethysmography. Data are mean ± s.e.m. c, Virus replication in infected mice. Mice (n = 5) were euthanized at 2 and 5 dpi for virus titration. Virus titres in the nasal turbinates and lungs were determined by plaque assay. Data are mean ± s.e.m.; points represent data from individual mice. The lower limit of detection is indicated by the horizontal dashed line. Data were analysed with the Mann–Whitney test. d, Histopathological examination of the lungs of infected mice. Three mice per group were infected with 105 PFU BA.1 (NC928) or BA.2 (NCD1288) and euthanized at 2 or 5 dpi for histopathological examination. Representative images of the bronchi, and bronchioles and alveoli of mice infected with BA.1 or BA.2 are shown. Top row, haematoxylin and eosin (H&E) staining. Middle row, in situ hybridization targeting the nucleocapsid gene of SARS-CoV-2. Bottom row, immunohistochemistry using a rabbit polyclonal antibody that detects SARS-CoV-2 nucleocapsid protein. Scale bars, 100 μm. e, Heat map of cytokine and chemokine concentrations in the lungs of mice (n = 4) infected with 105 PFU BA.1 (NC928), BA.2 (NCD1288) or Beta B.1.351 (HP01542) at 1, 2 and 3 dpi (see Extended Data Fig. 1). Data are from one experiment. FC, fold change.
Fig. 2 |
Fig. 2 |. BA.2 and BA.1 show similar infectivity and pathogenicity in K18-hACE2 mice.
ac, K18-hACE2 mice were inoculated intranasally with 103 PFU WA1/2020 D614G, BA.1 (NC928) or BA.2 (NCD1288) (D614G: n = 7, BA.1 (NC928): n = 10, BA.2 (NCD1288): n = 8). Viral titres (a) and RNA levels (b) were measured at 3 dpi. Viral titres in the nasal turbinates and lungs were determined by performing plaque assays. Data are mean ± s.e.m. Points represent data from individual mice; the lower limit of detection is indicated by the horizontal dashed line. Data were analysed with the Kruskal–Wallis test with Dunn’s multiple comparisons (titres in the nasal turbinate of infected hamsters) or a one-way ANOVA with Tukey’s multiple comparisons test (titres in the lungs of mice, RNA levels in the lungs, nasal turbinates and nasal washes of infected mice). c, Heat map of cytokine and chemokine concentrations (see Extended Data Fig. 2) in the lungs of infected K18-hACE2 mice at 3 dpi. Data are from one (c) or two (a,b) experiments.
Fig. 3 |
Fig. 3 |. BA.2 and BA.1 show similar infectivity and pathogenicity in wild-type hamsters.
ae, Syrian hamsters were inoculated intranasally with 103 PFU BA.1 (NC928), BA.2 (NCD1288), BA.2 (HP353) or PBS (mock). a, Changes in body weight of virus-infected (n = 4) or mock-infected (n = 8) hamsters. b, Pulmonary function analyses by whole-body plethysmography in virus-infected (n = 4) or mock-infected (n = 3) hamsters. c, Infectious virus titres in infected hamsters at 3 dpi (n = 4). Data were analysed with the Kruskal–Wallis test with Dunn’s multiple comparisons (lungs) or one-way ANOVA with Tukey’s multiple comparisons (nasal turbinates). d, Histopathological examination of the lungs of infected hamsters at 3, 6 or 7 dpi. Hamsters were infected with 103 PFU BA.1 (NC928) (n = 4), BA.2 (NCD1288) (n = 4) or BA.2 (HP353) (n = 3). Representative images of the bronchi and bronchioles, and alveoli of infected hamsters are shown. Top row, H&E staining. Middle row, in situ hybridization for SARS-CoV-2 viral RNA. Bottom row, immunohistochemistry for SARS-CoV-2 nucleocapsid protein. Scale bars, 100 μm. e, Micro-CT images of the lungs of mock-infected (n = 3) or virus-infected (n = 4) hamsters at 7 dpi. Lung abnormalities included minimal, patchy, ill-defined, peri-bronchial ground glass opacity (white arrowheads). CT severity scores for infected hamsters (n = 4). f, Co-infection with BA.1 and BA.2. BA.1 (NC928) and BA.2 (NCD1288) were mixed at an equal ratio on the basis of their infectious titres, and the virus mixture (total 2 × 10⁵ PFU) was inoculated into hamsters (n = 5). Shown are the relative proportions of BA.1 and BA.2 in the lung and nasal turbinate (NT) of infected hamsters 1–5 at 2 and 4 dpi. Data are from one experiment. Data in ac,e are mean ± s.e.m.
Fig. 4 |
Fig. 4 |. BA.2 and BA.1 show similar infectivity and pathogenicity in hACE2-expressing hamsters.
ac, hACE2-expressing Syrian hamsters were inoculated intranasally with 103 PFU of D614G (HP095), BA.1 (WI221686) or BA.2 (NCD1288). a,b, Body weight (a) and survival (b) were monitored daily for 14 days. Data are mean percentage of the starting weight ± s.e.m. Survival data were analysed with the log-rank (Mantel–Cox) test. c, Four hamsters per group were euthanized at 3 or 5 dpi for virus titration. Virus titres in the nasal turbinates and lungs were determined using plaque assay. Data are mean ± s.e.m.; points represent data from individual hamsters; the lower limit of detection is indicated by the horizontal dashed line. Data were analysed with the Kruskal–Wallis test with Dunn’s multiple comparisons (titres in the lungs of infected hamsters) or one-way ANOVA with Tukey’s multiple comparisons (titres in the nasal turbinate). Data are from one experiment.
Fig. 5 |
Fig. 5 |. Antibody responses to BA.2 variants.
a, Neutralizing antibody titres of human plasma or serum obtained from individuals immunized with three doses of the BNT162b2 vaccine (n = 39). Samples were collected at least 14 days after the third dose. b, Neutralizing antibody titres of human plasma obtained from individuals immunized with two doses of the BNT162b2 vaccine after previous infection. Samples were collected 1, 3 or 6 months after the second immunization (n = 13, 11 or 12, respectively). c, Neutralizing antibody titres of human plasma or serum obtained from individuals who were infected with the Delta variant after two doses of the BNT162b2 vaccine (n = 20). Samples were collected at least ten days after symptom onset. d, Neutralizing antibody titres of human plasma obtained from individuals who were infected with the Omicron variant after two doses of the BNT162b2 or mRNA-1273 vaccine (n = 10). Samples were collected 9–16 days after symptom onset. Individual titres and detailed information about the participants are shown in the source data. e, Neutralizing antibody titres of serum obtained from hamsters infected with ancestral SARS-CoV-2 (NC002) (n = 9), Delta B.1.627.2 (UW-5250) (n = 4), BA.1 (NC928) (n = 9), BA1.1 (NC929) (n = 10) or BA.2 (NCD1288) (n = 8). Samples were collected three weeks after infection. P-values were calculated by one-way ANOVA with Dunnett’s multiple comparisons test. Each dot represents data from one individual. Geometric mean titres are shown.
Fig. 6 |
Fig. 6 |. Therapeutic effects of monoclonal antibodies and antiviral compounds against BA.2 variants.
a, Schematic of the experimental workflow for assessing the therapeutic effects of monoclonal antibodies. b, Syrian hamsters were inoculated intranasally with 103 PFU of BA.2 (NCD1288) or D614G (HP095). One day after infection, hamsters were injected intraperitoneally with a single dose of REGN10987 + REGN10933 or COV2-2196 + COV2-2130 2.5 mg kg−1 each) or S309 as monotherapy (5 mg kg−1). A human monoclonal antibody (1430E3/9) against influenza B virus haemagglutinin was injected as a control. Four to five hamsters per group were euthanized at 4 dpi for virus titration. c, Schematic of the experimental workflow for assessing the therapeutic effects of antiviral compounds. d, Syrian hamsters were intranasally inoculated with 103 PFU of BA.2 (NCD1288). One day after infection, hamsters were treated with: 500 mg kg−1 molnupiravir, 1,000 mg kg−1 nirmatrelvir or 60 mg kg−1 S-217622 orally twice daily for 3 days. Methylcellulose served as a control for oral treatment. Eight hamsters per group were euthanized at 4 dpi for virus titration. Viral titres in the nasal turbinates and lungs were determined by plaque assay. Data are mean ± s.e.m.; points indicate data from individual hamsters; the lower limit of detection is indicated by the horizontal dashed line. For comparison of the lung and nasal turbinate titres of BA.2 (NCD1288)- and D614G (HP095)-infected hamster groups, we used a Kruskal–Wallis test with Dunn’s multiple comparisons and one-way ANOVA with Dunnett’s multiple comparisons, respectively. Data are from one experiment.

Update of

  • Characterization and antiviral susceptibility of SARS-CoV-2 Omicron/BA.2.
    Kawaoka Y, Uraki R, Kiso M, Iida S, Imai M, Takashita E, Kuroda M, Halfmann P, Loeber S, Maemura T, Yamayoshi S, Fujisaki S, Wang Z, Ito M, Ujie M, Iwatsuki-Horimoto K, Furusawa Y, Wright R, Chong Z, Ozono S, Yasuhara A, Ueki H, Sakai Y, Li R, Liu Y, Larson D, Koga M, Tsutsumi T, Adachi E, Saito M, Yamamoto S, Matsubara S, Hagihara M, Mitamura K, Sato T, Hojo M, Hattori SI, Maeda K, Okuda M, Murakami J, Duong C, Godbole S, Douek D, Watanabe S, Ohmagari N, Yotsuyanagi H, Diamond M, Hasegawa H, Mitsuya H, Suzuki T. Kawaoka Y, et al. Res Sq [Preprint]. 2022 Feb 24:rs.3.rs-1375091. doi: 10.21203/rs.3.rs-1375091/v1. Res Sq. 2022. Update in: Nature. 2022 Jul;607(7917):119-127. doi: 10.1038/s41586-022-04856-1. PMID: 35233565 Free PMC article. Updated. Preprint.

References

    1. Callaway E & Ledford H How bad is Omicron? What scientists know so far. Nature 600, 197–199 (2021). - PubMed
    1. Flemming A Omicron, the great escape artist. Nat. Rev. Immunol 22, 75 (2022). - PMC - PubMed
    1. World Health Organization. Weekly epidemiological update on COVID-19, 5 April 2022, https://www.who.int/publications/m/item/weekly-epidemiological-update-on... (2022).
    1. Yamasoba D et al. Virological characteristics of the SARS-CoV-2 Omicron BA.2 spike. Cell 185,2103–2115.e19 (2022). - PMC - PubMed
    1. Lyngse F et al. Transmission of SARS-CoV-2 Omicron VOC subvariants BA.1 and BA.2: evidence from Danish households. Preprint at medRxiv 10.1101/2022.01.28.22270044 (2022). - DOI

MeSH terms

Substances

Supplementary concepts