

Proton metabolic mapping of the brain at 7 T using a two-dimensional free induction decay-echo-planar spectroscopic imaging readout with lipid suppression
- PMID: 35577344
- PMCID: PMC9541868
- DOI: 10.1002/nbm.4771
Proton metabolic mapping of the brain at 7 T using a two-dimensional free induction decay-echo-planar spectroscopic imaging readout with lipid suppression
Abstract
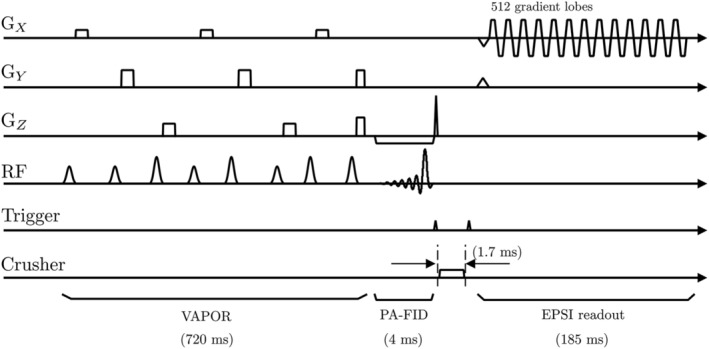
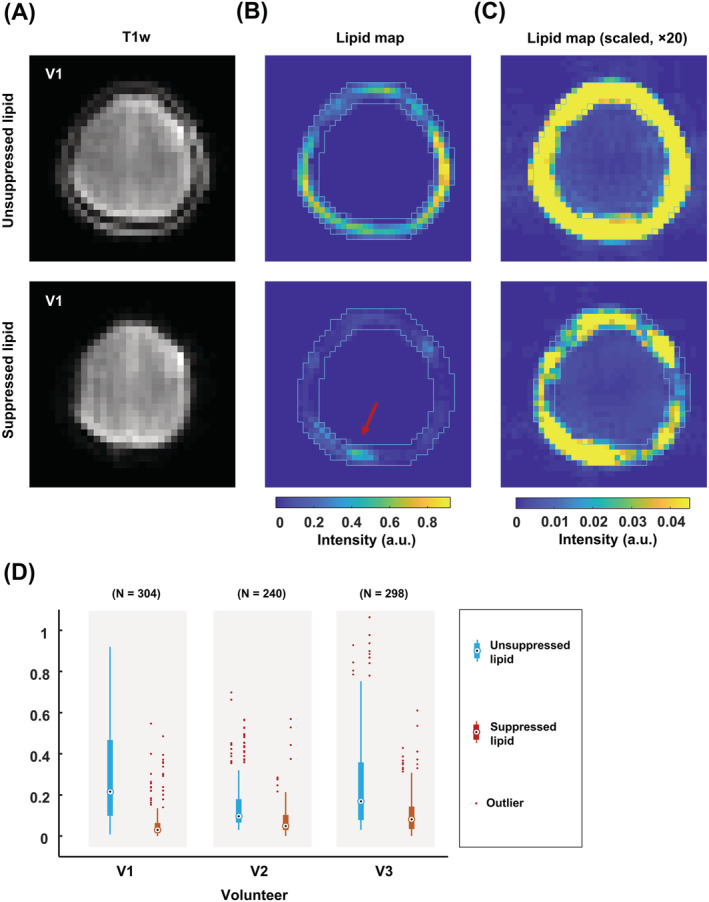
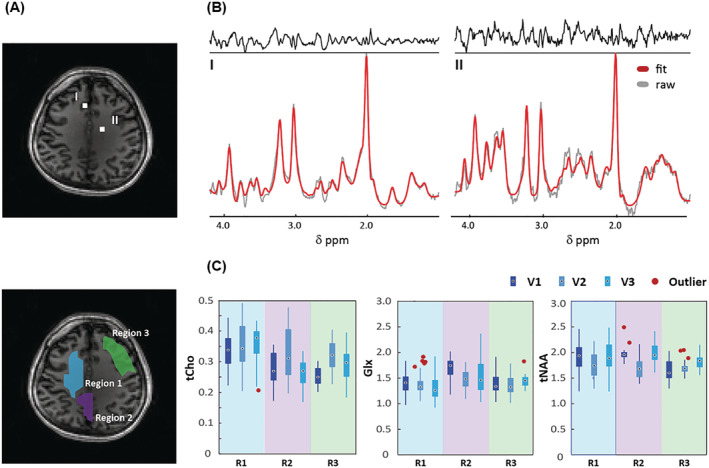
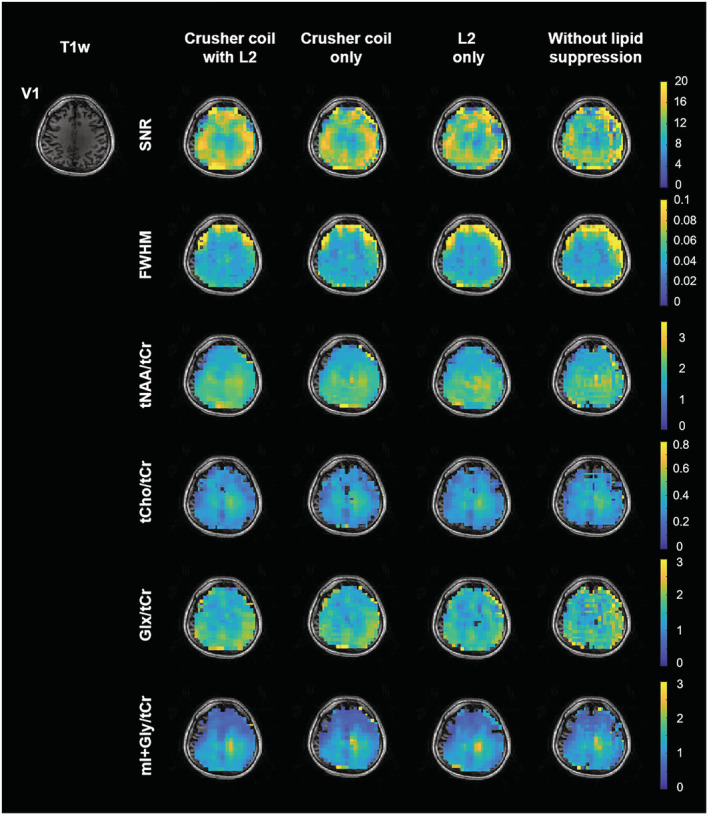
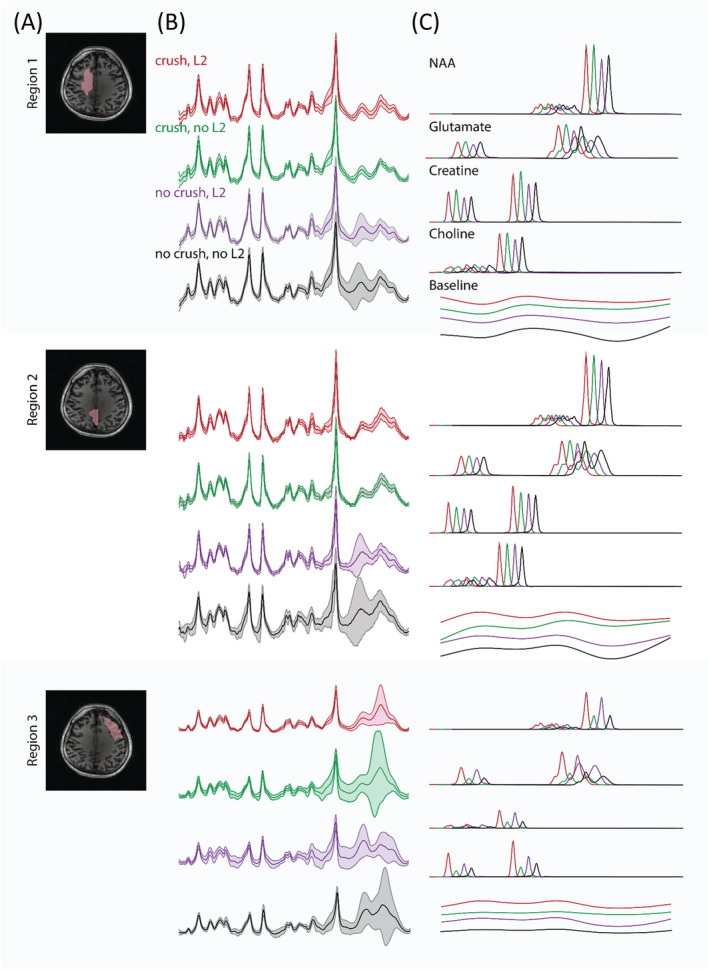
The increased signal-to-noise ratio (SNR) and chemical shift dispersion at high magnetic fields (≥7 T) have enabled neuro-metabolic imaging at high spatial resolutions. To avoid very long acquisition times with conventional magnetic resonance spectroscopic imaging (MRSI) phase-encoding schemes, solutions such as pulse-acquire or free induction decay (FID) sequences with short repetition time and inner volume selection methods with acceleration (echo-planar spectroscopic imaging [EPSI]), have been proposed. With the inner volume selection methods, limited spatial coverage of the brain and long echo times may still impede clinical implementation. FID-MRSI sequences benefit from a short echo time and have a high SNR per time unit; however, contamination from strong extra-cranial lipid signals remains a problem that can hinder correct metabolite quantification. L2-regularization can be applied to remove lipid signals in cases with high spatial resolution and accurate prior knowledge. In this work, we developed an accelerated two-dimensional (2D) FID-MRSI sequence using an echo-planar readout and investigated the performance of lipid suppression by L2-regularization, an external crusher coil, and the combination of these two methods to compare the resulting spectral quality in three subjects. The reduction factor of lipid suppression using the crusher coil alone varies from 2 to 7 in the lipid region of the brain boundary. For the combination of the two methods, the average lipid area inside the brain was reduced by 2% to 38% compared with that of unsuppressed lipids, depending on the subject's region of interest. 2D FID-EPSI with external lipid crushing and L2-regularization provides high in-plane coverage and is suitable for investigating brain metabolite distributions at high fields.
Keywords: 7 T; EPSI; FID; L2-regularization; MRSI; crusher coil; lipid suppression; pulse acquire.
© 2022 The Authors. NMR in Biomedicine published by John Wiley & Sons Ltd.
Figures
Similar articles
-
Over-discretized SENSE reconstruction and B0 correction for accelerated non-lipid-suppressed 1 H FID MRSI of the human brain at 9.4 T.NMR Biomed. 2018 Dec;31(12):e4014. doi: 10.1002/nbm.4014. Epub 2018 Oct 18. NMR Biomed. 2018. PMID: 30334288
-
Lipid suppression via double inversion recovery with symmetric frequency sweep for robust 2D-GRAPPA-accelerated MRSI of the brain at 7 T.NMR Biomed. 2015 Nov;28(11):1413-25. doi: 10.1002/nbm.3386. Epub 2015 Sep 15. NMR Biomed. 2015. PMID: 26370781 Free PMC article.
-
High-resolution proton metabolic mapping of the human brain at 7 T using free induction decay rosette spectroscopic imaging.NMR Biomed. 2024 Jan;37(1):e5042. doi: 10.1002/nbm.5042. Epub 2023 Sep 28. NMR Biomed. 2024. PMID: 37767769
-
Accelerated MR spectroscopic imaging-a review of current and emerging techniques.NMR Biomed. 2021 May;34(5):e4314. doi: 10.1002/nbm.4314. Epub 2020 May 12. NMR Biomed. 2021. PMID: 32399974 Free PMC article. Review.
-
Non-invasive MR thermography using the water proton chemical shift.Int J Hyperthermia. 2005 Sep;21(6):547-60. doi: 10.1080/02656730500204495. Int J Hyperthermia. 2005. PMID: 16147439 Review.
Cited by
-
3D deuterium metabolic imaging (DMI) of the human liver at 7 T using low-rank and subspace model-based reconstruction.Magn Reson Med. 2025 May;93(5):1860-1873. doi: 10.1002/mrm.30395. Epub 2024 Dec 22. Magn Reson Med. 2025. PMID: 39710859 Free PMC article.
-
ECCENTRIC: A fast and unrestrained approach for high-resolution in vivo metabolic imaging at ultra-high field MR.Imaging Neurosci (Camb). 2024 Oct 14;2:1-20. doi: 10.1162/imag_a_00313. eCollection 2024 Oct 1. Imaging Neurosci (Camb). 2024. PMID: 39679200 Free PMC article.
References
-
- de Graaf RA. Vivo NMR Spectroscopy: Principles and Techniques. Wiley; 2019.
Publication types
MeSH terms
Substances
LinkOut - more resources
Full Text Sources
